4910
Classification of Plaque Composition in Peripheral Arterial Disease with Multi-Contrast Histology using 7 Tesla and a Variational AutoEncoder1Houston Methodist Research Institute, Houston, TX, United States, 2Houston Methodst Research Institute, Houston, TX, United States, 3Houston Methodist Hospital, Houston, TX, United States
Synopsis
Keywords: Machine Learning/Artificial Intelligence, High-Field MRI, ultra-short TE, 7 Tesla
To differentiate soft versus hard peripheral arterial disease (PAD) plaques, a dedicated ultra-high field magnetic resonance imaging (MRI) histology protocol using three different image contrast (ultra-short TE, T1-weighted and T2-weighted) was used to scan on a clinical 7 Tesla human MRI scanner six amputated legs immediately after surgery that were harboring PAD lesions. A 2D convolutional network (CNN) variational autoencoder (VAE) was created. For each lesion, average classification values along the long axis of the artery were determined from latent space and ranged from partially occluded to patent (three lesions), soft-plaque occluded (two) and hard-plaque occluded (one).Introduction
With the goal to differentiate soft peripheral arteral disease (PAD) plaques (i.e. crossable in an endovascular approach) versus hard PAD plaques, a dedicated ultra-high field magnetic resonance imaging (MRI) histology protocol (three imaging contrasts: ultra-short TE, T1-weighted and T2-weighted) was used to scan on a clinical 7 Tesla human MRI scanner (Siemens MAGNETOM Terra) with the clinical 28 channel knee coil six amputated legs immediately after surgery that were harboring different lesions. This setup mimics the in-vivo setup used in a separate patient study and is therefore optimal for in-vivo MRI protocol development. The duration of the MRI examination was less than one hour which is considered tolerable in a clinical setting.Methods
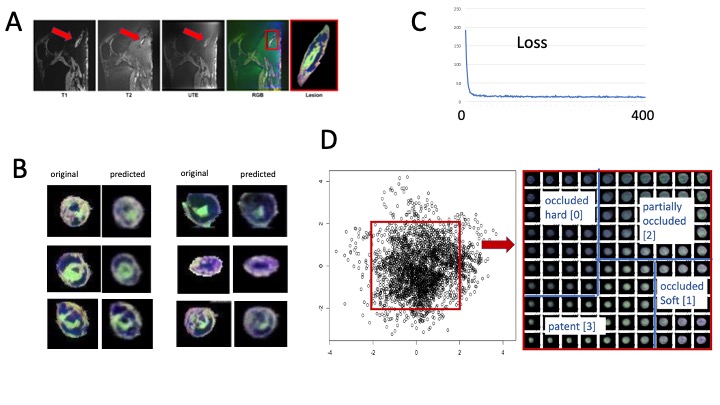
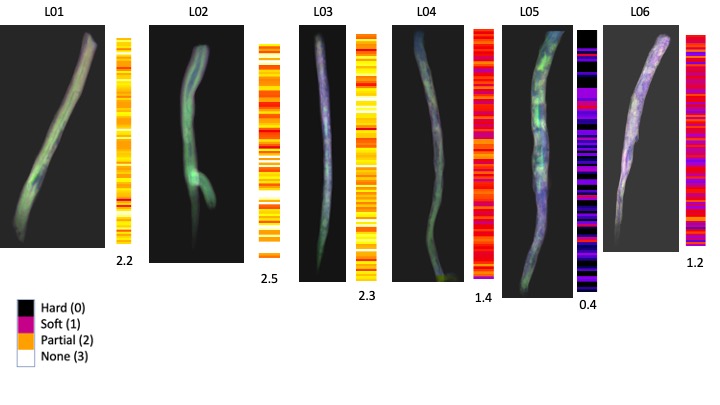
Scan Parameters: The MRI protocol used UTE, T1-weighted and T2-weighted contrast with the following parameters: UTE (PETRA, FOV: 150 mm, phase FOV 100 %, in-plane resolution 0.2x0.2 mm, slice thickness: 0.2 mm, TR 10 ms, TE 0.07 ms, FA 4. T2-weighted (DESS, FOV 160 mm, phase FOV 87.5 %, slice thickness 0.2 mm, TR 12.57 ms, TE 6 ms, FA 25, water excitation, 512 slices). T1-weighted (T1-weighted: 3D FLASH, FOV 160 mm, phase FOV 87.6 %, in-plane resolution 0.2x0.2 mm, slice thickness 0.2 mm, TR 9.5 ms, TE 4.09 ms, FA 7, GRAPPA 2, phase encode direction A>>P, 512 slices, water excitation). Image Preprocessing: Image volumes were co-registered with the 3D Slicer software [2] using the General Registration module (with the options ‘useMomentsAlign’ and ‘Rigid+Scale, 7 degrees of freedom’). The aligned volumes were exported in NIFTI format and after loaded into ImageJ [3], combined into an RGB stack. Image volumes were reconstructed into the axial plane, auto-cropped and exported as jpg images (total number 2850, size 64x64 pixels). Deep Learning Analysis: A 2D convolutional network (CNN) variational autoencoder (VAE) was created in Tensorflow (Pythoon 3.0, four convolutional layers, [64,64,16], [32,32,32], [16,16,64], [8,8,64] and one densely connected layer [4096] feeding into the latent layer of dimension 2. The corresponding decoder consisted of corresponding layers to recreate the image). Plaque classification: Areas in latent space were identified into four regions together with a numerical classifier to characterize each of the following regions: hard plaque occluded (numerical classifier value: 0), soft plaque occluded (1), partially occluded (2) and patent (3). For each lesion, the numerical classifier along the long axis of the artery was determined for each slice and an average value over all slices was calculated.Results
Multi-contrast image registration succeeded in each case (figure 1 A). A high variety of details in the registered RGB images was visible with hard plaque components black or dark gray, soft plaque components blue, vessel wall purple and patent lumen green (figure 1B). Images predicted by the 2CNN VAE were in very good agreement with the original images (figure 1B). Loss of the VAE during training was converged after approximately 100 iterations (figure 1C). Latent space was divided into the four regions indicative of the four different image classes as shown (figure 1D). The average value of the numerical classifier varied between 0.4 (hard) to 2.5 (soft) (figure 2).Conclusion
Using a 2D convolutional neural network variational autoencoder, peripheral arterial lesions were classified as predominantly soft or hard by a continuous numerical classifier. Longitudinal variation of this classifier may identify locally hardened regions for contributing in planning the endovascular intervention.Acknowledgements
We gratefully acknowledge the support by the Katz Investigator Grant.References
[1] Roy T, Liu G, Shaikh N, Dueck AD, Wright GA. Puncturing Plaques. J Endovasc Ther. 2017 Feb;24(1):35-46. doi: 10.1177/1526602816671135. Epub 2016 Sep 25. PMID: 27659155.
[2] Roy TL, Chen HJ, Dueck AD, Wright GA. Magnetic resonance imaging characteristics of lesions relate to the difficulty of peripheral arterial endovascular procedures. J Vasc Surg. 2018 Jun;67(6):1844-1854.e2. doi: 10.1016/j.jvs.2017.09.034. Epub 2017 Dec 13. PMID: 29248239.
[3] Fedorov A, Beichel R, Kalpathy-Cramer J, Finet J, Fillion-Robin JC, Pujol S, Bauer C, Jennings D, Fennessy F, Sonka M, Buatti J, Aylward S, Miller JV, Pieper S, Kikinis R. 3D Slicer as an image computing platform for the Quantitative Imaging Network. Magn Reson Imaging. 2012 Nov;30(9):1323-41. doi: 10.1016/j.mri.2012.05.001. Epub 2012 Jul 6. PMID: 22770690; PMCID: PMC3466397.
[4] Fedorov A, Beichel R, Kalpathy-Cramer J, Finet J, Fillion-Robin JC, Pujol S, Bauer C, Jennings D, Fennessy F, Sonka M, Buatti J, Aylward S, Miller JV, Pieper S, Kikinis R. 3D Slicer as an image computing platform for the Quantitative Imaging Network. Magn Reson Imaging. 2012 Nov;30(9):1323-41. doi: 10.1016/j.mri.2012.05.001. Epub 2012 Jul 6. PMID: 22770690; PMCID: PMC3466397.
Figures