4906
Sampling Time Considerations for T1 map acquisition on the 64mT Hyperfine Swoop system: A Phantom Evaluation Study1Biomedical Engineering, Illinois Institute of Technology, Chicago, IL, United States, 2Medicine - Cardiology, University of Chicago Medical Center, Chicago, IL, United States, 3Hyperfine Inc., Guilford, CT, United States, 4Radiology, University of Chicago Medical Center, Chicago, IL, United States, 5Neurology, University of Chicago Medical Center, Chicago, IL, United States
Synopsis
Keywords: Relaxometry, Low-Field MRI
T1 maps provide quantitative relaxometric measures of tissue responses that may carry correlative indices of specific disease indications. On the recently commercialized 64mT system (Hyperfine Inc.), little has been reported regarding both clinical T1 relaxometric normal values in presence of Gadolinium-based contrast and relevant acquisition schemes with Gd contrast enhancement. In this study, we examine an array of Gadolinium-doped vials that represent 10-5000 fold dilution in the vasculature using an Inversion-Recovery FSE acquisition to gain key insights on: a) anticipated normal values in presence of Gd, b) conventional fitting algorithm performance, and c) potential inferences on inversion timing selection.Introduction
T1 mapping at 64mT field strength has considerable potential to bring forth tissue characterization methods that are already established on the higher field clinical MRI systems. Such gained knowledge may provide important knowledge pertaining to optimal pulse sequence parameters, T1-based contrast dosage, and protocol timing as new techniques emerge specifically on this low-field system. Of note, voxel-wise parametric fitting according to the relaxometric signal evolution as described by the Bloch equation provides a choice post-processing – and allow for robust measurement yields of tissue T1 with the inversion times and matched signal intensity values. Despite this, relatively little is delineated about key acquisition timing considerations (i.e. normal values for inversion times and number of samples) best suited for this low-field system. In this study, we provide an initial combinatorial approach based on an exhaustive acquisition of a Gadolinium-doped vial array phantom.Materials and Methods
Phantom Preparation: Figure 1a shows the prepared Gd-based phantom using Gadodiamide (Omniscan) (GE Healthcare, Waukesha WI). [Gd] was diluted from a 485mM stock solution at varied concentrations with range [0.1mM, 1.0mM] at 0.1mM increments, [1.1mM, 1.9 mM] at 0.2mM increments, and additionally at 2, 5, 10, 15, 20, and 40mM respectively, representing dilution factors between ~10 and 5000 that would be seen during both conventional bolus chase and delayed accumulation in vasculature. A Distilled H2O reference vial, and a duplicate 0.7mM vial were also included into the array for both quality control and measurement reproducibility purposes. Figure 1b shows the typical signal intensity plot measurements depicted by the default product brain T1w parameters at 64mT (parameters not shown), along with relative SI measurements obtained on a higher field clinical system at 3.0T using product brain T1w sequence.Data Acquisition: Data for T1 estimation were obtained using Inversion-Recovery Fast Spin Echo (IR-FSE) with inversion times (TI) ranging from 85 – 966 ms on a 64mT Hyperfine Swoop (Guilford CT) scanner with an 8-channel head coil array. Nineteen TIs examined in this study were as follows: TIN=19 = [85, 132, 152, 248, 287, 309, 392, 416, 454, 534, 576, 617, 698, 732, 787, 831, 876, 941, 966] ms.
T1 map generation and processing: A reference T1 map was generated using a standard 3-parameter fit using all available inversion timepoint 3D volumes (n=19). Another 13 were implemented modeling other schemes1. A combinatorial subset commencing from applying the 3-point T1 fits on up to half of these volumes to three volumes were examined. The first 40 were generated using pseudo linear distribution across the full TI range of ~800ms, and smaller 400-500ms TI ranges in the full acquisition interval. A difference map of yielded T1 measures against the full map was derived and assessed using a Region-of-Interest analysis. Derived T1map variations against the full 19-TI fitted T1 map were analyzed using region-of-interest analysis. Our observed findings are provided below.
Results
The SI profile plot concurs with both literature2 the normal range of [Gd] assessed on our higher field system, yielding peak signals at [Gd]=1.5~1.7mM vials and a similar noticeable drop above [Gd]=2mM at both examined field strengths using T1w sequence tuned to the brain. Both high and low-field T1w measures concurred, with visually noticeable differences in terms of linearity over smaller [Gd] range subsets (e.g. in upward signal increase between [1.5, 1.7] mM). Pearson’s correlation yielded R2 = 0.83 for this comparison.Figure 2 shows the 19-TI-driven T1 map. Vials with [Gd] above 1.5mM yielded greater residual error during 3-parameter fitting. Figure 3 shows the relative comparisons of 53 examined combinatorial subsets pseudo-linear inversion timepoints, where we highlight the best 5-parameter fit (every 100ms), a robust 3-parameter fit (every 150 ms), and a third custom fit (i.e. 2-3x short TIs, one long TI). The depicted examples were determined by overall measurement differences between voxelwise T1s against the reference comparison. We observed notable discrepancies in fitted T1 measures despite the post-processing was performed on matched number of inversion times but with 50ms offsets; likewise similar trends can be found when select inversion time volumes are permuted at the front or back of the TI window (Figure 3b vs 3d; 3c vs 3e).
Discussion/Conclusion
We report the findings of over 50 combinations of T1 fitting across a range of n=21 Gd-doped vials with concentration varying between [Gd] = [0.1, 40]mM. Of note, we caution that 3-parameter fitting yielded non-converging, residual errors at [Gd] above 1.5mM. Our findings may offer insights towards an initial set of candidate acquisition parameters that would be best suited for 3-point fitted IR-FSE T1 relaxometry mapping consistent with exhaustive sampling.Acknowledgements
This project was supported by NIH K25 HL141634 and the R.A. Pritzker Chair.References
1. Piechnik SK, Ferreira VM, Dall'Armellina E, Cochlin LE, Greiser A, Neubauer S, Robson MD. Shortened Modified Look-Locker Inversion recovery (ShMOLLI) for clinical myocardial T1-mapping at 1.5 and 3 T within a 9 heartbeat breathhold. J Cardiovasc Magn Reson. 2010 Nov 19;12(1):69. doi: 10.1186/1532-429X-12-69. PMID: 21092095; PMCID: PMC3001433.
2. Bleicher AG, Kanal E. A serial dilution study of gadolinium-based MR imaging contrast agents. AJNR Am J Neuroradiol. 2008 Apr;29(4):668-73. doi: 10.3174/ajnr.A0905. Epub 2008 Jan 9. PMID: 18184840; PMCID: PMC7978187.
Figures
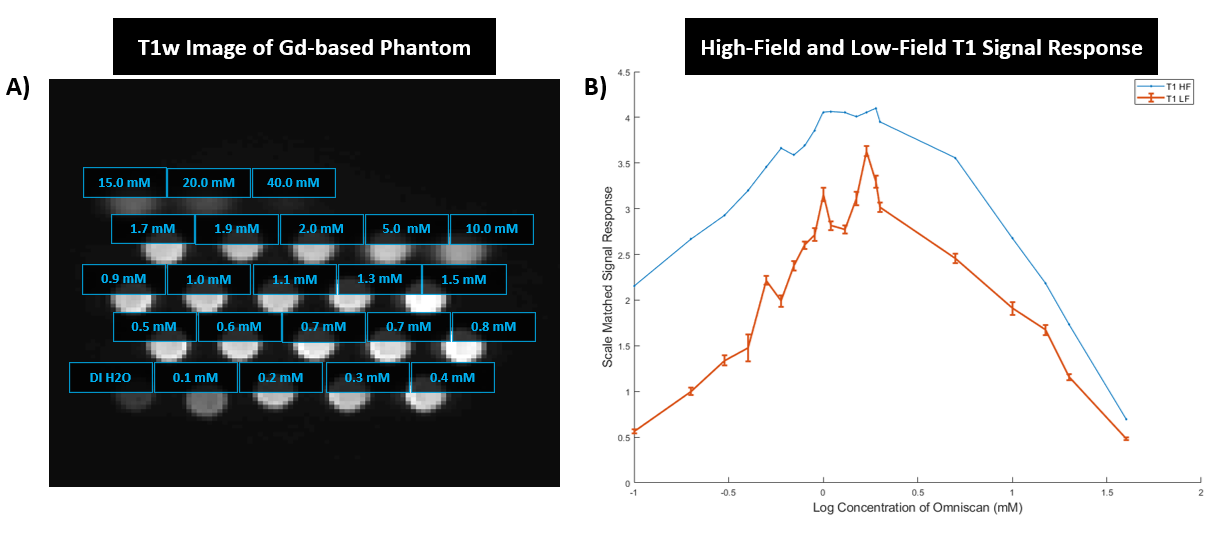
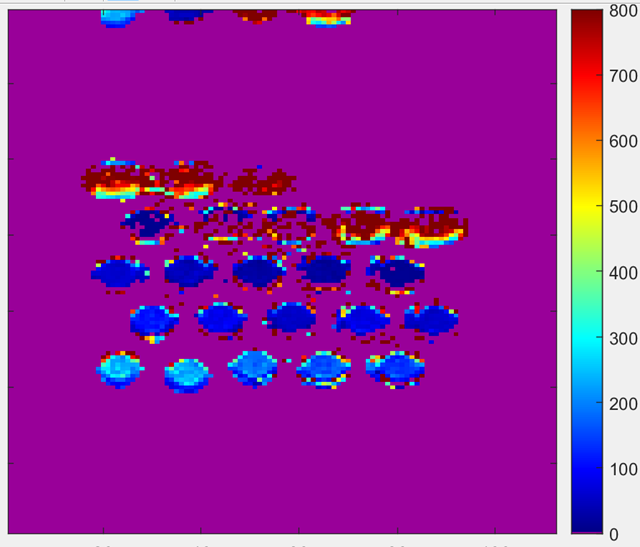
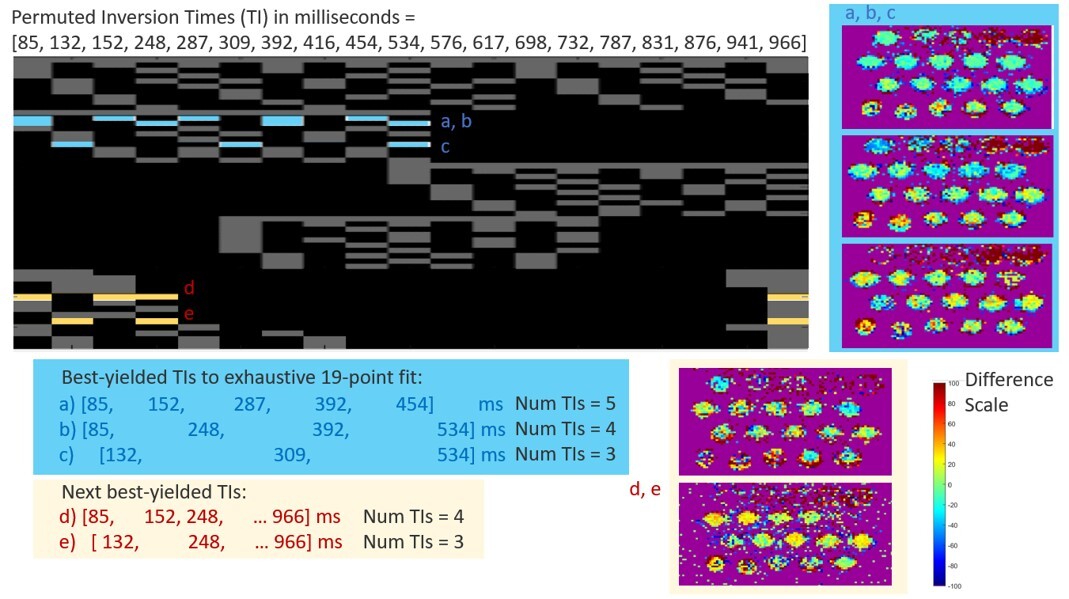
Figure 3: Top–examined pseudo linear inversion times are shown in each row. Derived T1maps that adequately deviated from the reference n=19-point T1 fit or with greater than 5 TI volumes are grayed out. Candidate inversion times across the examined vials up to 1.5 mM. Middle–three best T1 maps derived using 5, 4, and 3 TI volumes respectively. A JET colormap scheme is used (voxelwise difference 0-) shows robust trends in middle column. Each 4- and 3-volume TIs exhibit linear trends of over/underestimate for the log-varying Gd concentration profile. Bottom – next best yielded TI-volumes.