4903
Whole Brain R2 Maps at 7T Highlight Iron-Rich Cortical Gray and Sub-cortical White Matter1AMRI, LFMI, NINDS, NIH, Bethesda, MD, United States
Synopsis
Keywords: Relaxometry, Relaxometry, T2 mapping; Iron
Gradient Echo Sampling of Spin Echo signal was used to obtain whole-brain R2 maps from 8 young and 1 senior healthy volunteers at 7T. Cortical surface reconstruction showed increased R2 in areas of high iron content as known from histology. Furthermore, high R2 in sensory-motor and visual cortices was accompanied by low R2 in underlying white matter. Highest R2 in subcortical white matter was found in frontal and temporal lobes. The low sensitivity of R2 to fiber orientation and venous vasculature may render it more suitable than R2* and $$$\chi$$$ for iron quantification, especially near the brain surface.Introduction
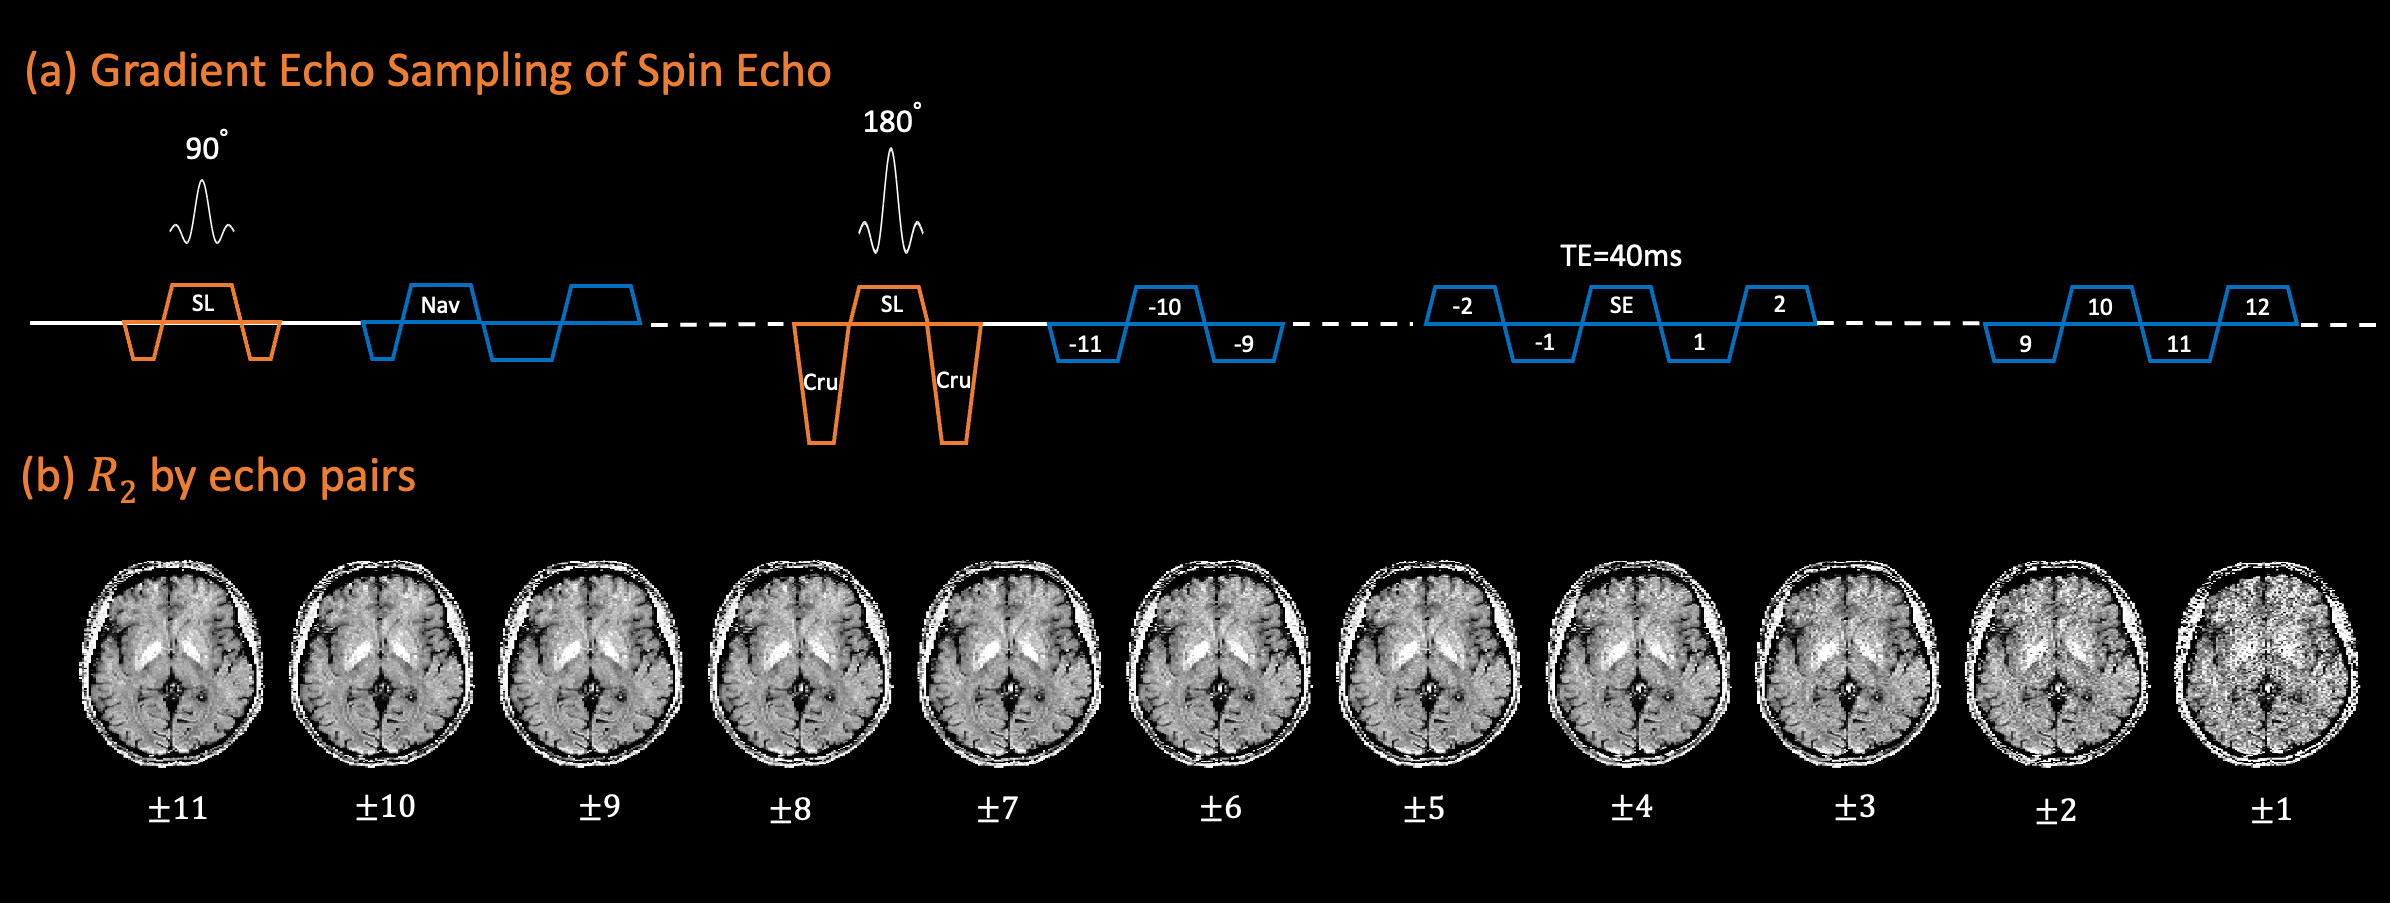
Neurodegenerative diseases such as Multiple Sclerosis and Alzheimer’s disease are closely associated with iron deposition and/or myelin loss in the brain1,2. Separate quantification of myelin and iron using MRI is intricate, as they both accelerate T1, T2, T2* relaxation and increase tissue susceptibility contrast $$$\mid\chi\mid$$$. One potential approach is to combine multiple quantitative parameters leveraging their differential sensitivity to myelin and iron. This method is especially promising at ultra-high-field, where T1 is highly sensitive to myelin macromolecular proton fraction3,4, while T2\T2*\ $$$\chi$$$ are generally more sensitive to iron5. A complicating factor however, is that T2* and $$$\chi$$$ are also sensitive to myelinated fiber orientation and venous vasculature6, which manifest as major confounds. T2 is theoretically less sensitive to these confounding effects, yet literature on T2 quantification at 7T is scarce. This knowledge gap is primarily due to technological challenges to robustly obtain accurate T2 at 7T owing to strong B0 and B1 heterogeneity, and the SAR-demanding nature of refocusing RF pulses.In this study, we employed gradient echo sampling of spin echo (GESSE, Figure 1a) to minimize effects of B0 and B1 imperfection on T2 quantification7,8, with prolonged RF pulse durations and TR to operate within SAR limits while achieving whole brain coverage. This enabled R2(1/T2) surface analysis of the cortex and associated white matter across the entire brain. The aim of the study was to demonstrate the close correlation between R2 and iron-rich structures at 7T, with the long-term goal to establish R2 in multi-contrast-based quantification of iron and myelin at ultra-high-field.
Methods
Data acquisition. 8 healthy young (5 female, 23-31 years) and 1 healthy senior (male, 62 years) volunteers were scanned at 7T Terra (Siemens Healthineers) using a 1-Tx 32-Rx array (Nova). GESSE images were acquired on transverse slices parallel to the AC-PC line, with FOV 240x180 mm2, resolution 1.0x1.0 mm2, slice thickness 2mm, slice gap 1mm, 36-38 slices covering the entire brain, TE 40 ms, echo spacing ($$$\Delta TE$$$) 1.13 ms, 11 echoes leading the spin echo and 30 echoes trailing it (echo train TEs 27.56-73.90 ms), bandwidth 1042 Hz/voxel. TR was varied from 4.5-5.5 s to comply with the scanner prescribed normal SAR limit. A first-order navigator was acquired at 7 ms to correct for frequency shift of hardware and physiological sources. The scan time was approximately 15 min without parallel imaging nor partial Fourier acceleration. 3D T1-MP2RAGE was acquired as anatomical reference.Data analysis. Gradient echo pairs symmetric about the spin echo were used to calculate R2 maps as follows7: $$R_2(n\Delta TE)=\frac{ln[S(TE-n\Delta TE)/S(TE+n\Delta TE)]}{2n\Delta TE}$$ Empirically, R2 maps corresponding to n=6-11 had sufficiently high SNR and were averaged for further processing (Figure 1b). FreeSurfer was used to generate cortical surfaces using the recon-all command on the T1MP2RAGE. GESSE image at TE=30.7 ms was registered to the reference, yielding a registration matrix which was used to transfer from R2 image space to T1 space (to generate cortical surface R2) and vice versa (to obtain ROI labels in the R2 space). Individual R2 was averaged across 25-75% cortical depth to obtain a cortical surface map, and across -25--75% cortical depth to obtain a subcortical white matter map. The surface maps were normalized to the template “fsaverage” for group average. Statistics were taken in major cortical areas, white matter in four brain lobes, as well as major subcortical nuclei. The surface maps and ROI statistics did not include the senior subject.
Results
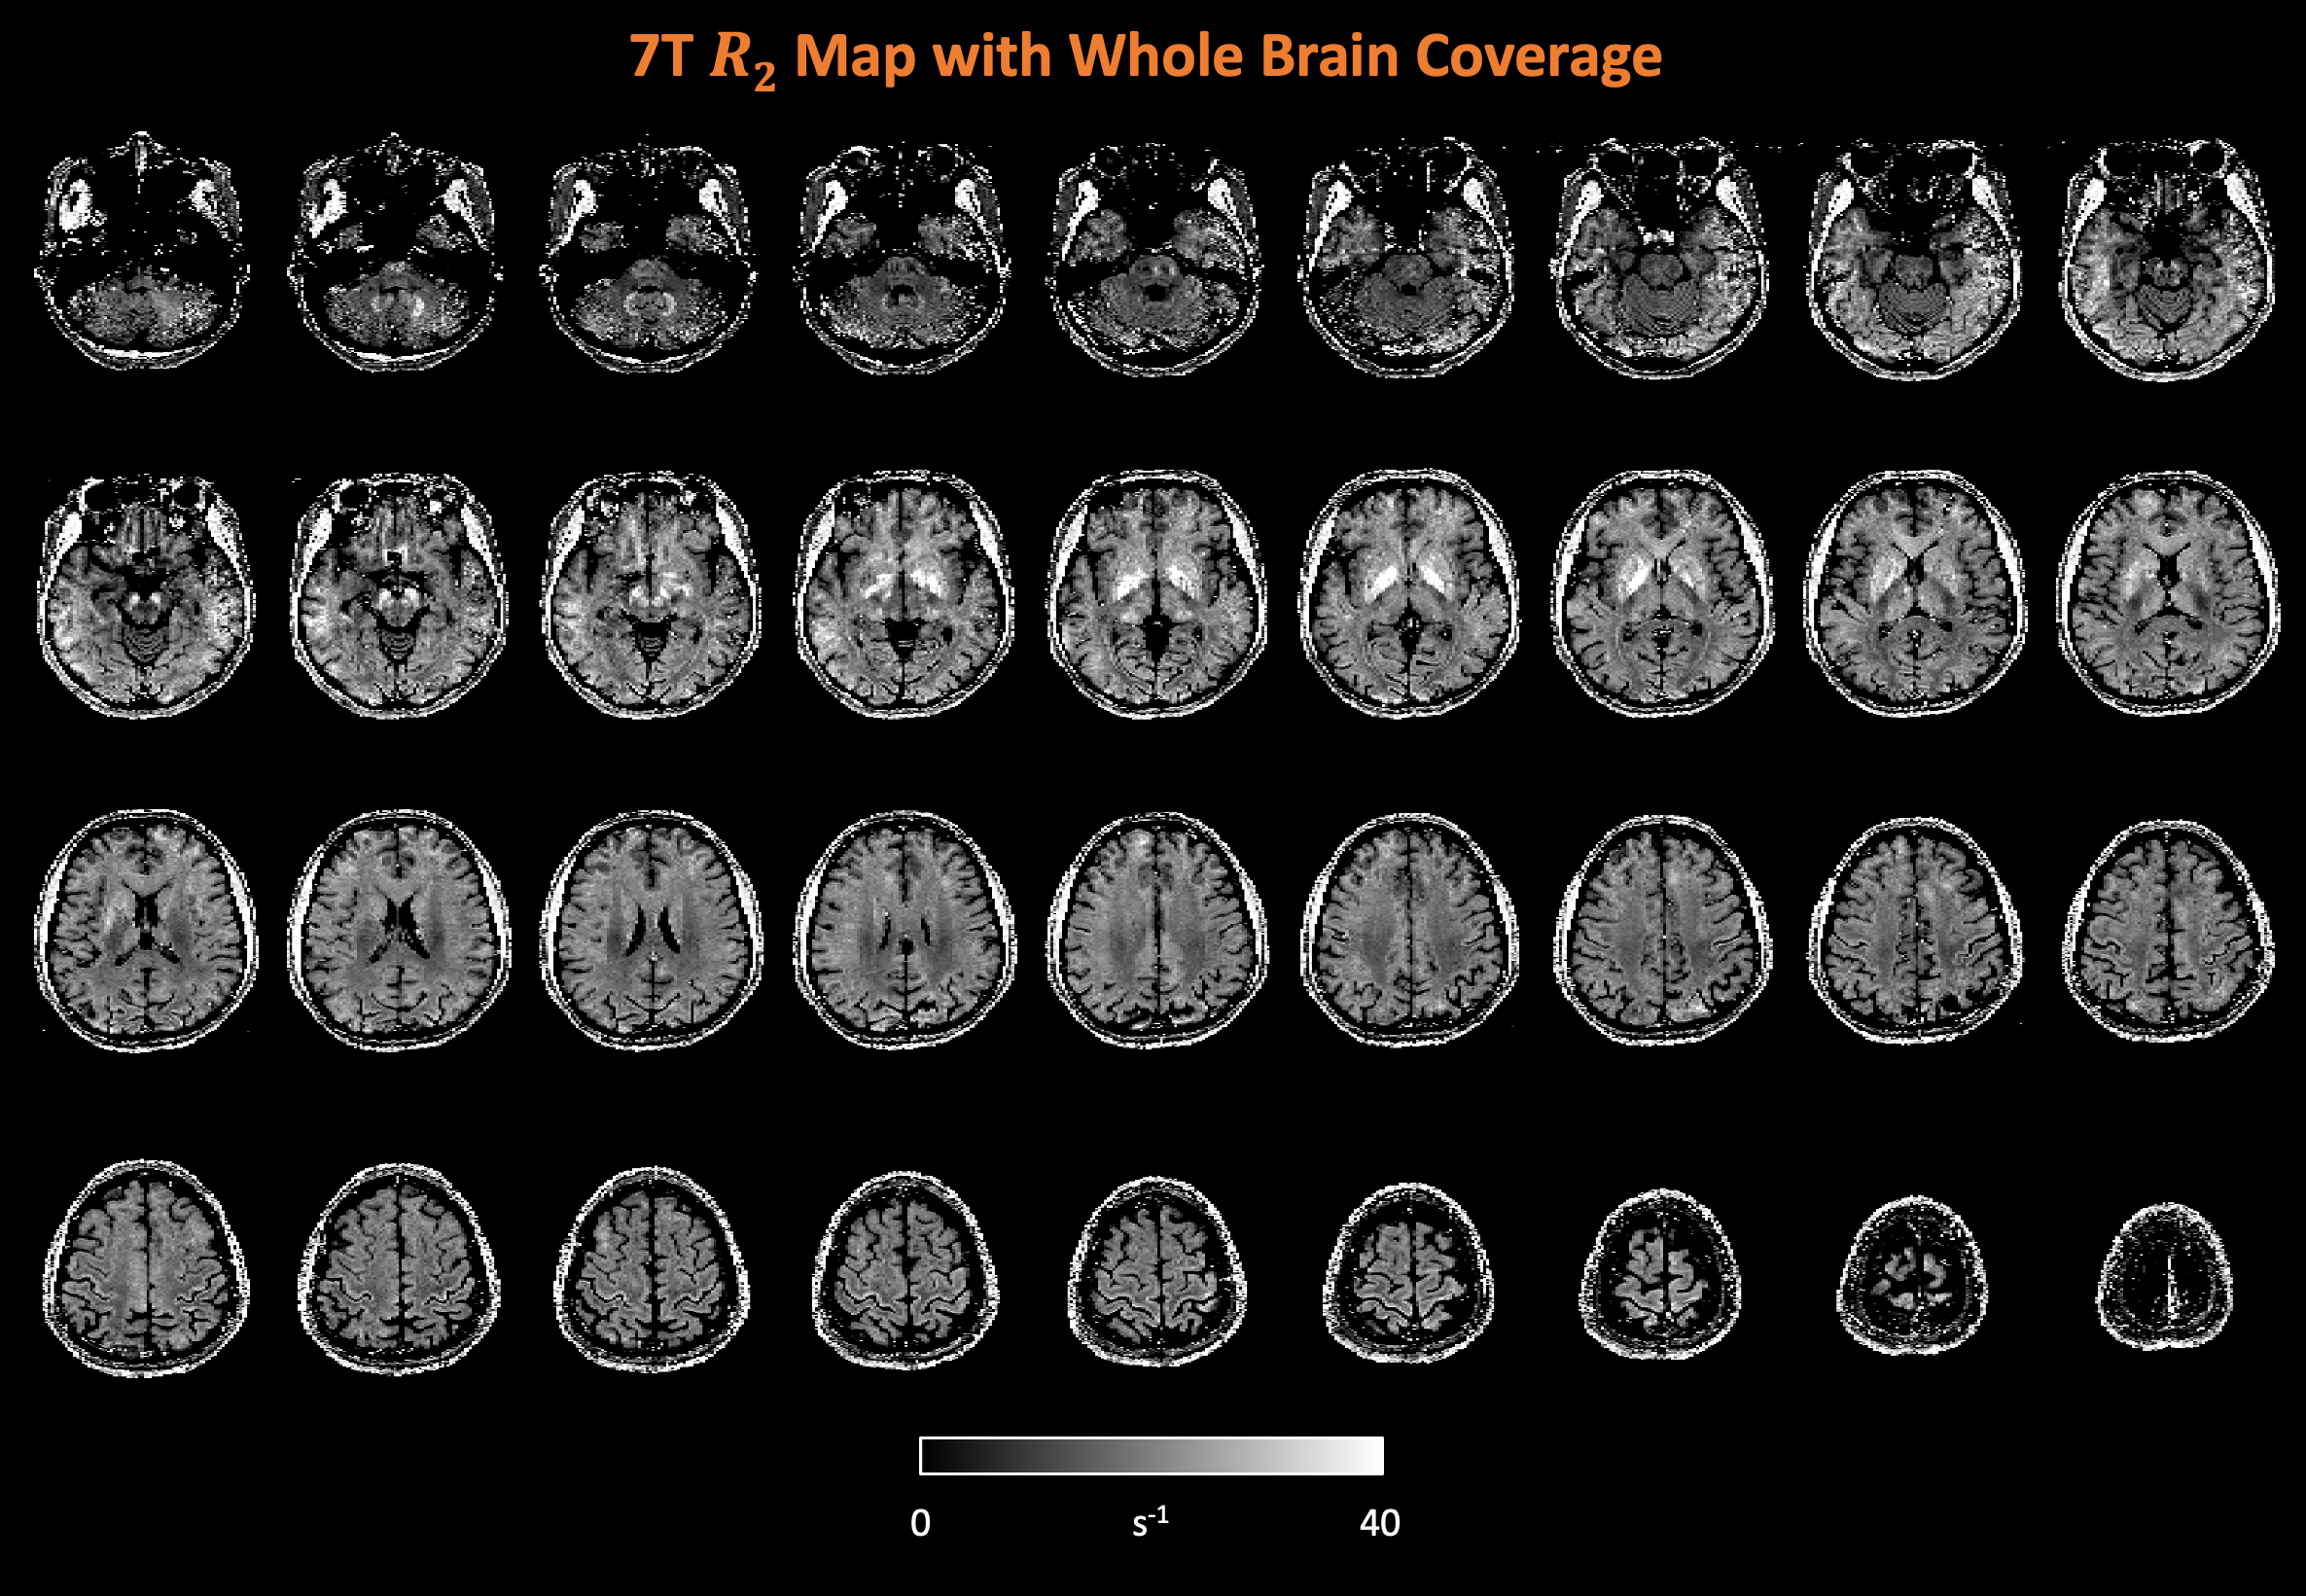
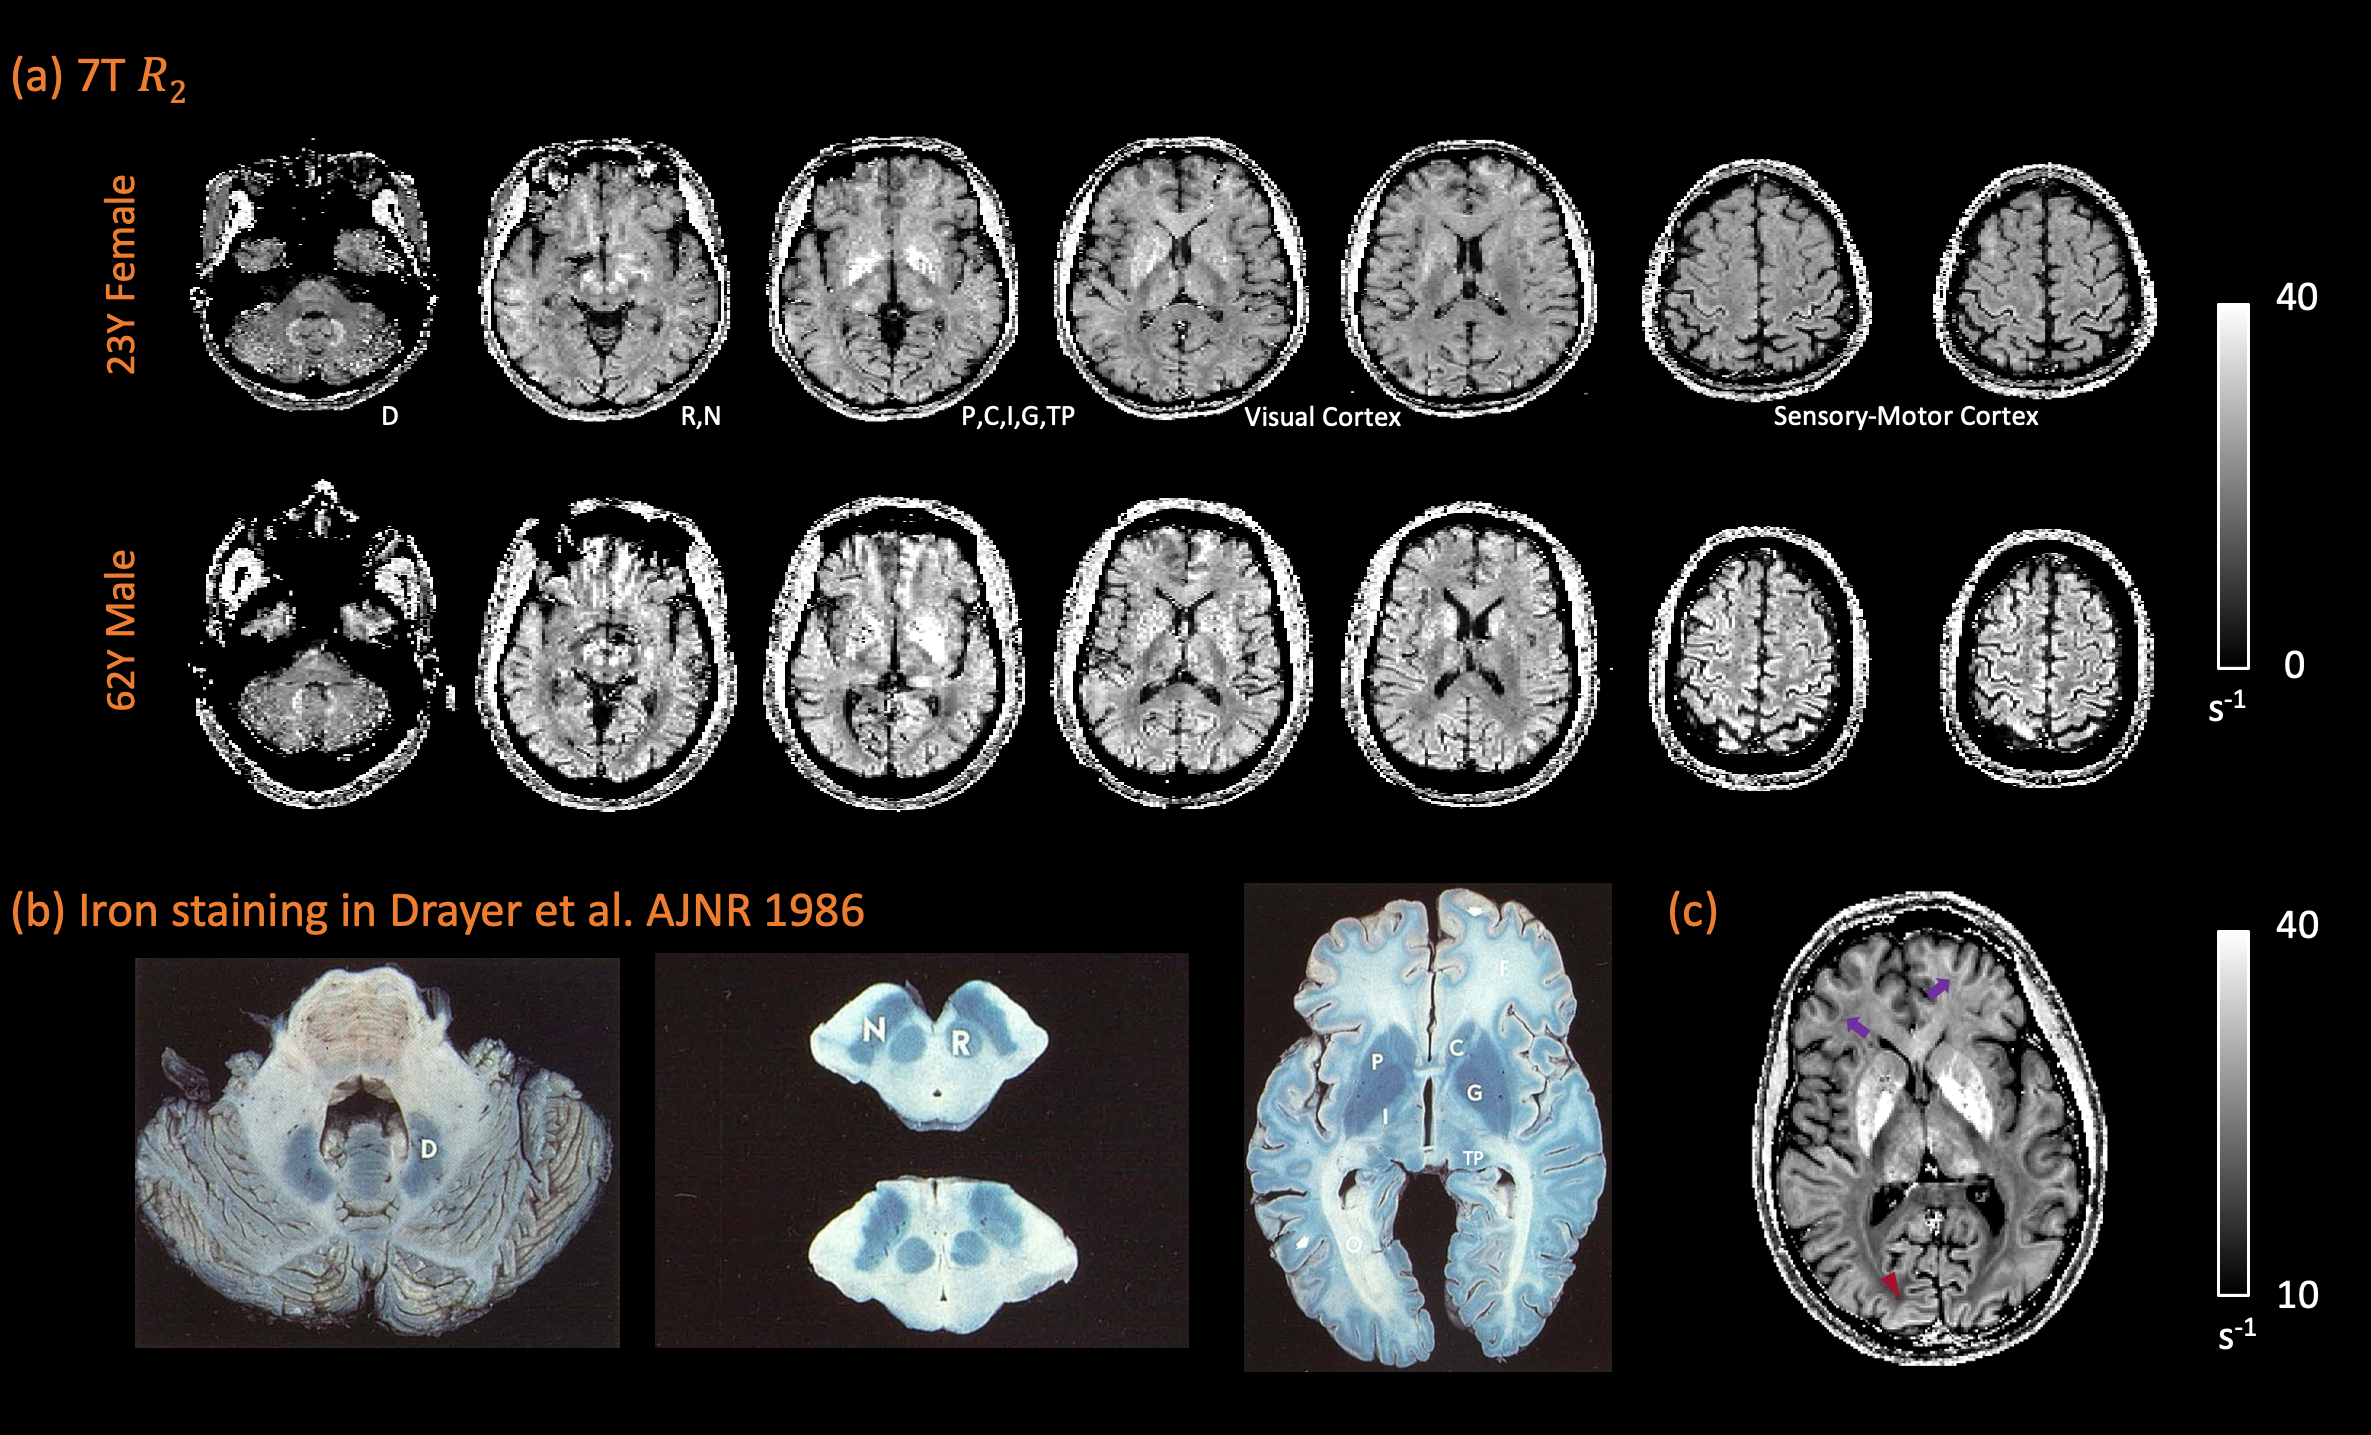
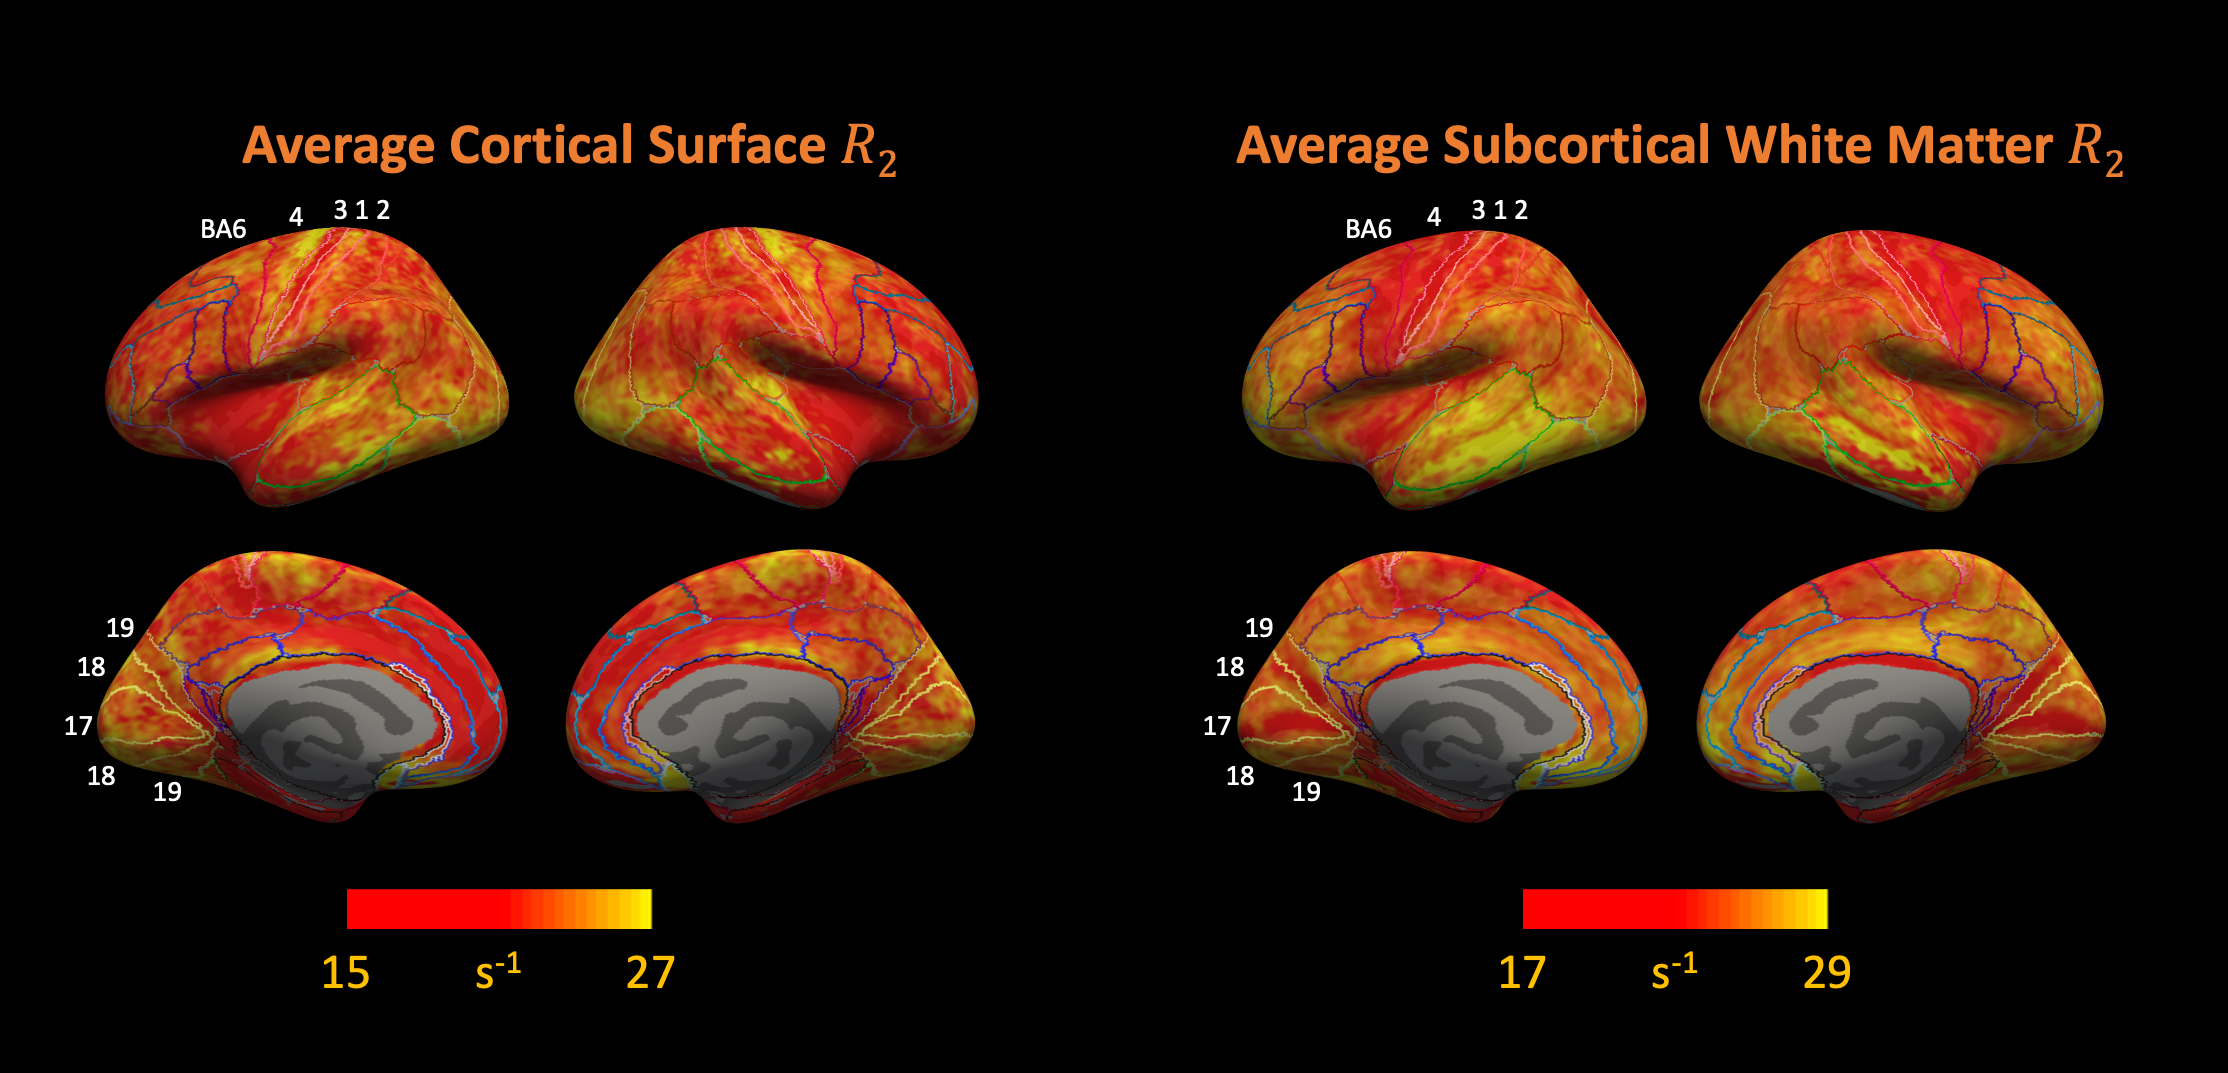
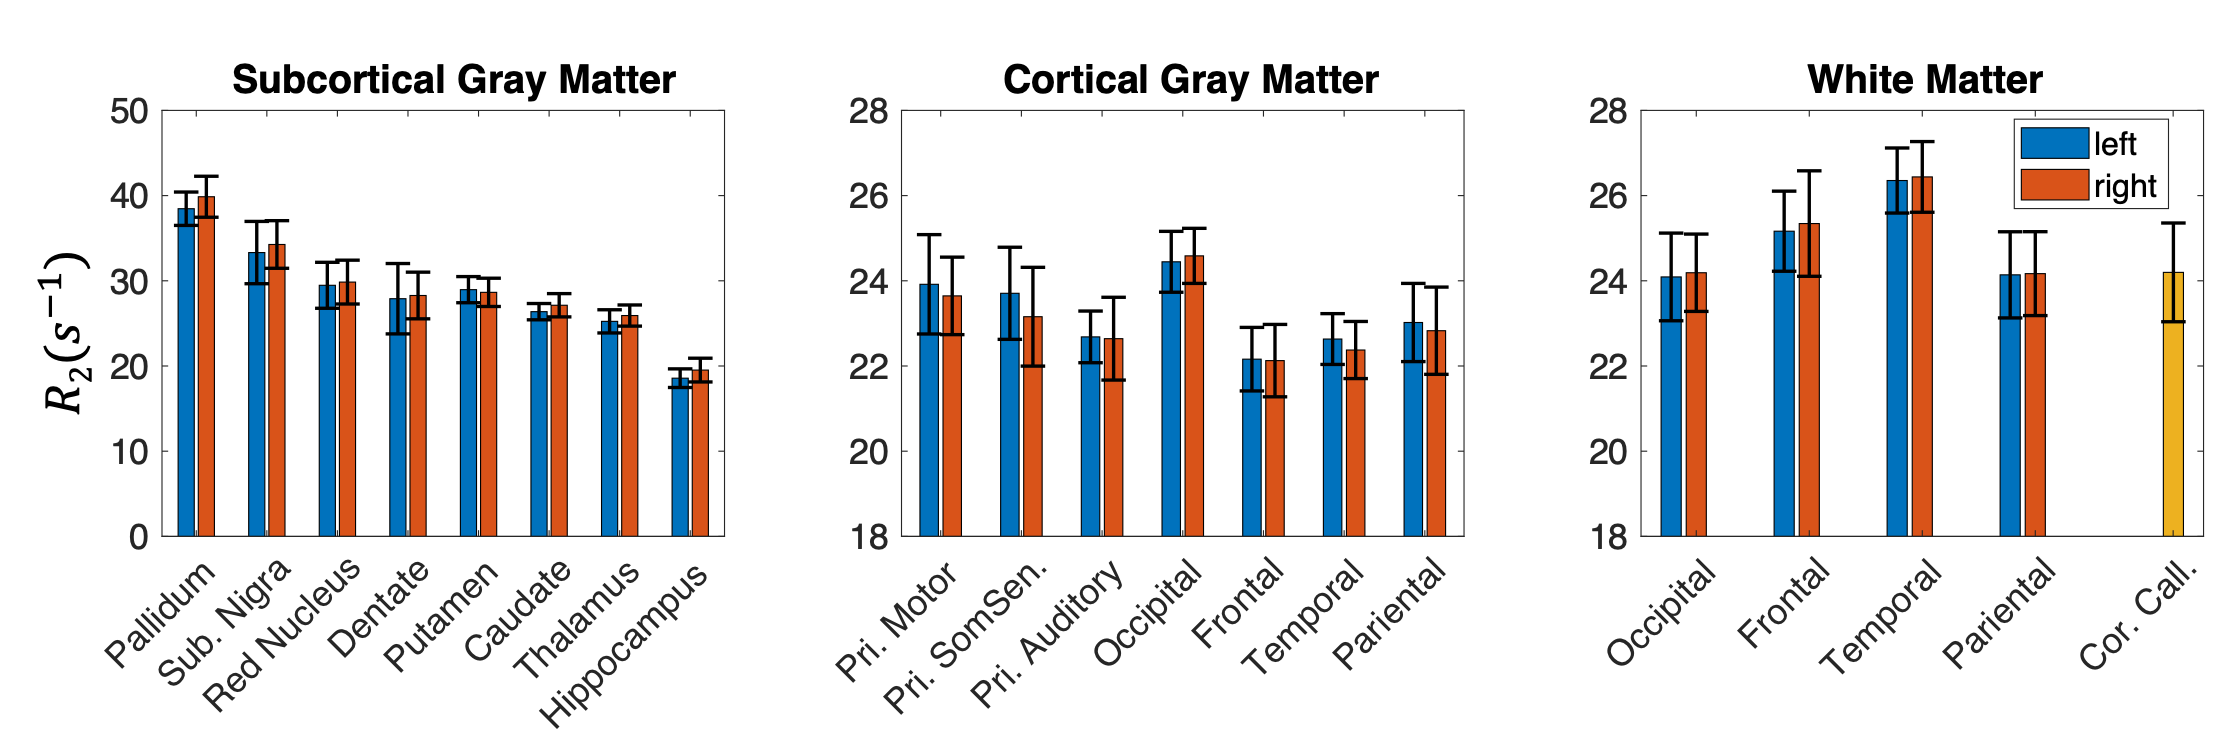
7T R2 maps with full brain coverage from a representative subject are shown in Figure 2. R2 maps highlight the subcortical structures known to have high iron concentration, closely following the postmortem iron stain maps reported in Drayer et al. (Figure 3). In addition, sensory-motor and visual cortices were found to have elevated R2 compared to other cortical areas. Intriguingly, higher R2 was observed within the occipital cortex compared to the adjacent white matter (Figure 3c maroon arrow head), while in the frontal lobe, the contrast reversed as U-fiber rich subcortical white matter has higher R2 than the cortex (Figure 3c purple arrows), consistent with histochemical findings of iron distribution in Figure 3b and others9,10. Lastly, the single healthy senior subject showed substantially higher R2 not only in the subcortical nuclei as reported previously11,12, but also extensively across the cortex.Surface maps (Figure 4) and ROI statistics (Figure 5) also show higher R2 in the primary sensory-motor cortices near the central sulcus, and occipital visual cortices, while white matter R2 in the frontal and temporal lobes was comparatively high. Both surface maps and ROI statistics demonstrated reasonable symmetry between the left and right hemispheres.
Conclusion
High-quality R2 mapping with full brain coverage is achievable at 7T. R2 values were found to follow the known iron concentration especially in iron-rich brain structures, and not only in the subcortical nuclei but also in the cortices and white matter areas. The results strongly support potential use of R2 at 7T as a sensitive indicator for iron. Nevertheless, myelination associated diffusion and magnetization transfer effects also contribute to R2 relaxation, which warrants future work to alleviate these effects by optimization of imaging parameters, and/or fusion of R1\R2\ $$$\chi$$$ to disentangle iron and myelin.Acknowledgements
No acknowledgement found.References
1. Singh, A. V. & Zamboni, P. Anomalous Venous Blood Flow and Iron Deposition in Multiple Sclerosis. J. Cereb. Blood Flow Metab. 29, 1867–1878 (2009).
2. Bartzokis, G. Alzheimer’s disease as homeostatic responses to age-related myelin breakdown. Neurobiol. Aging 32, 1341–1371 (2011).
3. Rooney, W. D. et al. Magnetic field and tissue dependencies of human brain longitudinal 1H2O relaxation in vivo. Magn. Reson. Med. 57, 308–318 (2007).
4. Wang, Y., van Gelderen, P., de Zwart, J. A. & Duyn, J. H. B0-field dependence of MRI T1 relaxation in human brain. NeuroImage 213, 116700 (2020).
5. Haacke, E. M. et al. Imaging iron stores in the brain using magnetic resonance imaging. Magn. Reson. Imaging 23, 1–25 (2005).
6. Duyn, J. & John, S. Contributions to magnetic susceptibility of brain tissue. NMR Biomed. 30, e3546 (2016).
7. Yablonskiy, D. A. & Haacke, E. M. An MRI method for measuring T2 in the presence of static and RF magnetic field Inhomogeneities. Magn. Reson. Med. 37, 872–876 (1997).
8. Cox, E. F. & Gowland, P. A. Simultaneous quantification of T2 and T′2 using a combined gradient echo-spin echo sequence at ultrahigh field. Magn. Reson. Med. 64, 1440–1445 (2010).
9. Fukunaga, M. et al. Layer-specific variation of iron content in cerebral cortex as a source of MRI contrast. Proc. Natl. Acad. Sci. 107, 3834–3839 (2010).
10. Kirilina, E. et al. Superficial white matter imaging: Contrast mechanisms and whole-brain in vivo mapping. Sci. Adv. 6, eaaz9281 (2020).
11. Schenker, C., Meier, D., Wichmann, W., Boesiger, P. & Valavanis, A. Age distribution and iron dependency of the T2 relaxation time in the globus pallidus and putamen. Neuroradiology 35, 119–124 (1993).
12. Bartzokis, G. et al. MR evaluation of age-related increase of brain iron in young adult and older normal males. Magn. Reson. Imaging 15, 29–35 (1997).
Figures