4902
Brain R2 dependence on field strength1AMRI, LFMI, NINDS, NIH, Bethesda, MD, United States
Synopsis
Keywords: Relaxometry, Brain
Gradient Echo Sampling of Spin Echo signal was used to obtain R2 maps in nine adults at 3 T and 7 T. These were analyzed using anatomically defined ROIs, across most of the brain. Comparison between the two field strengths shows in most brain regions the R2 increases by about a factor of 1.62, with the notable exception of regions high in iron. Linear fits of R2 versus estimated iron concentration yielded 50.6 and 132 1/s/(mg/g) for 3 T and 7 T respectively, in line with prior reports at lower fields for the field dependence of iron related relaxation.Introduction
Quantitative measures of relaxation in brain tissue have long been of interest as a potential surrogate of iron concentration, which is a major contributor to brain R2* relaxivity (1,2). Abnormal brain iron concentration is thought to be related to many neurodegenerative diseases, including MS, Parkinson’s, and Alzheimer’s disease (3-6). While R2 and R2* are both sensitive to the field inhomogeneities caused by iron, R2* is also sensitive to other sources of inhomogeneity, such as deoxyhemoglobin in the venous vasculature. Measurement of R2 therefore may be a more reproducible and sensitive marker of iron. The field dependence is of interest to understand the nature of the relaxation and to potentially separate iron from other sources of R2 relaxation, as their field dependent relaxivity maybe different (7-9).Here we used a Gradient Echo Sampled Spin Echo (GESSE(10,11)) approach to quantify the R2 relaxation, with minimal sensitivity to both B0 and B1 inhomogeneities. The same subjects were measured at 3 and 7 T with the same imaging method and parameters. The aim was to quantify the field dependence of R2 relaxation and its relation of iron concentration.
Methods
Nine subjects were measured on both a 3 T Prisma and a 7 T Magnetom scanner (both Siemens Healthineers), both with 32-channel receive coil. The average age was 25.3 (SD 3.3) years. GESSE images were acquired axial-oblique, approximately parallel to AC-PC, with a FOV of 240x180 mm2, 1.1x1.1 mm2 resolution, 2 mm nominal slice thickness, 2 mm gap. Twenty slices were scanned at 3 T, 16 at 7 T (due to SAR limitations). The TR was chosen at 2 s, the spin echo TE at 40 ms, the gradient echo spacing as 1.21 ms at 3 T, 1.06 ms at 7 T. A navigator was included in the acquisition prior to the refocusing pulse to reduce ghosting from respiratory (and other) field changes. The slice thickness of the refocusing pulse was set to 3 mm to reduce effects of slice profile imperfections. A 3D-MPRAGE was acquired as anatomical reference.The images were corrected for distortion/displacement in the acquisition direction to allow combination of positive and negative gradient images. The gradient echoes symmetric around the spin echo were used to fit the R2, using a linear fit to the logarithm of the (magnitude) data.
Freesurfer software was used to create ROIs in the 3 T MPRAGE space, and to calculate the alignment between the GESSE images from both field strengths and the 3 T MPRAGE. The inverse of this transform was then applied to the separate ROI maps, generating interpolated ROI masks in each subject’s R2 space. A threshold of 0.9 was applied to select voxels with minimum partial volume effects. The Freesurfer parcellations for white matter and cortex were combined into frontal, precentral, postcentral, parietal, occipital and temporal areas. In addition to the Freesurfer ROIs, the substantia nigra and red nucleus were defined manually on the GESSE images. The R2 values were averaged within ROIs and combined for left and right hemisphere measures.
Results
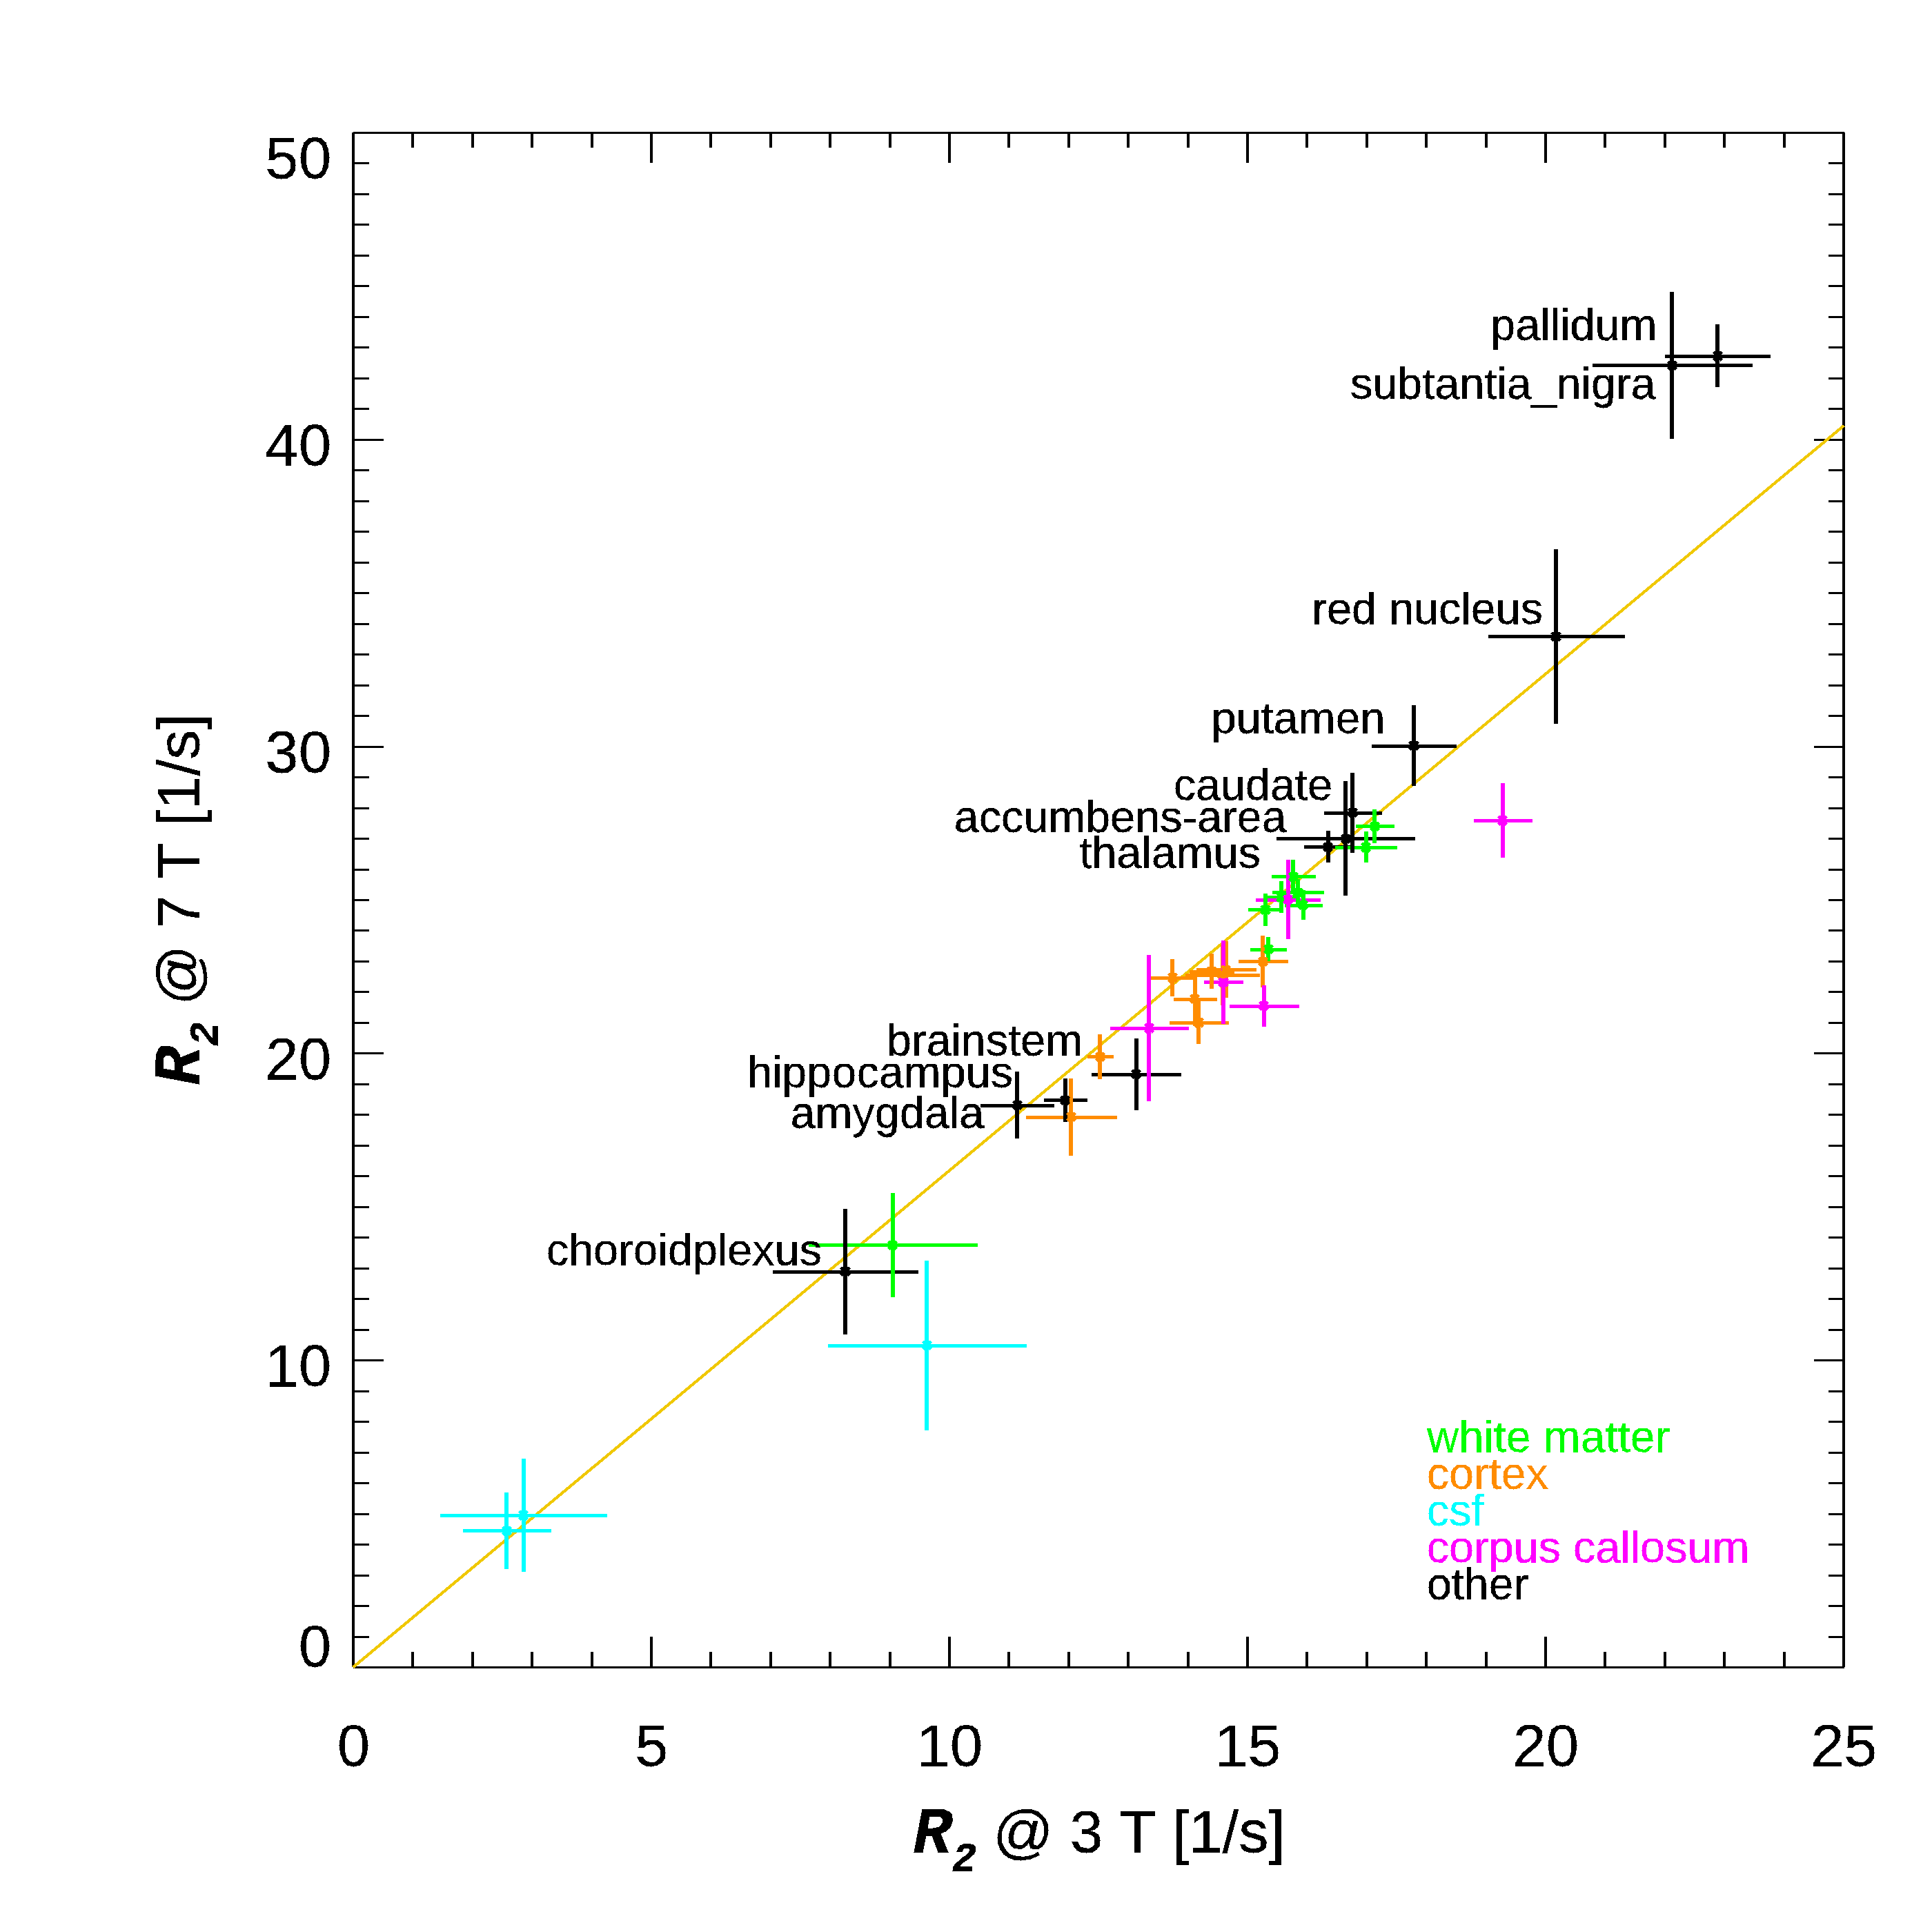
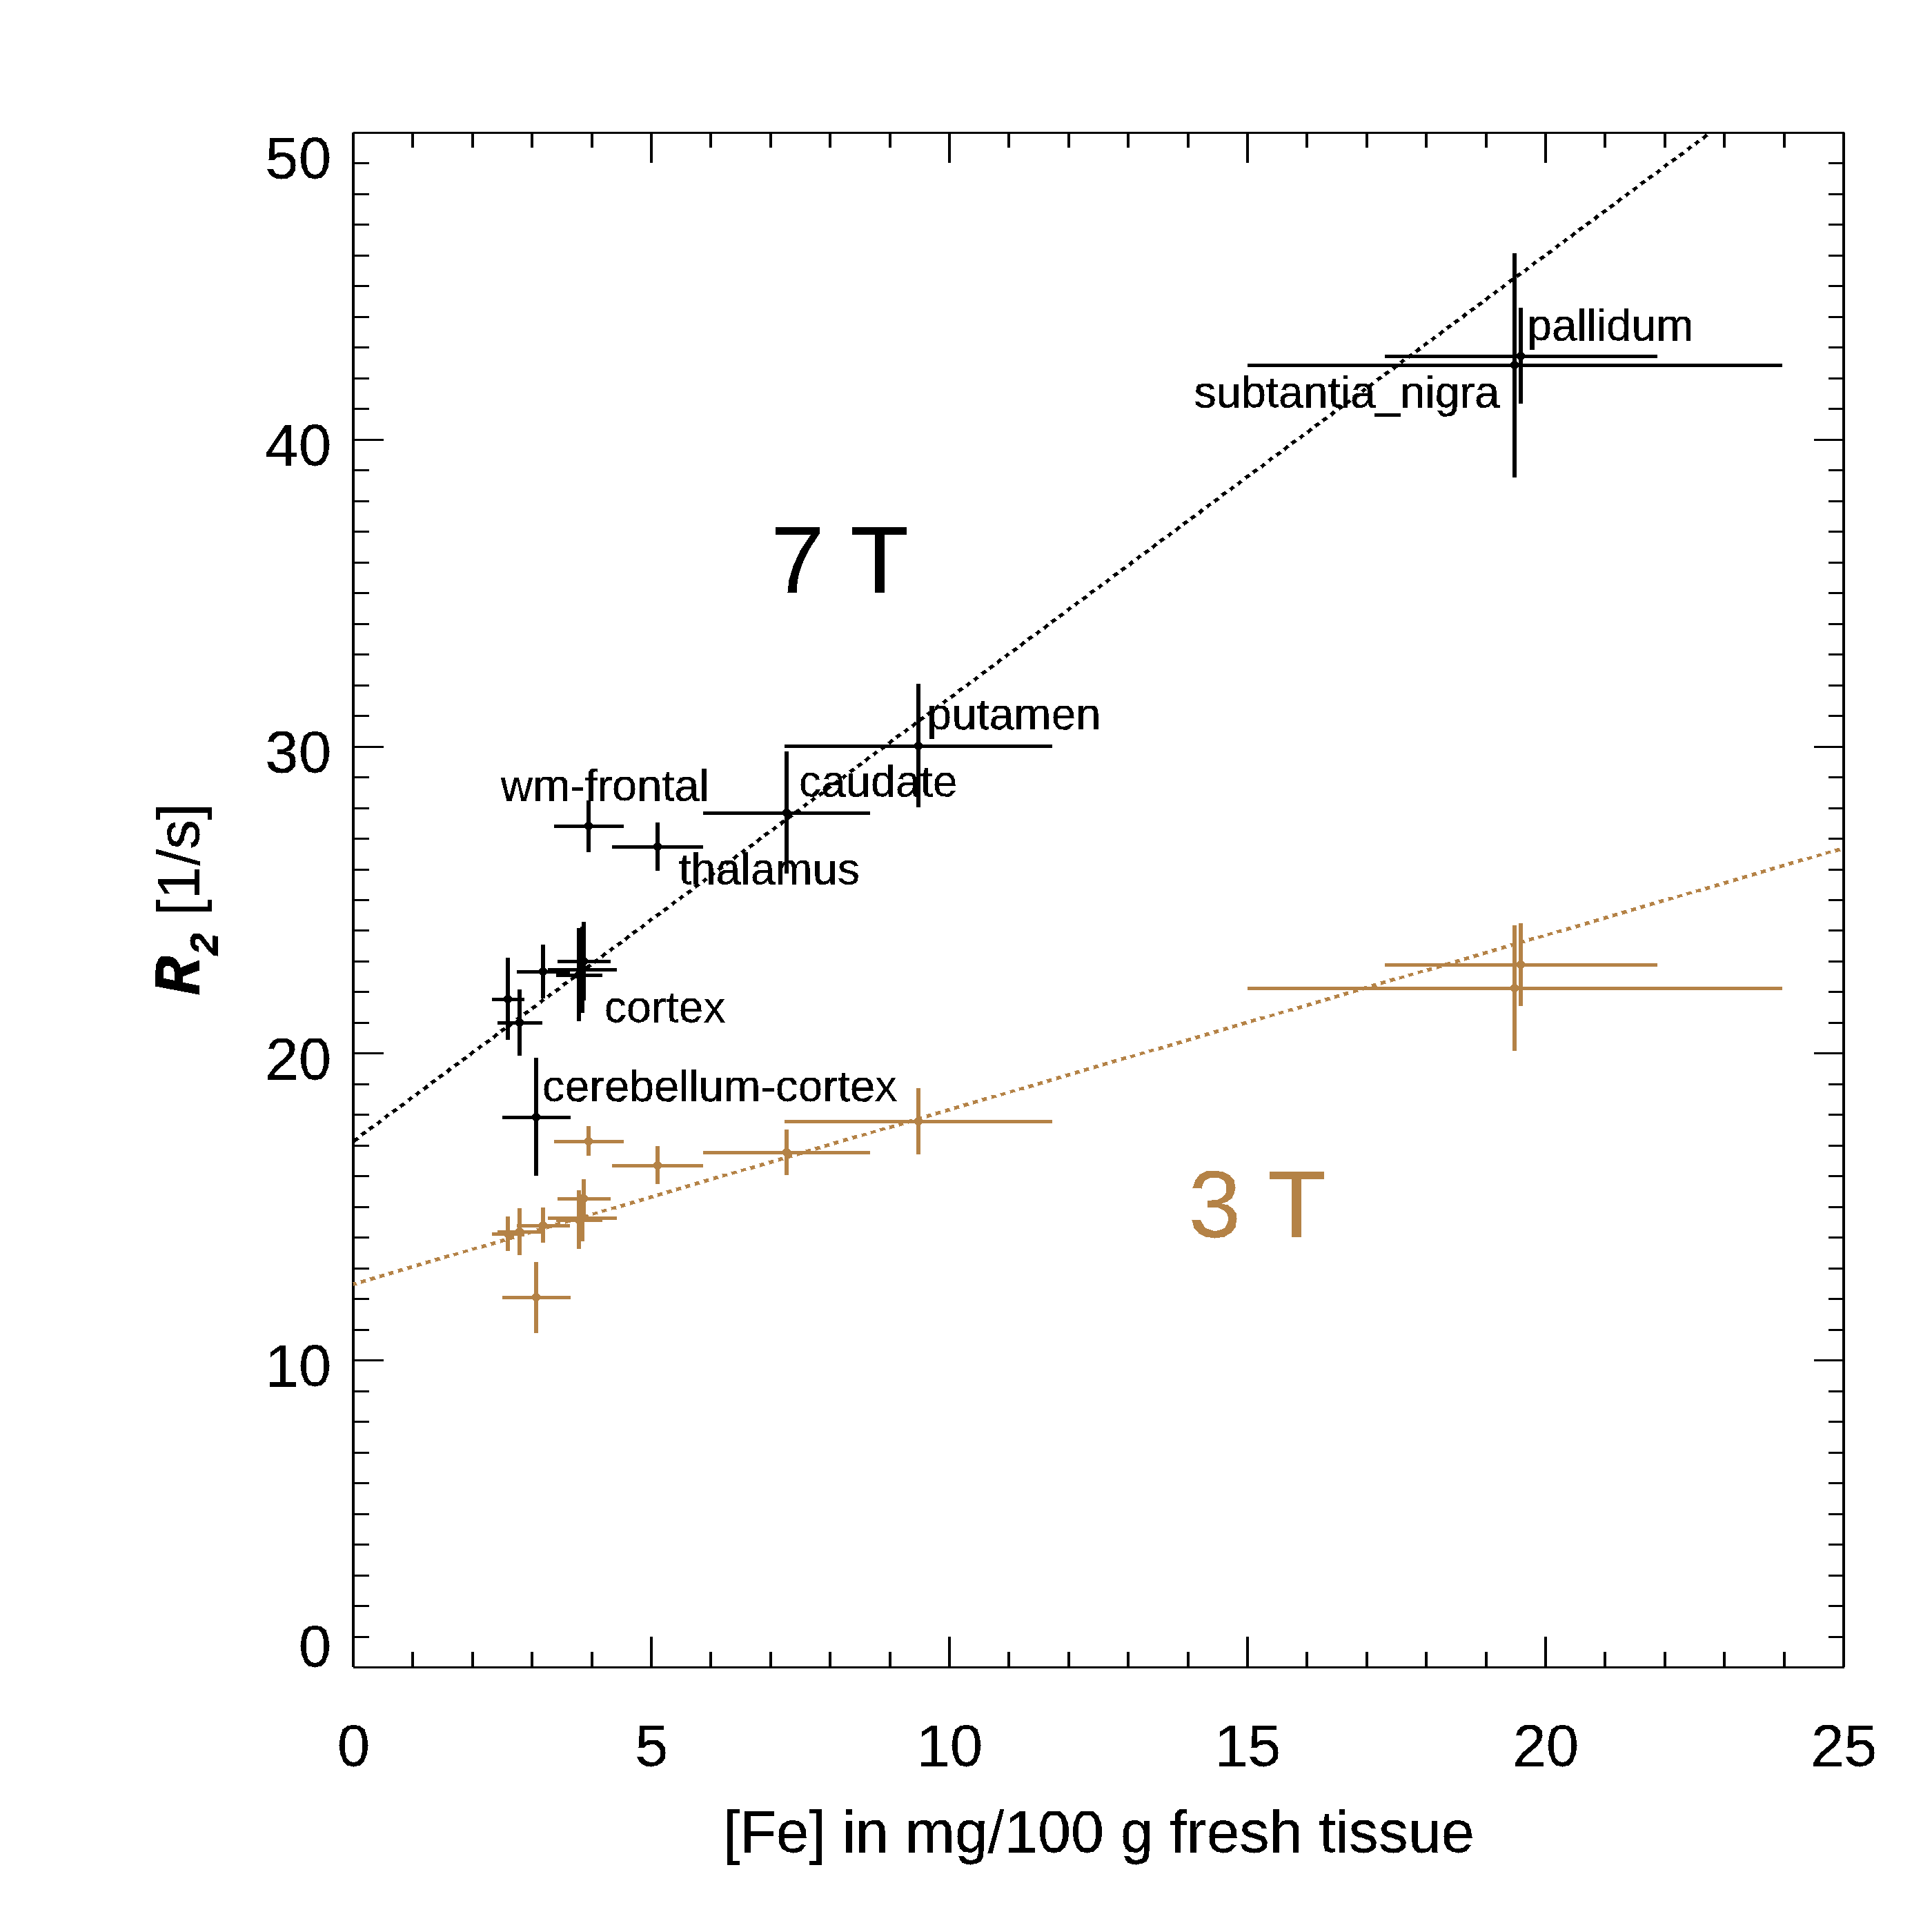
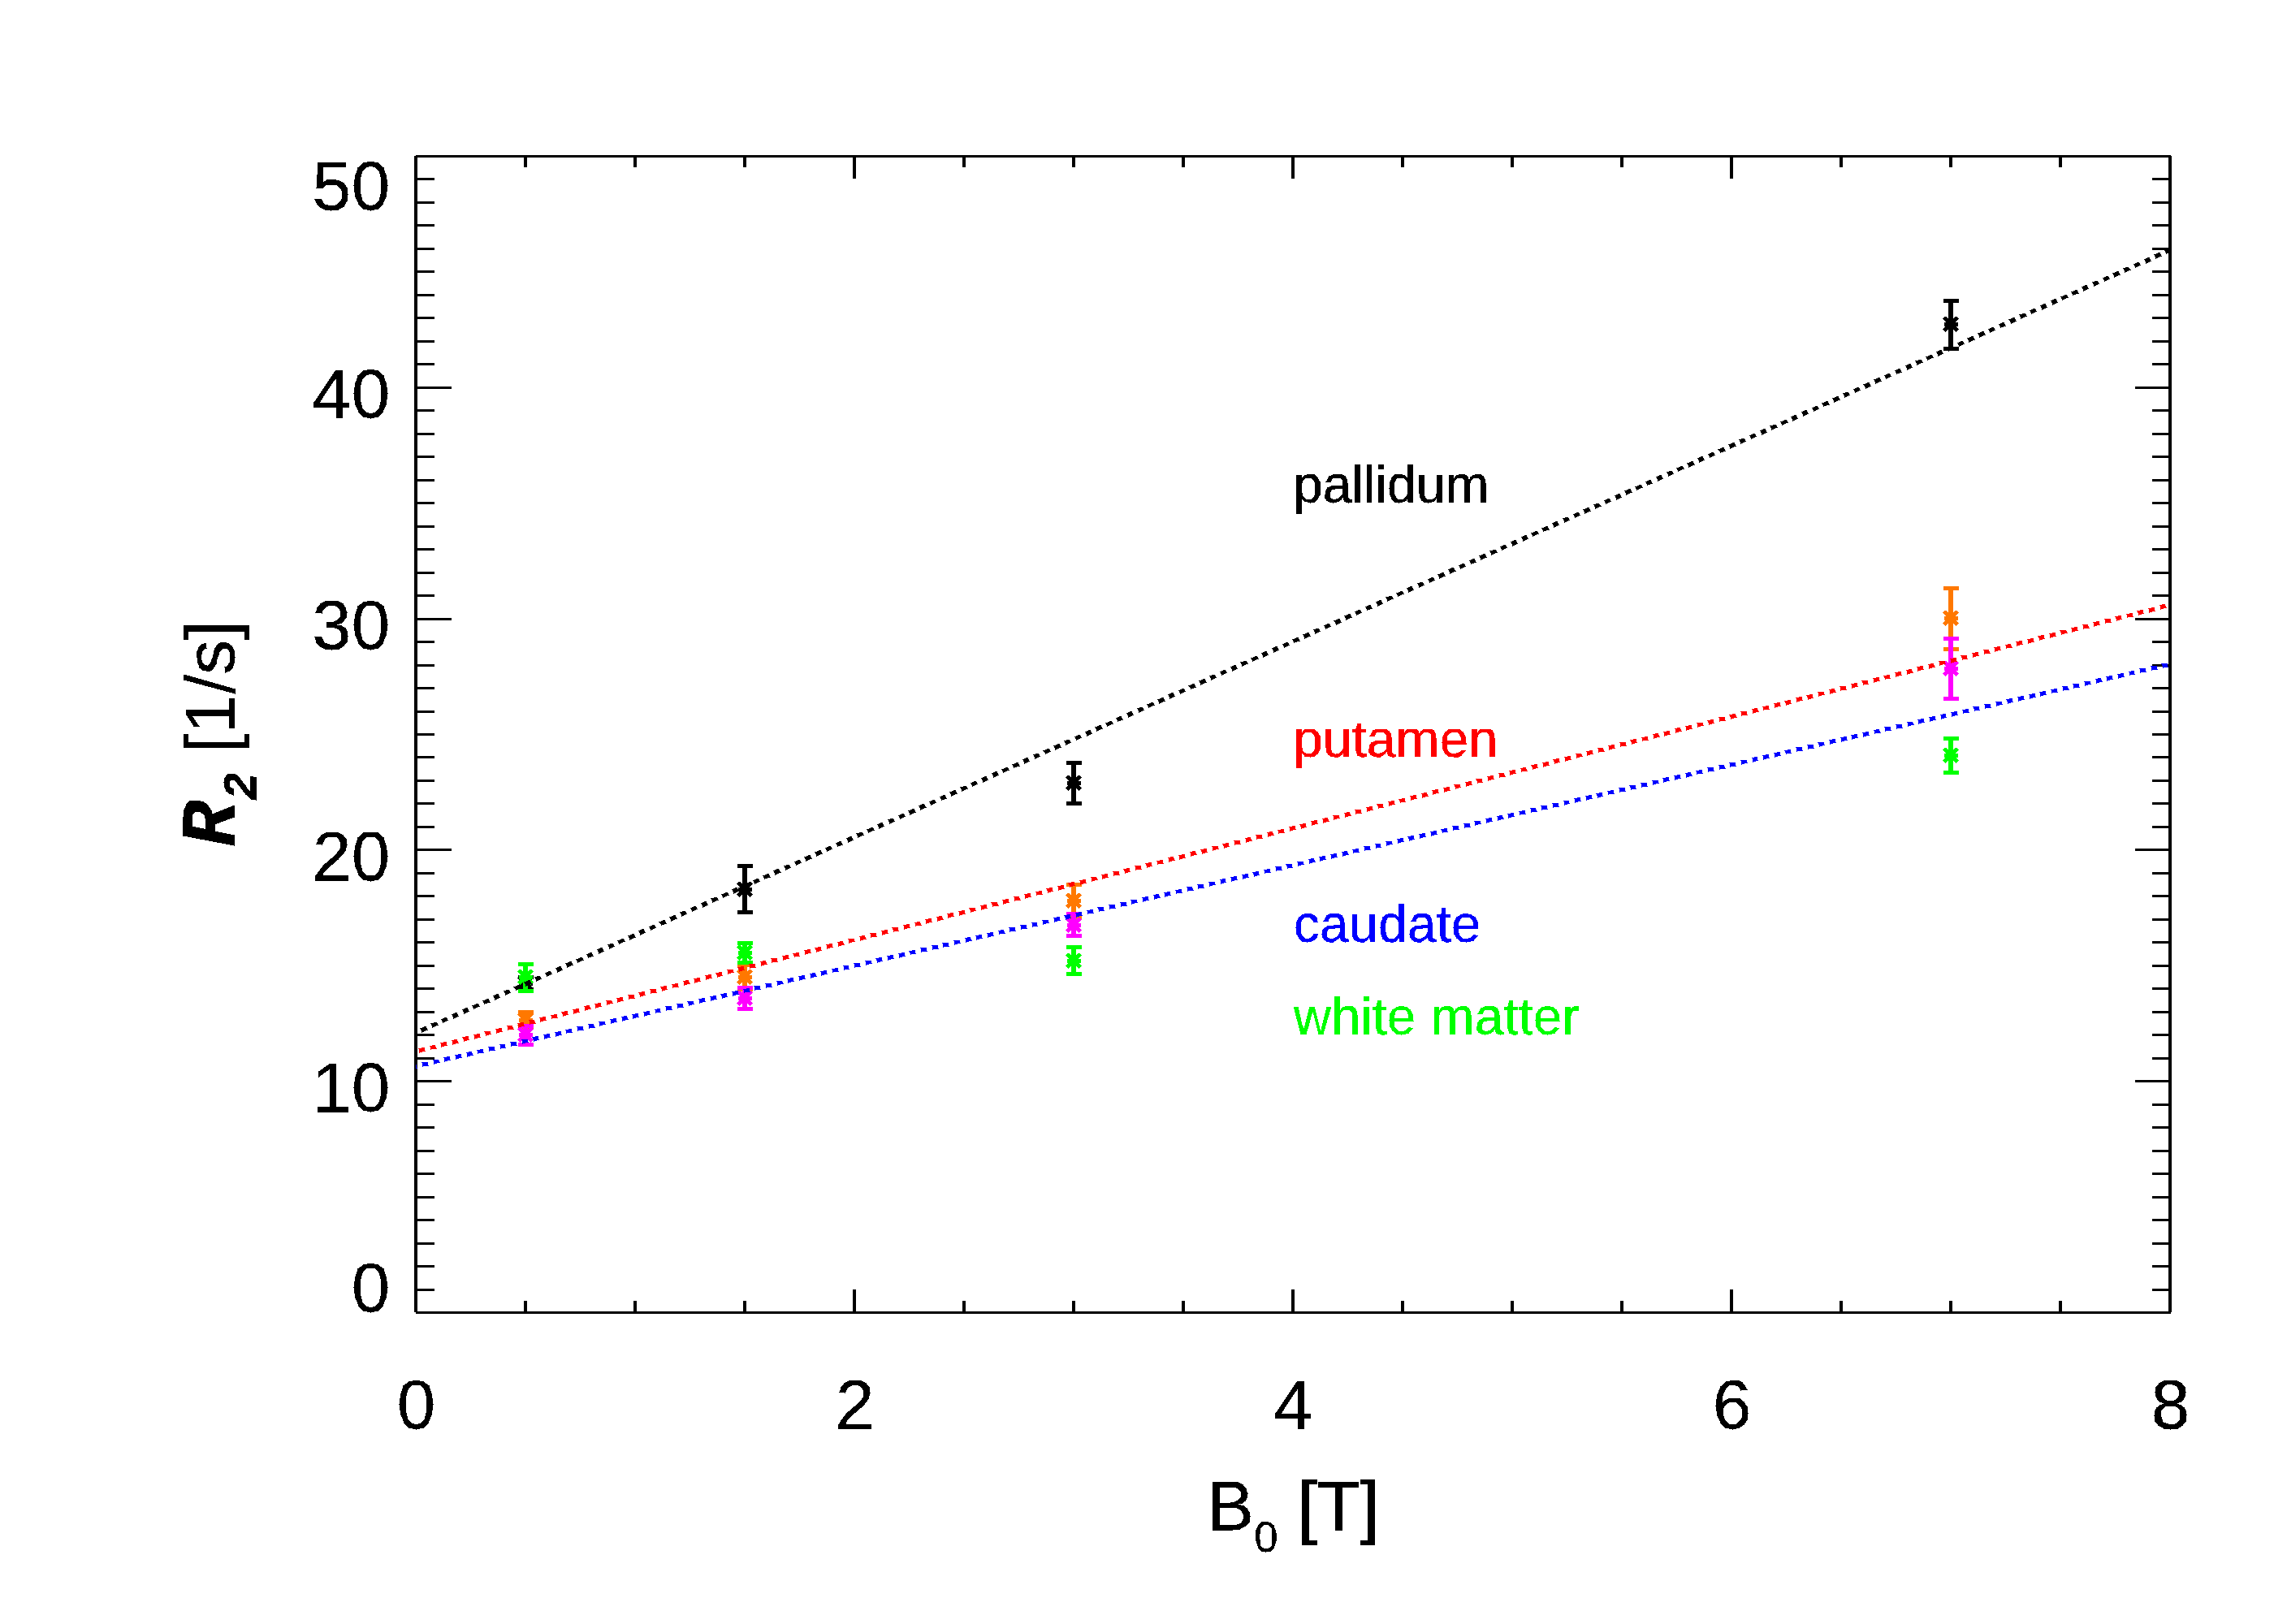
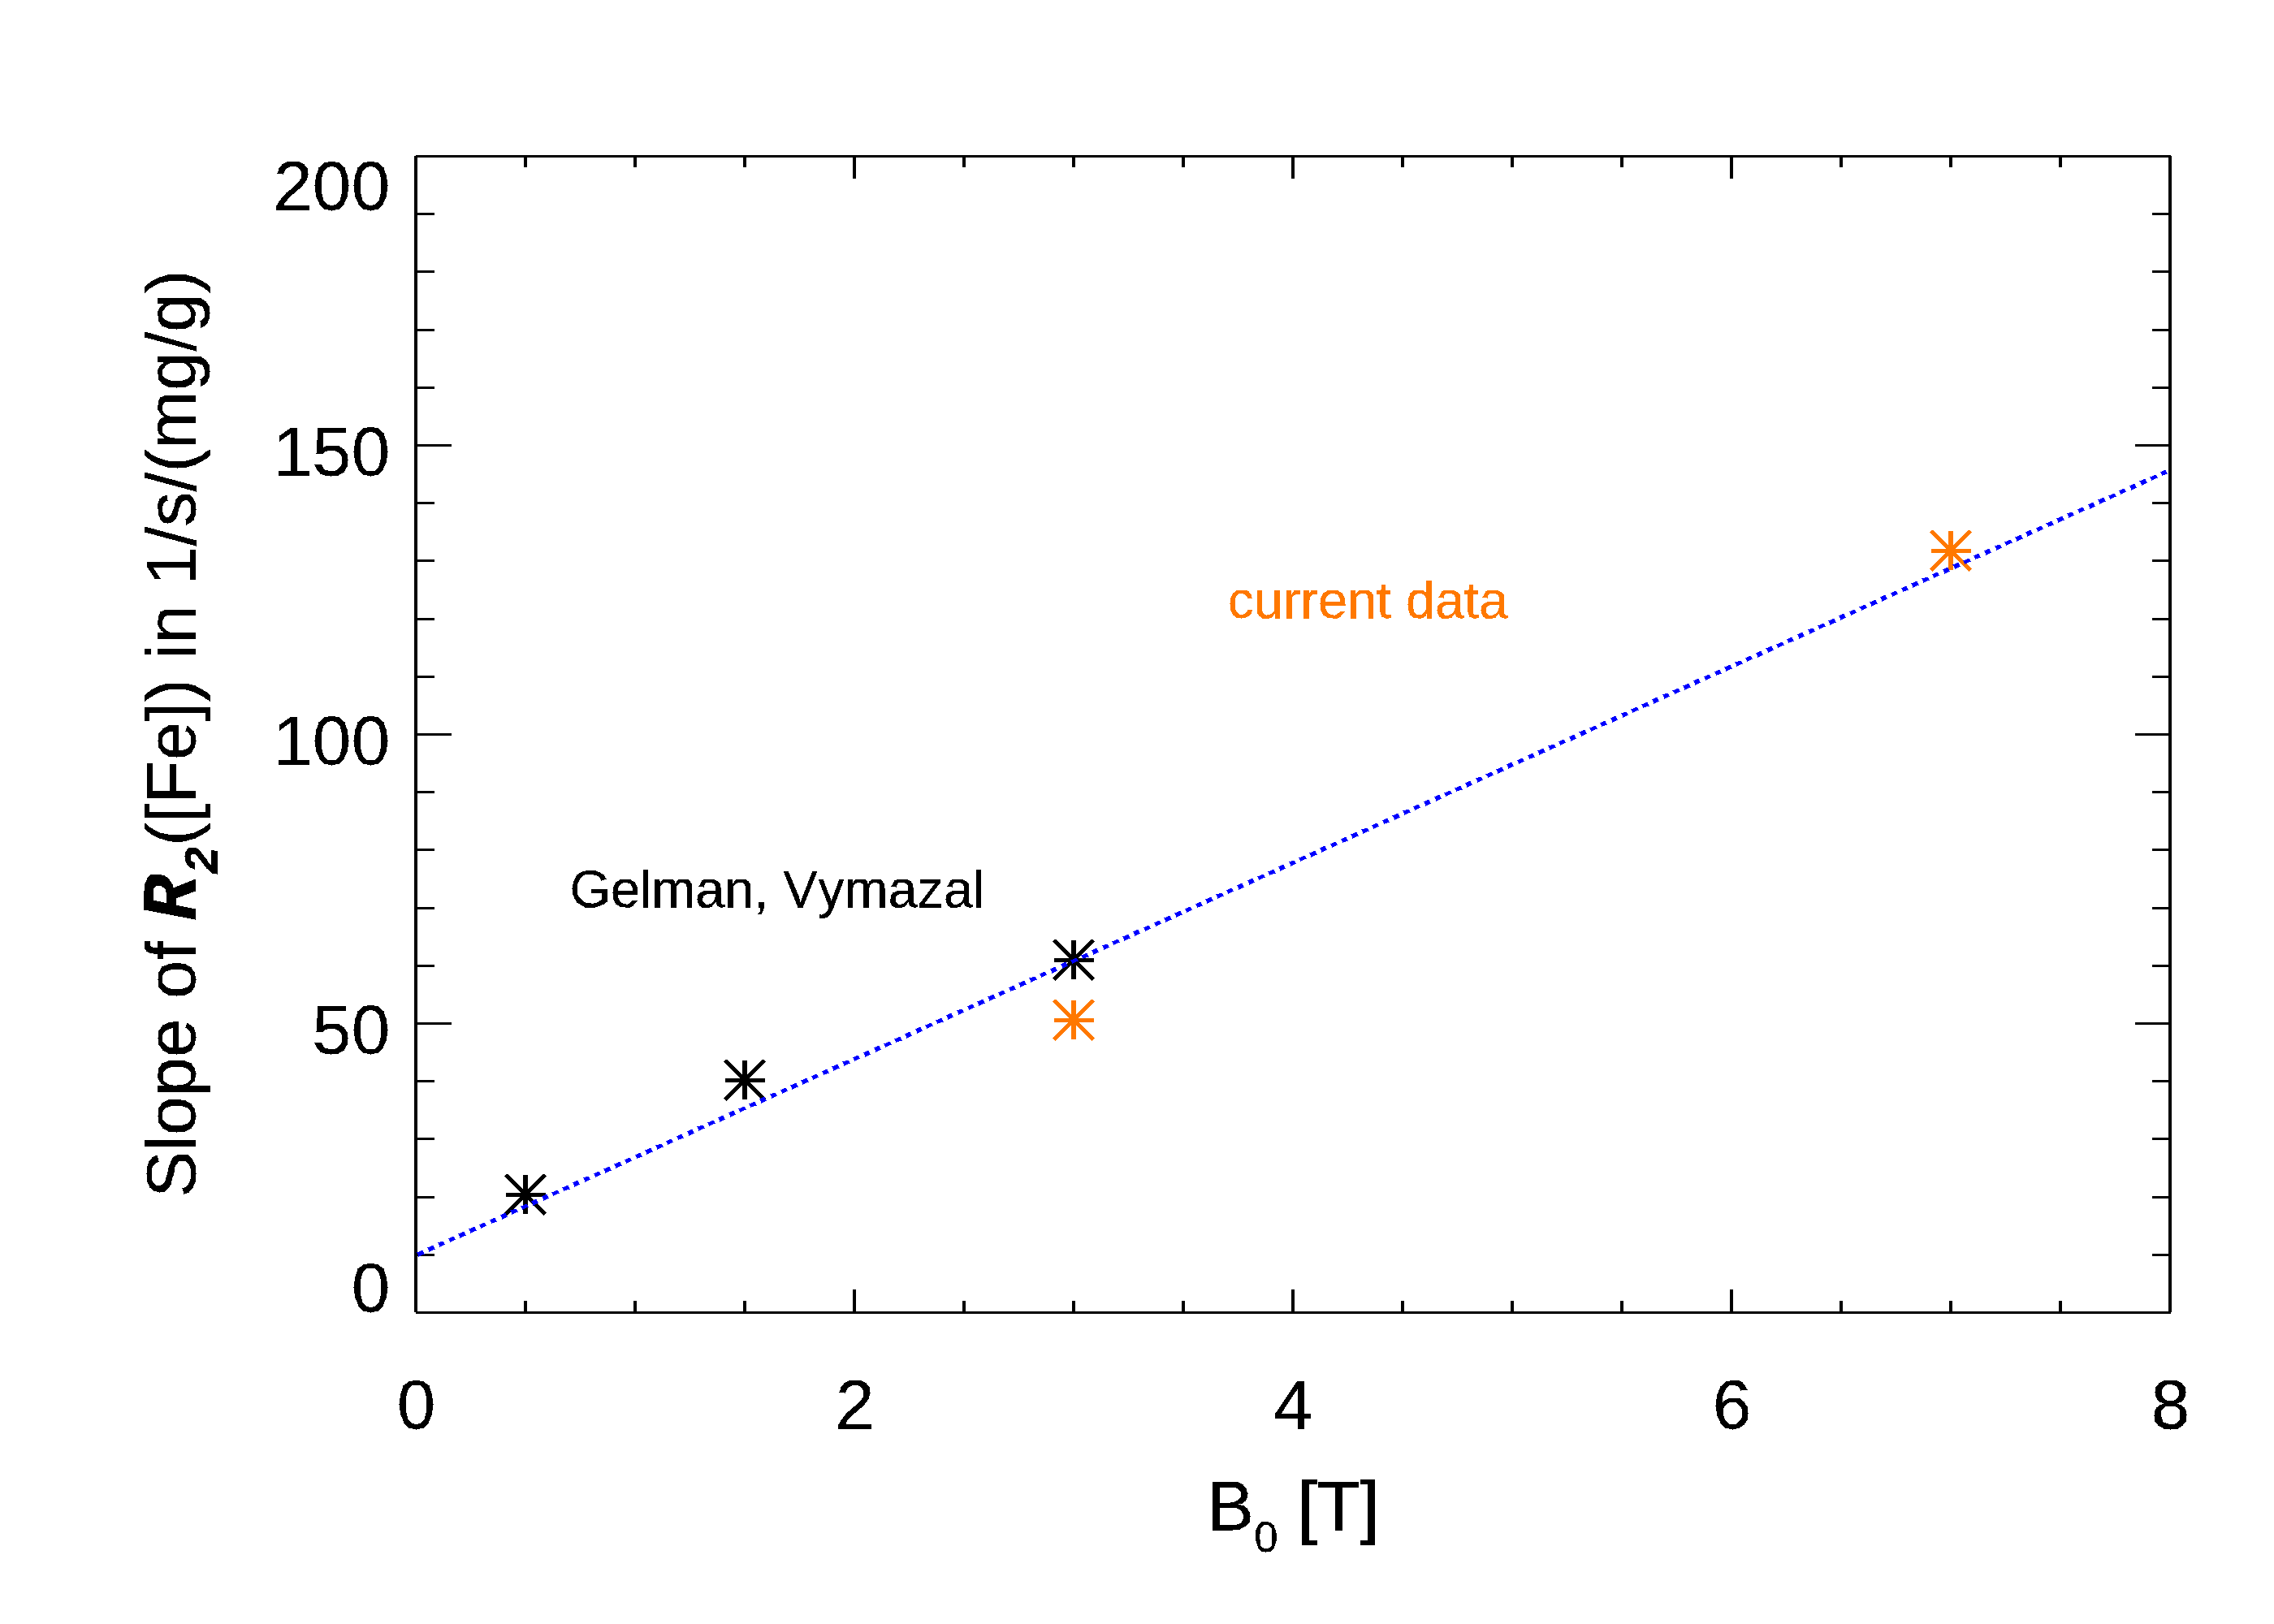
The R2 values for both field strengths are shown in Figure 1 in the 38 resulting ROIs. The slope of the fitted line was 1.62. Most of the data is consistent with this line, with the notable exception of the pallidum and substantia nigra. Fig. 2 shows the relation with the estimated iron concentration for the average subject’s age (from Hallgren (12)), for those regions corresponding to the Hallgren study. The red nucleus is not included here, as the absence of age-dependent data prevented estimation of iron content for our relatively young subject group. The slope of the fitted lines was 50.6 and 132 1/s/(mg/g) for 3 T and 7 T, respectively. Fig. 3 compares these findings to a study of R2 field dependence showing data for 0.5 T and 1.5 T (7). While the iron containing regions appear consistent with that study, the white matter values are not, as our 7 T value is higher than predicted following (7). Fig.4 shows the comparison of the slope of R2 versus iron with two other studies (at 0.5 T, 1.5 T and 3 T (13,14)). The slopes as fitted in Fig. 2 are consistent with these reports. The combined data shows the field dependence of this slope to be 17 1/s/(mg/g)/T.Discussion
The R2 depends on iron content and other tissue characteristics, like the exchange with high R2 components in myelin. Like iron, myelin also has a susceptibility related contribution to R2 (through diffusion), but at a different spatial scale. The differences in mechanism would be expected to show a different field dependence of R2, which is substantiated by the data shown. Combining this data with an independent estimation of myelin, e.g. based on the R1, it may be possible to establish both iron and non-iron contributions to R2. A combined measurement of R1 and R2 at a single field strength then maybe sufficient to estimate both myelin and iron concentrations in brain tissues.Acknowledgements
No acknowledgement found.References
1. Fukunaga M, Li TQ, van Gelderen P, de Zwart JA, Shmueli K, Yao B, Lee J, Maric D, Aronova MA, Zhang G, Leapman RD, Schenck JF, Merkle H, Duyn JH. Layer-specific variation of iron content in cerebral cortex as a source of MRI contrast. Proc Natl Acad Sci U S A 2010;107:3834-3839.
2. Langkammer C, Krebs N, Goessler W, Scheurer E, Ebner F, Yen K, Fazekas F, Ropele S. Quantitative MR imaging of brain iron: a postmortem validation study. Radiology 2010;257:455-462. 3. Bartzokis G. Alzheimer's disease as homeostatic responses to age-related myelin breakdown. Neurobiol Aging 2011;32:1341-1371.
4. Vymazal J, Righini A, Brooks RA, Canesi M, Mariani C, Leonardi M, Pezzoli G. T1 and T2 in the brain of healthy subjects, patients with Parkinson disease, and patients with multiple system atrophy: relation to iron content. Radiology 1999;211:489-495.
5. Dal-Bianco A, Grabner G, Kronnerwetter C, Weber M, Kornek B, Kasprian G, Berger T, Leutmezer F, Rommer PS, Trattnig S, Lassmann H, Hametner S. Long-term evolution of multiple sclerosis iron rim lesions in 7 T MRI. Brain 2021;144:833-847.
6. Damulina A, Pirpamer L, Soellradl M, Sackl M, Tinauer C, Hofer E, Enzinger C, Gesierich B, Duering M, Ropele S, Schmidt R, Langkammer C. Cross-sectional and Longitudinal Assessment of Brain Iron Level in Alzheimer Disease Using 3-T MRI. Radiology 2020;296:619-626.
7. Bartzokis G, Aravagiri M, Oldendorf WH, Mintz J, Marder SR. Field dependent transverse relaxation rate increase may be a specific measure of tissue iron stores. Magn Reson Med 1993;29:459-464.
8. Brooks RA, Vymazal J, Bulte JW, Baumgarner CD, Tran V. Comparison of T2 relaxation in blood, brain, and ferritin. J Magn Reson Imaging 1995;5:446-450.
9. Yablonskiy DA, Wen J, Kothapalli S, Sukstanskii AL. In vivo evaluation of heme and non-heme iron content and neuronal density in human basal ganglia. Neuroimage 2021;235:118012.
10. Yablonskiy DA, Haacke EM. An MRI method for measuring T2 in the presence of static and RF magnetic field inhomogeneities. Magn Reson Med 1997;37:872-876.
11. Cox EF, Gowland PA. Simultaneous quantification of T2 and T'2 using a combined gradient echo-spin echo sequence at ultrahigh field. Magn Reson Med 2010;64:1440-1445.
12. Hallgren B, Sourander P. The effect of age on the non-haemin iron in the human brain. J Neurochem 1958;3:41-51.
13. Vymazal J, Hajek M, Patronas N, Giedd JN, Bulte JW, Baumgarner C, Tran V, Brooks RA. The quantitative relation between T1-weighted and T2-weighted MRI of normal gray matter and iron concentration. J Magn Reson Imaging 1995;5:554-560.
14. Gelman N, Gorell JM, Barker PB, Savage RM, Spickler EM, Windham JP, Knight RA. MR imaging of human brain at 3.0 T: preliminary report on transverse relaxation rates and relation to estimated iron content. Radiology 1999;210:759-767.
Figures