4900
Optimisation of T1 measurement sensitivity for Oxygen-Enhanced MRI assessment of hypoxia in patients with head and neck cancers1Division of Radiotherapy and Imaging, The Institute of Cancer Research, London, United Kingdom, 2MRI Unit, The Royal Marsden NHS Foundation Trust, London, United Kingdom, 3Division of Cancer Sciences, University of Manchester, Manchester, United Kingdom, 4Radiology, The Christie NHS Foundation Trust, Manchester, United Kingdom
Synopsis
Keywords: Relaxometry, Quantitative Imaging, Oxygen-Enhanced MRI
Hypoxia is an important prognostic factor for head and neck cancers (HNC). Oxygen-Enhanced MRI (OE-MRI) can map hypoxia, by quantifying change in longitudinal relaxation time, T1, but the technique suffers from low signal-to-noise ratio (SNR), which reduces the sensitivity of hypoxia detection. We optimised standard T1 mapping methods on a 1.5T scanner, to select an accurate, precise, and high SNR sequence, derived in a phantom and in healthy volunteers. 3D Variable Flip Angle spoiled gradient-echo acquisition with view-sharing, flip angles 2o and 8-10o and with B1 correction applied provided suitable protocol for clinical application.
INTRODUCTION
Hypoxia is linked with cancer aggressiveness and treatment resistance in patients with head and neck cancers (HNC)1. Oxygen-Enhanced MRI (OE-MRI) has been shown to quantify and map hypoxia in HNC and other tumour types2–6. In OE-MRI the tissue longitudinal relaxation time (T1) shortens in well-oxygenated tissues when participants breathe 100% oxygen (O2) after switching from medical air (21% O2).This change is distinct from poorly oxygenated and hypoxic tissue where negligible $$$\Delta T_1$$$ is seen. A key challenge of OE-MRI is low signal-to-noise ratio (SNR) which impacts the reliability of hypoxia classification. This work presents a framework to optimise OE-MRI acquisition, by maximising the sensitivity to expected $$$\Delta T_1$$$, with sufficient temporal resolution to map hypoxia reliably.METHODS
This study was approved by a research ethics committee (ClinicalTrials.gov NCT05118555); all volunteers gave written informed consent.Imaging
A standard system phantom (ISMRM/NIST7) and 2 female healthy volunteers (ages 36 and 39 yrs.) were scanned on a 1.5T MR scanner (MAGNETOM Sola, Siemens Healthcare, Erlangen, Germany) with an UltraFlex Large 18 receiver coil (anterior) and a 20-channel head and neck receiver coil (posterior).Acquisition and analysis
Initial criteria to select suitable acquisition methods included minimum coverage of nasal conchae to base of the neck, spatial resolution (based on clinical HNC imaging), temporal resolution of $$$\lt 15 sec$$$ (based on time scale of expected $$$\Delta T_1$$$ in HNC tumours5,6) and absence of gross artefacts. Available options on our scanner included 3D Variable Flip Angle spoiled gradient-echo acquisition with and without acceleration using view-sharing (Time-resolved angiography With Interleaved Stochastic Trajectories, TWIST), hereinafter these are referred to as VFA-TWIST and VFA, respectively. T1 values were estimated using in-house software8, using acquisitions with a pair of flip angles (FAs). Acquisition protocols are detailed in Fig1.Signal stability over time was assessed by investigating various levels of k-space under-sampling for VFA-TWIST. Here we shall describe the view-sharing in terms of the proportion of k-space sampled; the proportion A at the centre of k-space is sampled at every timepoint, while a proportion of peripheral k-space, B, is randomly sampled and shared between neighbouring time-points. So, VFA-TWIST A20B33 denotes A covering 20% at the centre of k-space, and 33% of B sampled at each time-point. We then assessed the accuracy, precision, and SNR of T1 methods with acceptable temporal stability, to obtain a suitable method for reliable hypoxia quantification. We tested several pairs of FAs, for a set repetition time ($$$TR=4.8ms$$$), to find the optimal ones for our tissues of interest in HNC ($$$T_1=700-1500ms$$$) and assessed the impact of B1 inhomogeneity correction on T1 estimation.
Regions-of-interest (ROIs) were drawn for four spheres in the NIST-phantom (reference T1 values in range of interest), and in nasal conchae, bone marrow, muscle, and brain in volunteer images (Fig1c-d). We quantified the stability of signals using autocorrelation function, the accuracy/precision using T1 estimates from IR-TSE and SNR using T1 Noise Factor ($$$T_1 NF$$$)9 (MATLAB R2021b, MathWorks, Natick, MA).
RESULTS
Stability analysis (Fig2) showed that VFA-TWIST has undesirable temporal correlations for the highest view-sharing (a). These correlations reduce as the proportion of sampled k-space is increased (c), but at the cost of temporal resolution (b). VFA-TWIST with A60B50 meets the target for sensitivity to $$$\Delta T_1$$$ (d) and temporal resolution.T1 mapping using VFA-TWIST A60B50 acquired with FAs 2o and 8-10o and B1 correction applied, is accurate and precise with lowest $$$T_1 NF$$$ (highest SNR) (Fig3); we found comparable results for VFA and VFA-TWIST A60B50. Repeatability analysis (Fig4) showed good agreement for the best performing TWIST-VFA A60B50, between the scans acquired 9 days and 2 hours apart.
Volunteer data (Fig5) was consistent with phantom analysis, for the optimal FA pairs for the $$$T_1 NF$$$ and agreement between VFA-TWIST and VFA. However, there were no significant differences between the T1 estimates with and without B1 correction.
DISCUSSION
T1 mapping with B1 corrected VFA-TWIST acquired with FAs 2o and 8-10o was accurate, precise, of sufficient SNR and repeatable, making it suitable for reliable OE-MRI. We optimised the acquisition for sensitivity to $$$\Delta T_1$$$ and high SNR, and for $$$TR=4.8ms$$$, we obtain optimal FAs pairs different to other HNC OE-MRI studies3,5,6, but with similar temporal and spatial resolutions. Results were confirmed in two healthy volunteers.The undesirable temporal pattern in VFA-TWIST may be due to noise propagated through time due to view-sharing. Previous work on VFA-TWIST10 did not report any undesirable features for their application, but for OE-MRI the impact of temporal fluctuations and high temporal resolution for acquisition are very important. VFA-TWIST with A60B50 as view-sharing proportions is a good candidate for acquiring data with high temporal resolution while reducing the unwanted temporal patterns.
CONCLUSION
There is a lack of consensus on the sequence or acquisition parameters to use for OE-MRI and this work will help in wider adoption of this technique. We have selected an optimum T1 mapping protocol for sensitive and stable estimation of hypoxia which will be applied in an Oxygen-Enhanced MRI study of patients with head and neck cancers on our 1.5T platform. The framework presented can be used for any scanner for OE-MRI to maximise the sensitivity to expected $$$\Delta T_1$$$ with target temporal resolution.Acknowledgements
This work is supported by funding from Cancer Research UK and the Medical Research Council. This study represents independent research funded by the National Institute for Health and Care Research (NIHR) Biomedical Research Centre and the Clinical Research Facility in Imaging at The Royal Marsden NHS Foundation Trust and The Institute of Cancer Research, London. The views expressed are those of the author(s) and not necessarily those of the NIHR or the Department of Health and Social Care.References
1. Singleton, D. C., Macann, A. & Wilson, W. R. Therapeutic targeting of the hypoxic tumour microenvironment. Nat. Rev. Clin. Oncol. 18, 751–772 (2021).2. O’Connor, J. P. B. et al. Oxygen-Enhanced MRI Accurately Identifies, Quantifies, and Maps Tumor Hypoxia in Preclinical Cancer Models. Cancer Res. 76, 787–795 (2016).
3. Panek, R. et al. Oxygen-Enhanced MRI for the Detection of Hypoxia in Patients with Head and Neck Cancer. in Proceedings for ISMRM (2018).
4. Salem, A. et al. Oxygen-enhanced MRI Is Feasible, Repeatable, and Detects Radiotherapy-induced Change in Hypoxia in Xenograft Models and in Patients with Non-small Cell Lung Cancer. Clin. Cancer Res. Off. J. Am. Assoc. Cancer Res. 25, 3818–3829 (2019).
5. Dubec, M. et al. First in-human technique translation of OE-MRI for hypoxia imaging onto an MR Linac system in patients with head and neck cancer. in Proceedings for ISMRM (2022).
6. McCabe, A. et al. Oxygen induced T1 changes in head and neck anatomical structures. in ISMRM (2022).
7. Stupic, K. F. et al. A standard system phantom for magnetic resonance imaging. Magn. Reson. Med. 86, 1194–1211 (2021).
8. d’Arcy, J. A. et al. Magnetic Resonance Imaging Workbench: Analysis and Visualization of Dynamic Contrast-enhanced MR Imaging Data1. RadioGraphics (2006).
9. Jerome, N. P. et al. Development of a temperature-controlled phantom for magnetic resonance quality assurance of diffusion, dynamic, and relaxometry measurements: Temperature-controlled quality assurance phantom for functional quantitative MRI. Med. Phys. 43, 2998–3007 (2016).
10. Panek, R. et al. Time-resolved angiography with stochastic trajectories for dynamic contrast-enhanced MRI in head and neck cancer: Are pharmacokinetic parameters affected? Med. Phys. 43, 6024–6032 (2016).
Figures
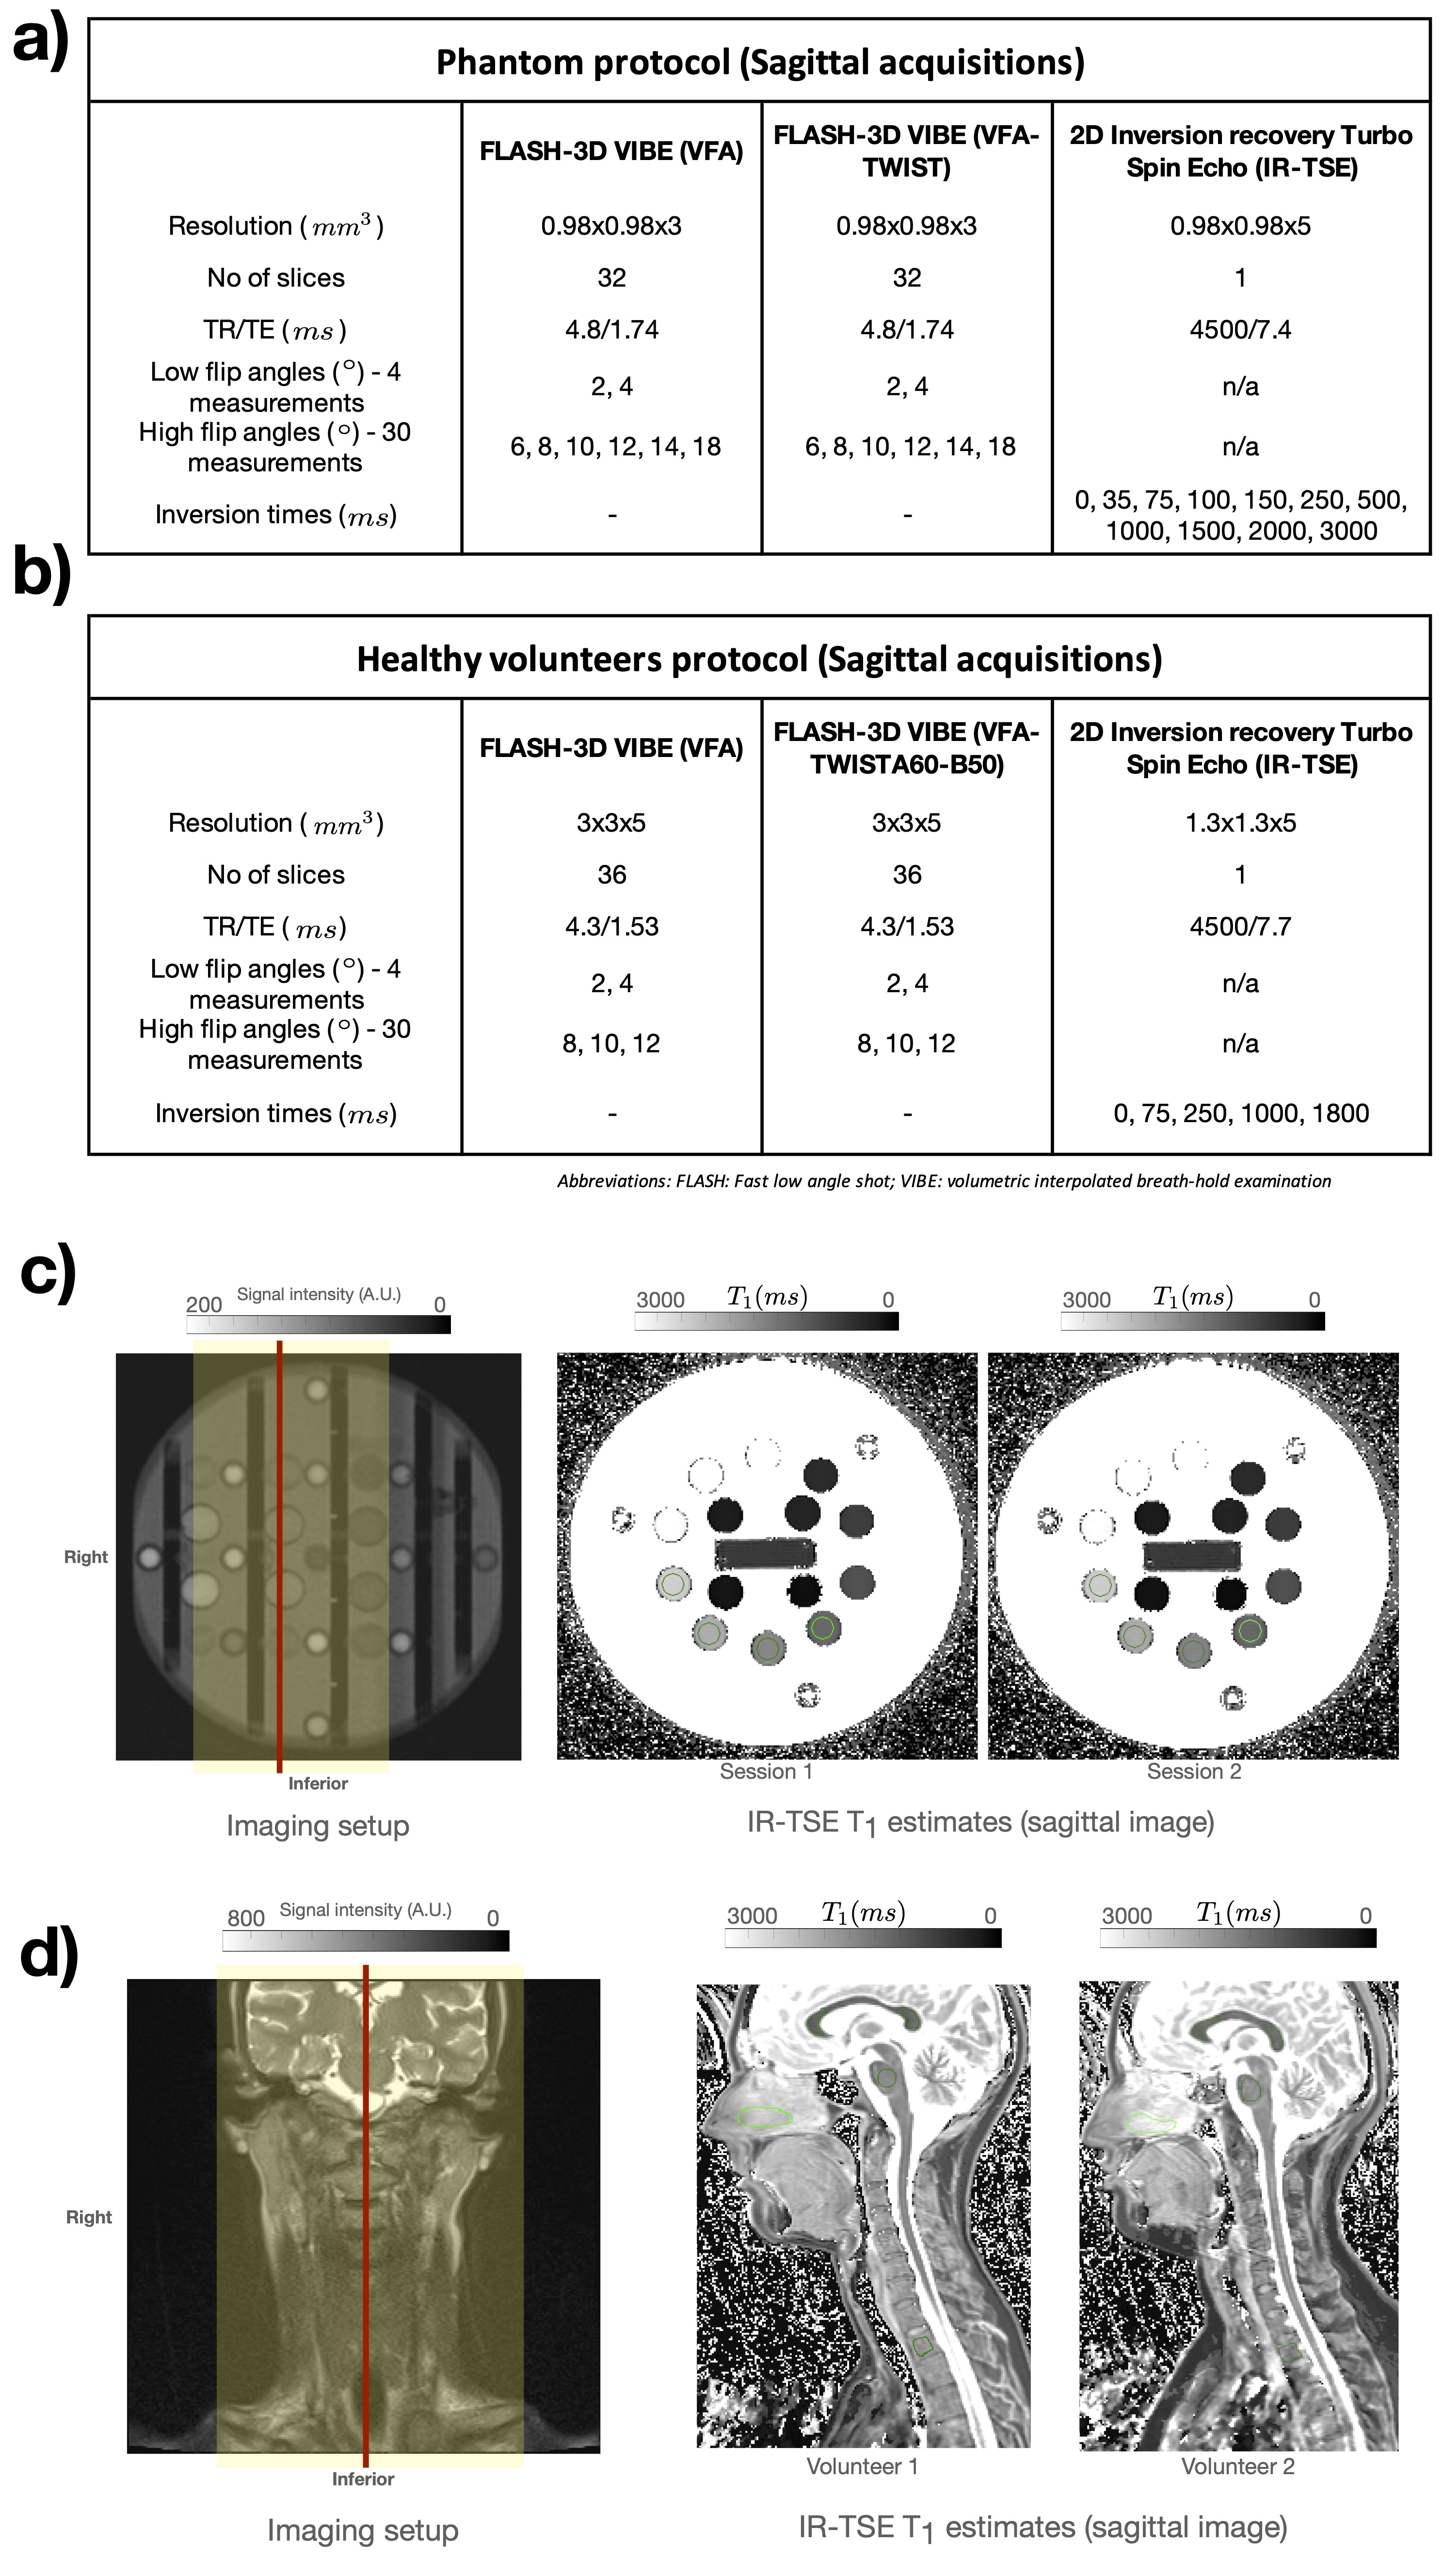
Fig1: a-b) Acquisition protocols for the phantom and healthy volunteers. c-d) show coverage for the images acquired and T1 maps from IR-TSE data. Volunteers were scanned in head-first supine position. The imaging volume for VFA/VFA-TWIST acquisitions is marked by shaded areas in the imaging setup; for IR-TSE the acquired slice is shown in red. Regions-of-interest (ROIs) were drawn on the IR-TSE acquisitions (green contours). T1 estimates for these ROIs are used as reference values for quantitative analysis in the corresponding sessions.
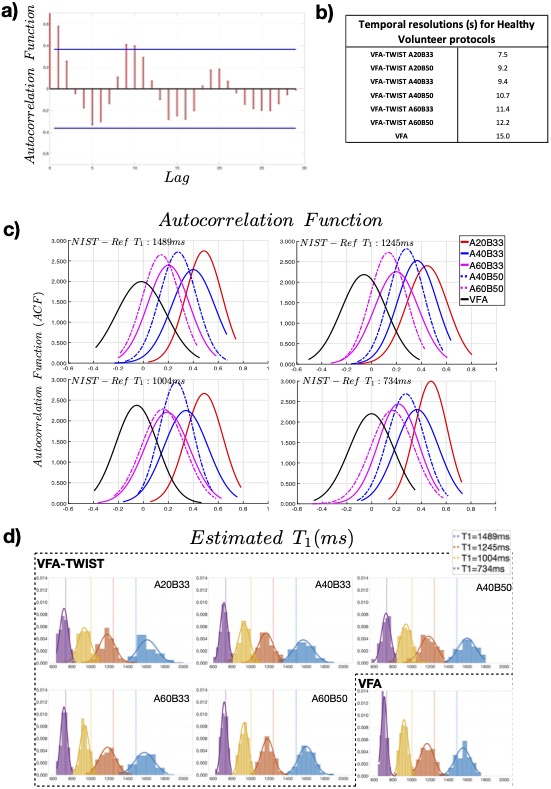
Fig2: Stability of phantom data: a) correlogram for VFA-TWIST A20B33, where autocorrelation function (ACF) is plotted for data with a certain lag between them, for a single voxel. b) Temporal resolutions for VFA-TWIST and VFA. c) Distributions of voxel-wise ACF (lag=1), for the four spheres, for various acquisitions. d) Distributions of T1 estimates for the different acquisitions; dotted lines show NIST-Reference T1. Results are for B1 corrected data, with FAs 2o/8o. Session temperature: 21o, NIST-Reference values at: 20o.(See main text for VFA-TWIST view-sharing terminology)
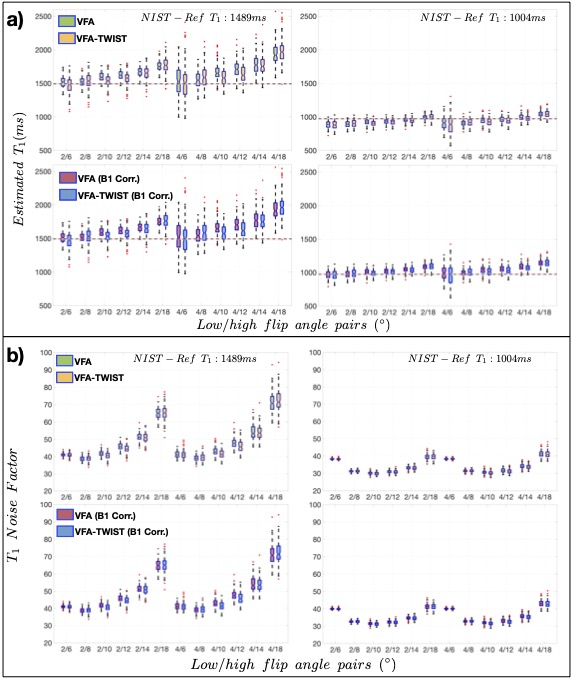
Fig3: Accuracy, precision, and SNR analysis for phantom data: a) distributions of estimated T1 and b) noise factors ($$$T_1 NF$$$) obtained for acquisitions with a range of FA pairs, for VFA and VFA-TWIST A60B50, for original data and data corrected for B1 inhomogeneity, as annotated. The results are shown for two of the phantom spheres evaluated, and for all the FA pairs tested (x-axes). IR-TSE T1 reference values are shown as dashed lines in a), with shaded red regions displaying variability in these (NIST-Reference T1 values are also shown). Session temperature: 22.5o.
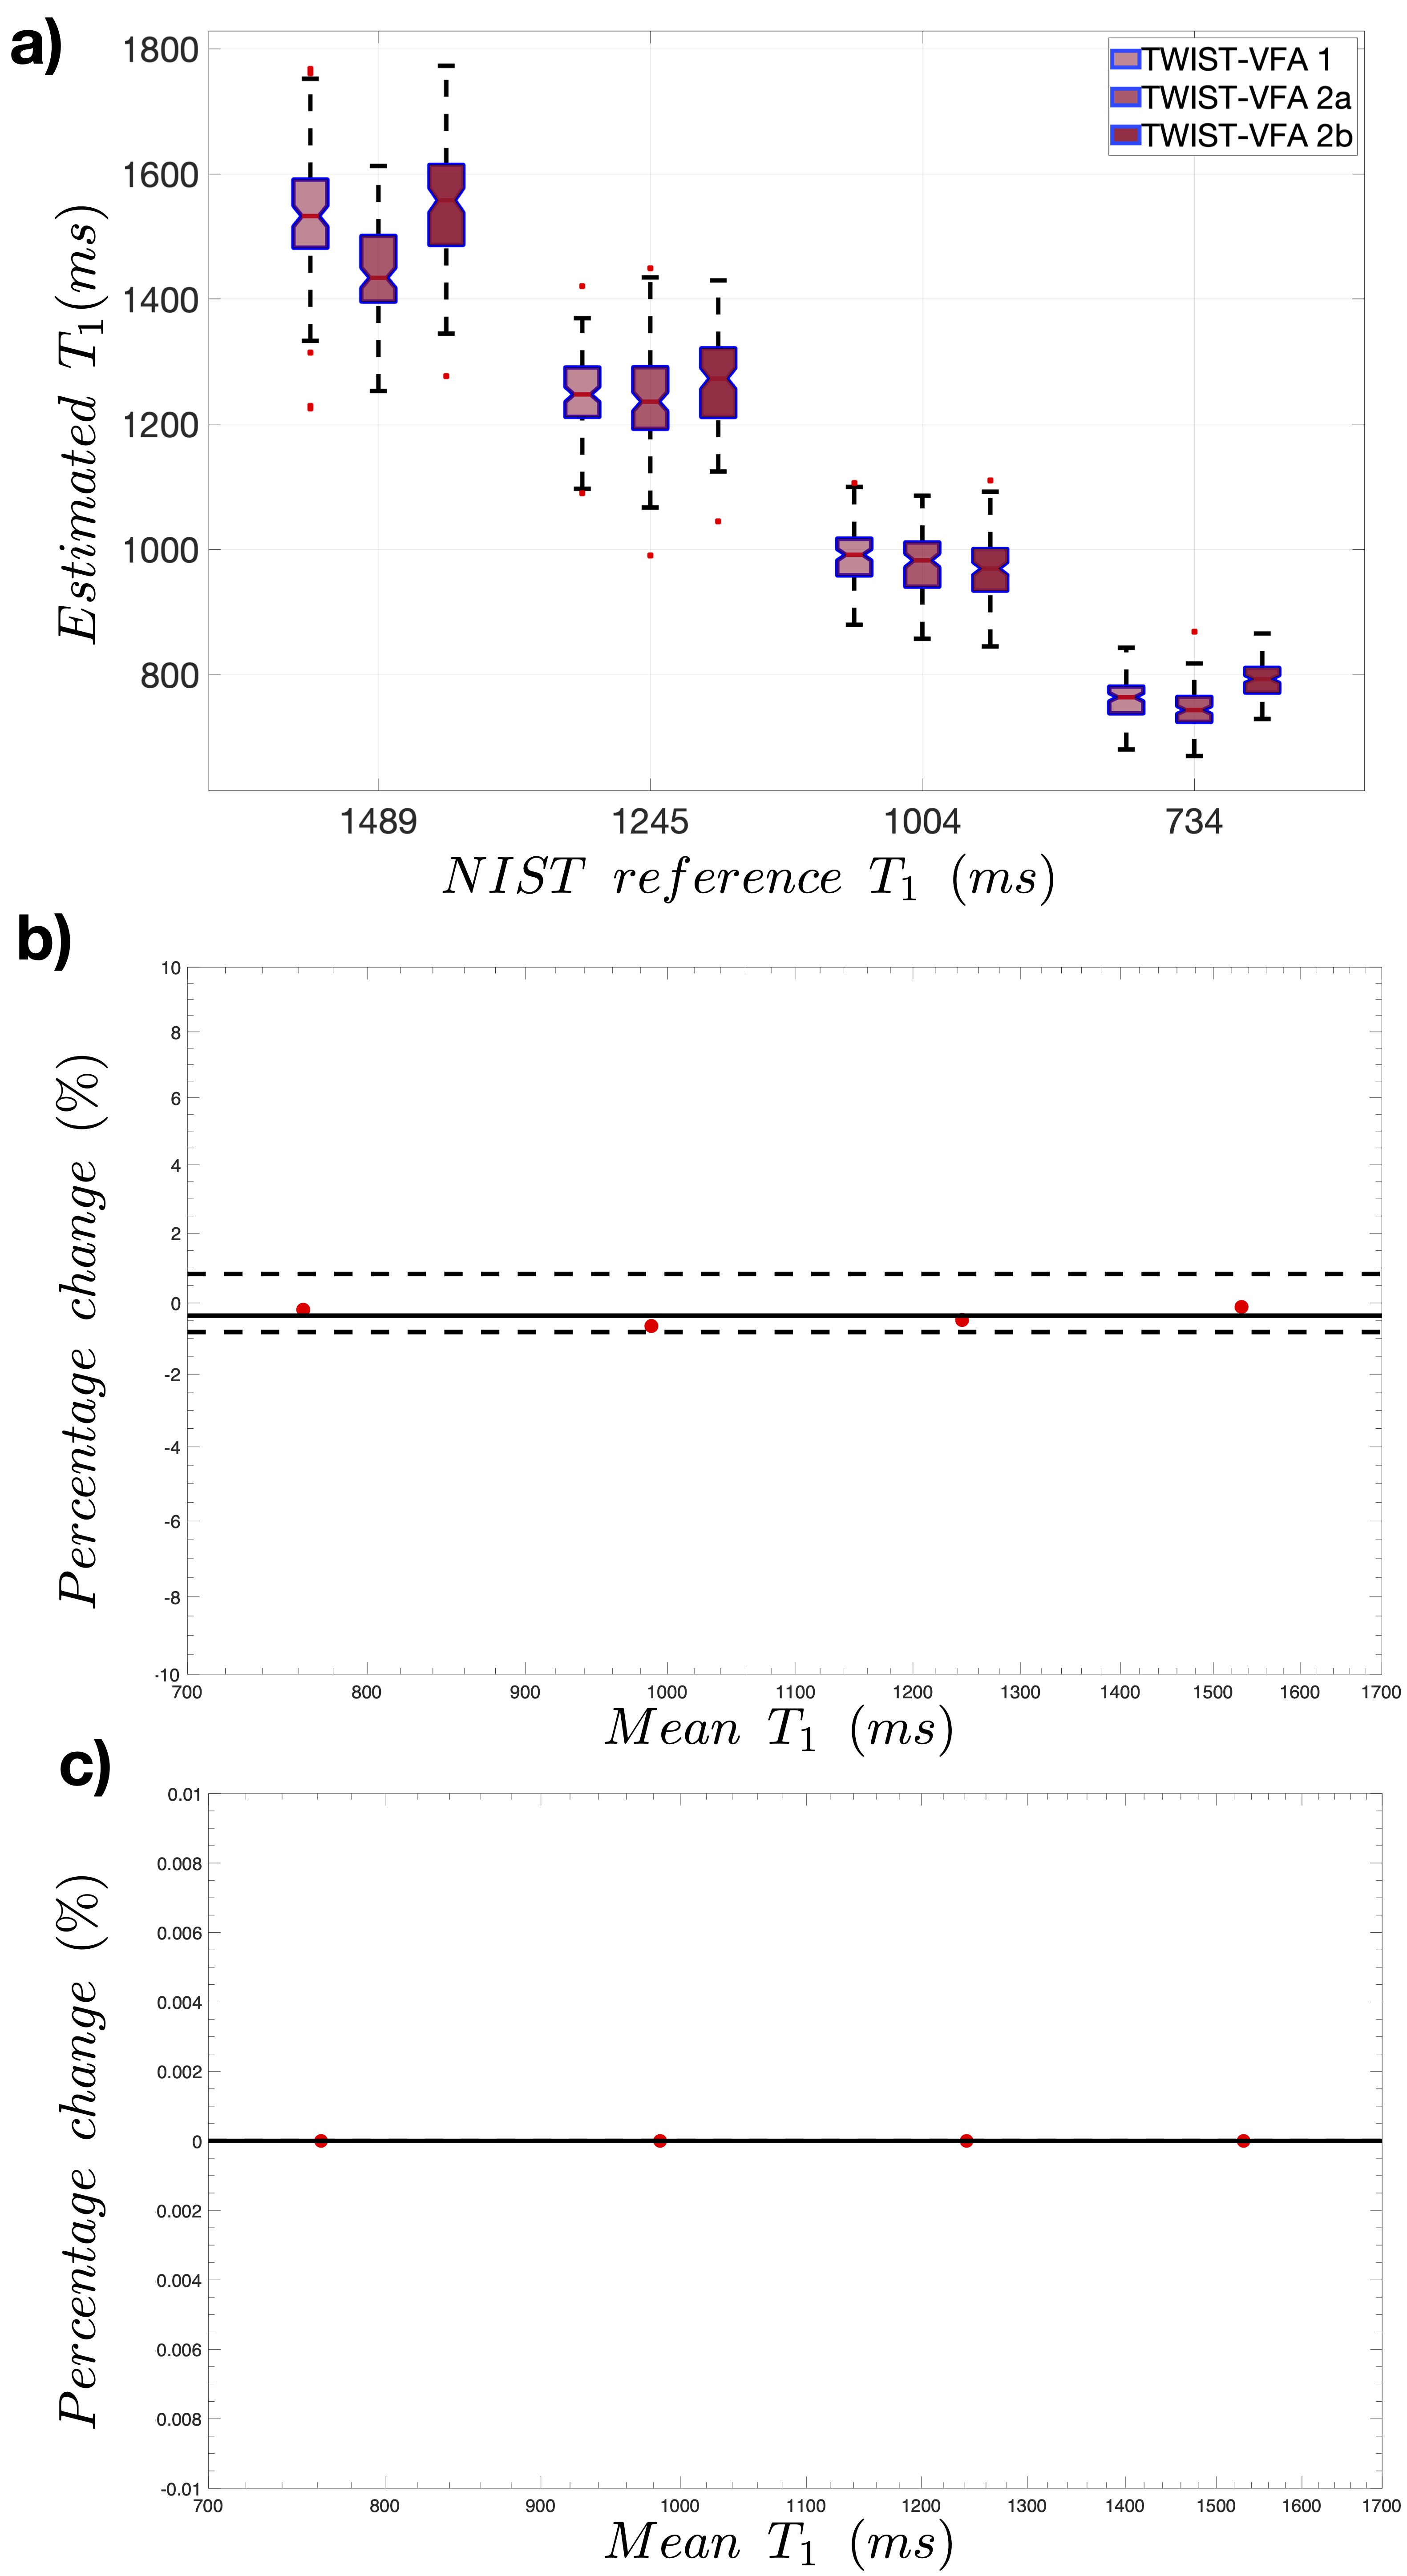
Fig4: Repeatability analysis for the best performing acquisition - TWIST-VFA A60B50 with FAs 2o and 10o (TR=4.8ms) and B1 correction. a) distributions of T1 estimated from imaging in session 1 (TWIST-VFA 1) and session 2 (TWIST-VFA 2a and TWIST-VFA 2b). b-c) Bland-Altman plots for long-term (TWIST-VFA 1 vs TWIST-VFA 2a) and short-term (TWIST-VFA 2a vs TWIST-VFA 2b) repeatability, for T1 estimates for the four NIST-phantom spheres. Imaging was performed 9 days apart for long-term and two hours apart for short-term repeatability. (Temperatures: session 1: 22.5o, session 2: 22o).
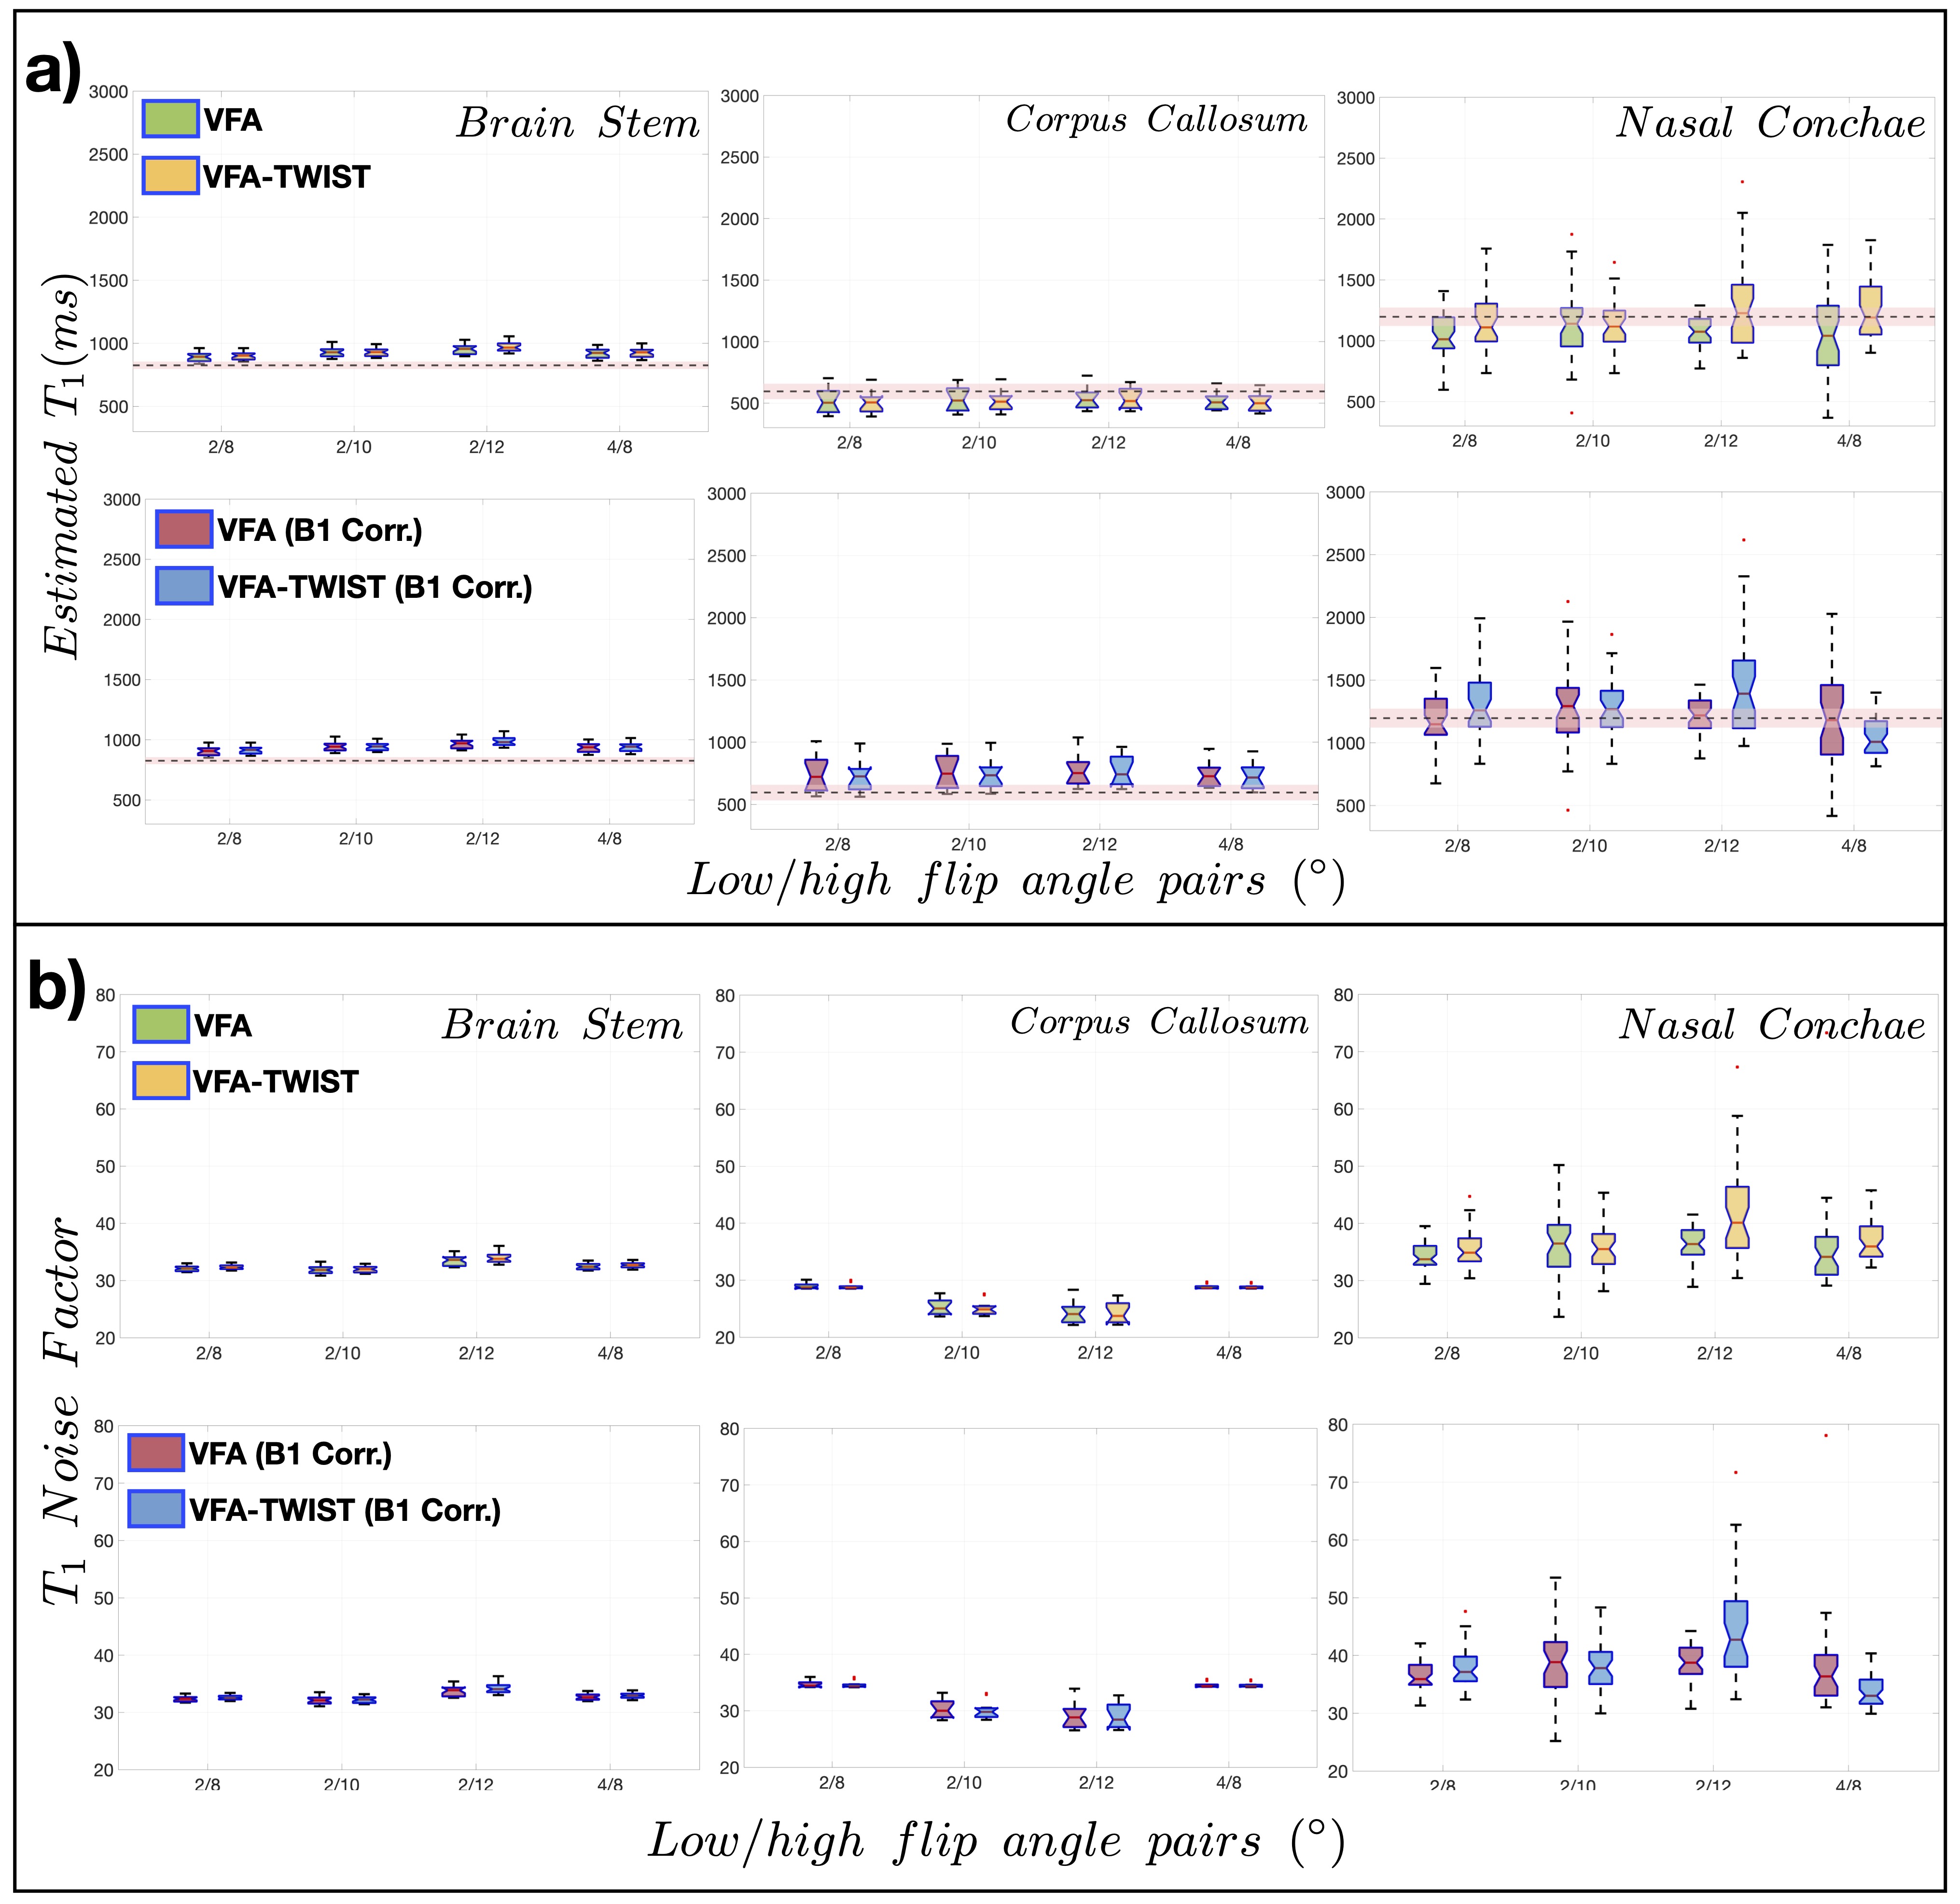
Fig5: Accuracy, precision, and SNR analysis on healthy volunteer data: a) distributions of estimated T1 and b) $$$T_1 NF$$$ obtained for acquisitions with a range of FA pairs, for VFA and VFA-TWIST A60B50, for original data and data corrected for B1 inhomogeneity, as annotated. The results are shown for one volunteer for three ROIs, and for the FA pairs tested (x-axes). IR-TSE reference T1 values are shown as dotted lines (with variability in estimated shows as shaded red regions) in a).