4899
Analysis of spin-lock techniques for the non-invasive detection of neuronal currents with magnetic resonance1Support Center for Advanced Neuroimaging (SCAN), University of Bern, Bern, Switzerland
Synopsis
Keywords: Electromagnetic Tissue Properties, Simulations, Spin-lock, Neuronal Current Imaging
Different SL techniques have been proposed to generate images based with a contrast based on neuronal activity. We analyzed the contrast of different SL techniques for the detection of oscillatory magnetic fields and their dependence with the duration of the SL and the initial phase of the target field.Introduction
Non-invasive detection of neuronal activity remains a challenge for neuroscience to this day, as current methods detect it indirectly (fMRI) or with limited spatial resolution (EEG, MEG). Techniques using spin-lock (SL) pulses produce a contrast when the SL-induced frequency (FSL) matches the frequency of an oscillatory target field (FBT), ideally induced by neuronal activity1. These methods proved to be a promising tool to directly encode information about oscillating electromagnetic fields using magnetic resonance. In this work, we analyze three sequences that use this principle to generate a contrast based on neuronal activity: stimulus-induced rotational saturation (SIRS)1,2, spin-lock oscillatory excitation (SLOE)3, and rotary excitation (REX)4,5. These sequences differ in the SL preparation used and the direction in which the contrast is generated. For each of them, we compared the performance of two spin-lock preparations, the composite rotary echo spin-lock (CRESL6) and the balanced spin-lock (BalSL7). We explore the practical differences between the approaches through simulations and phantom experiments.Methods
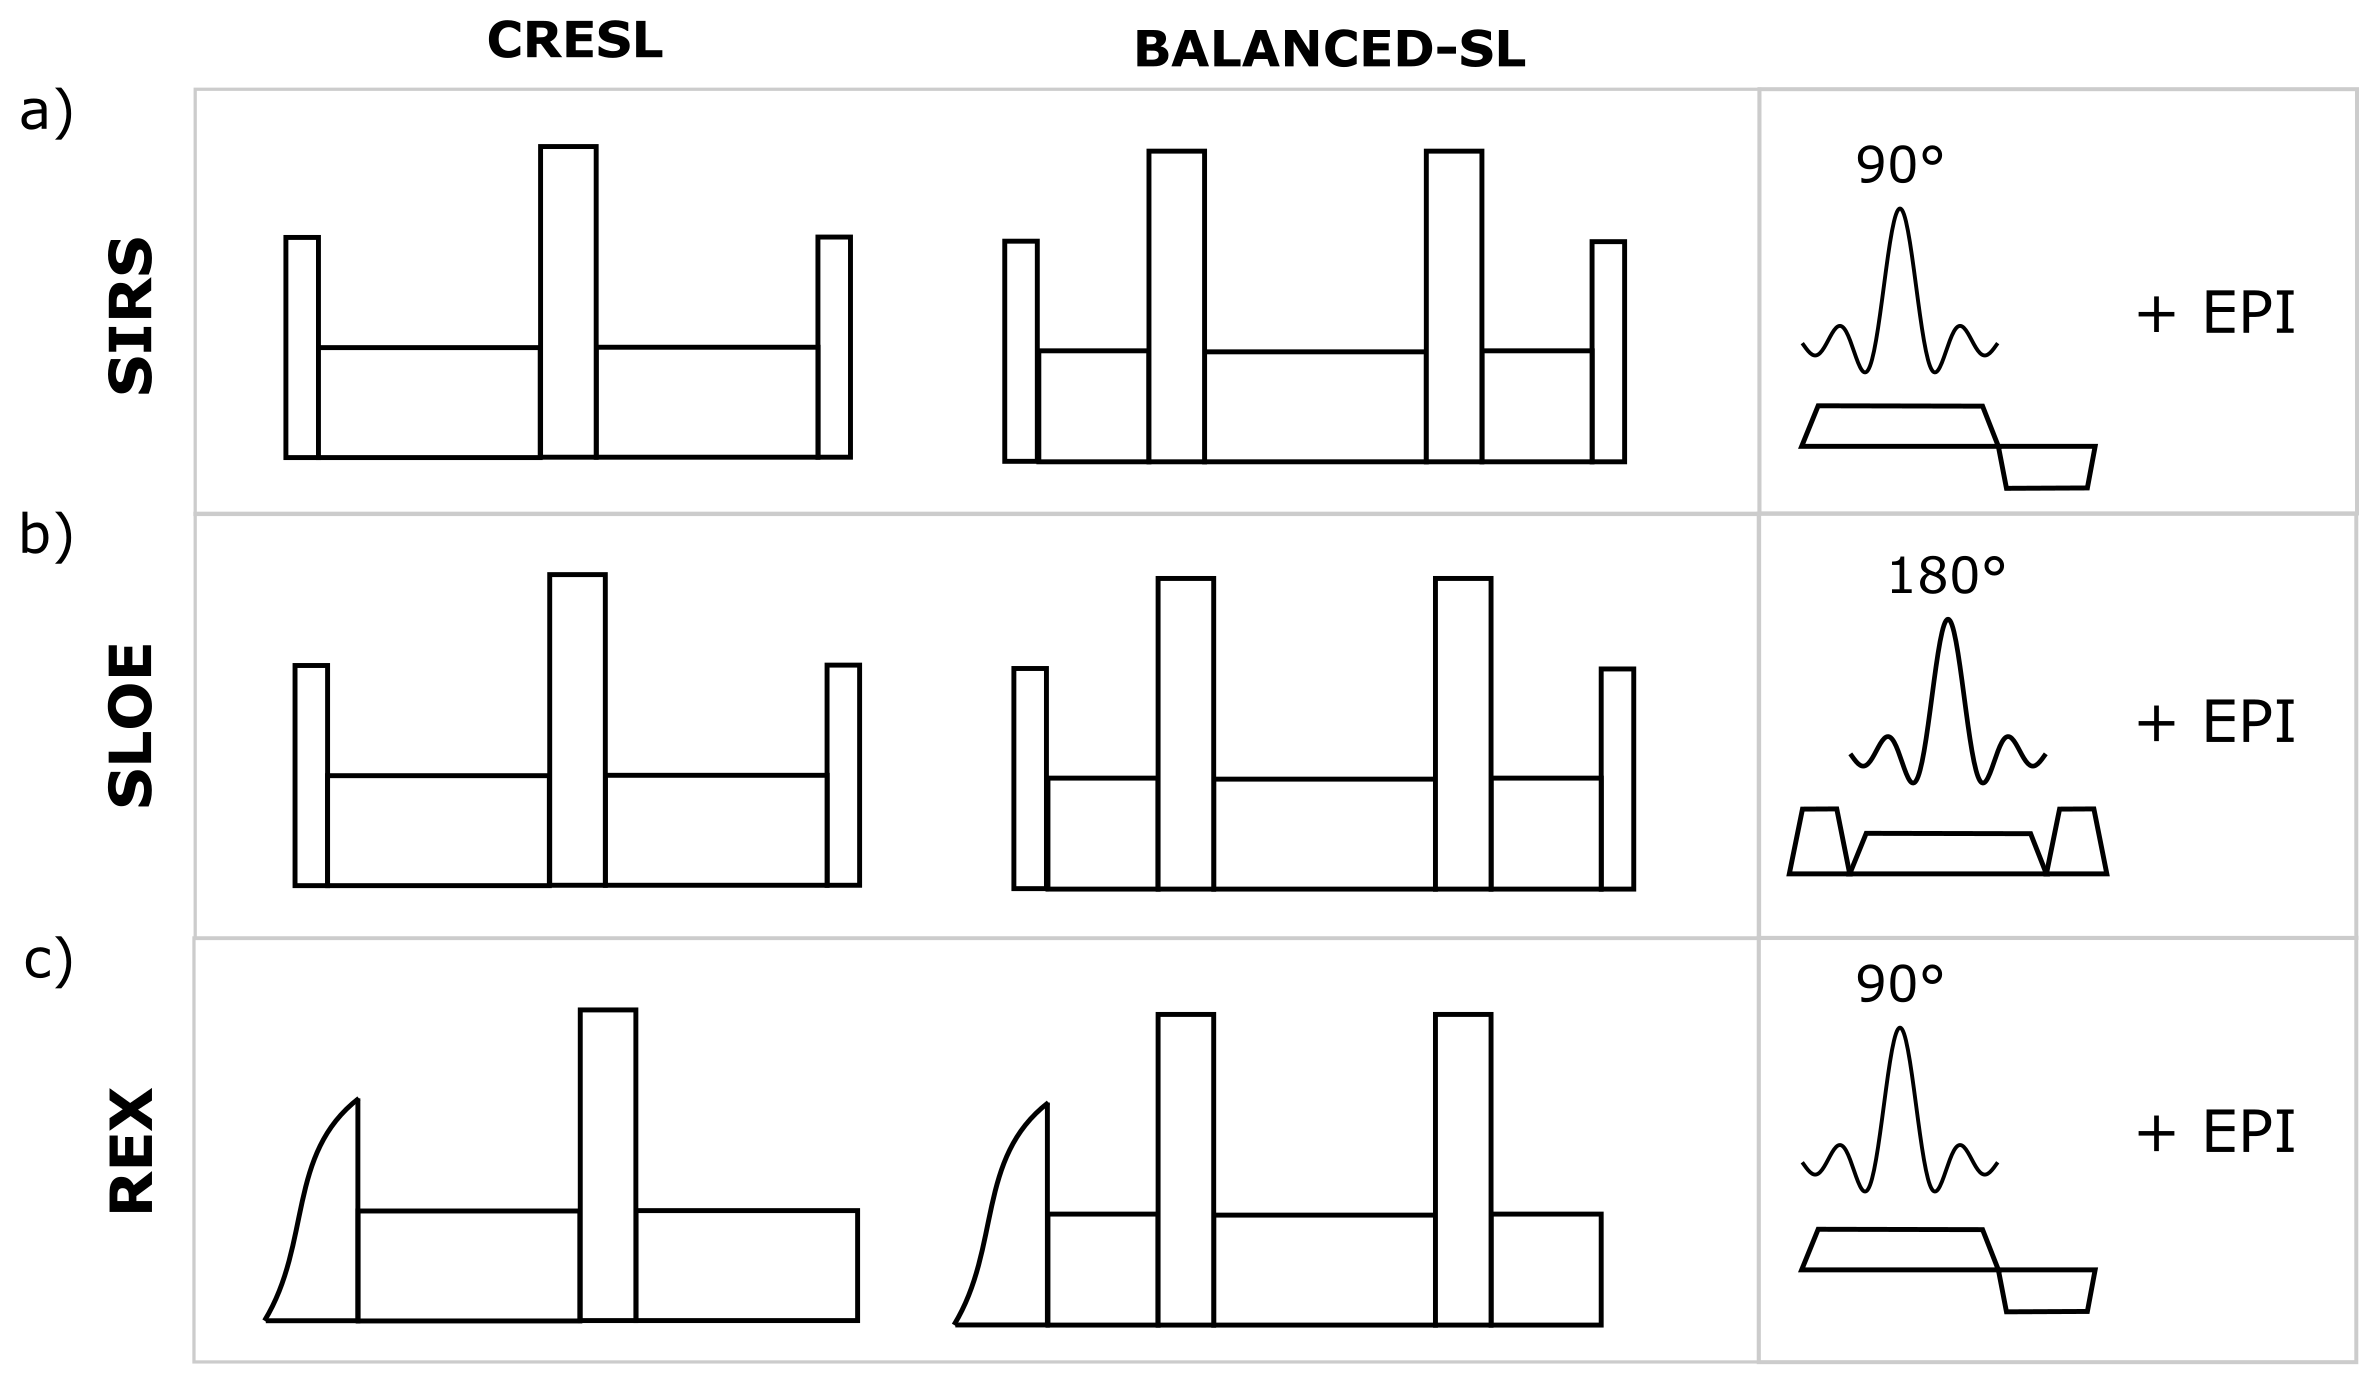
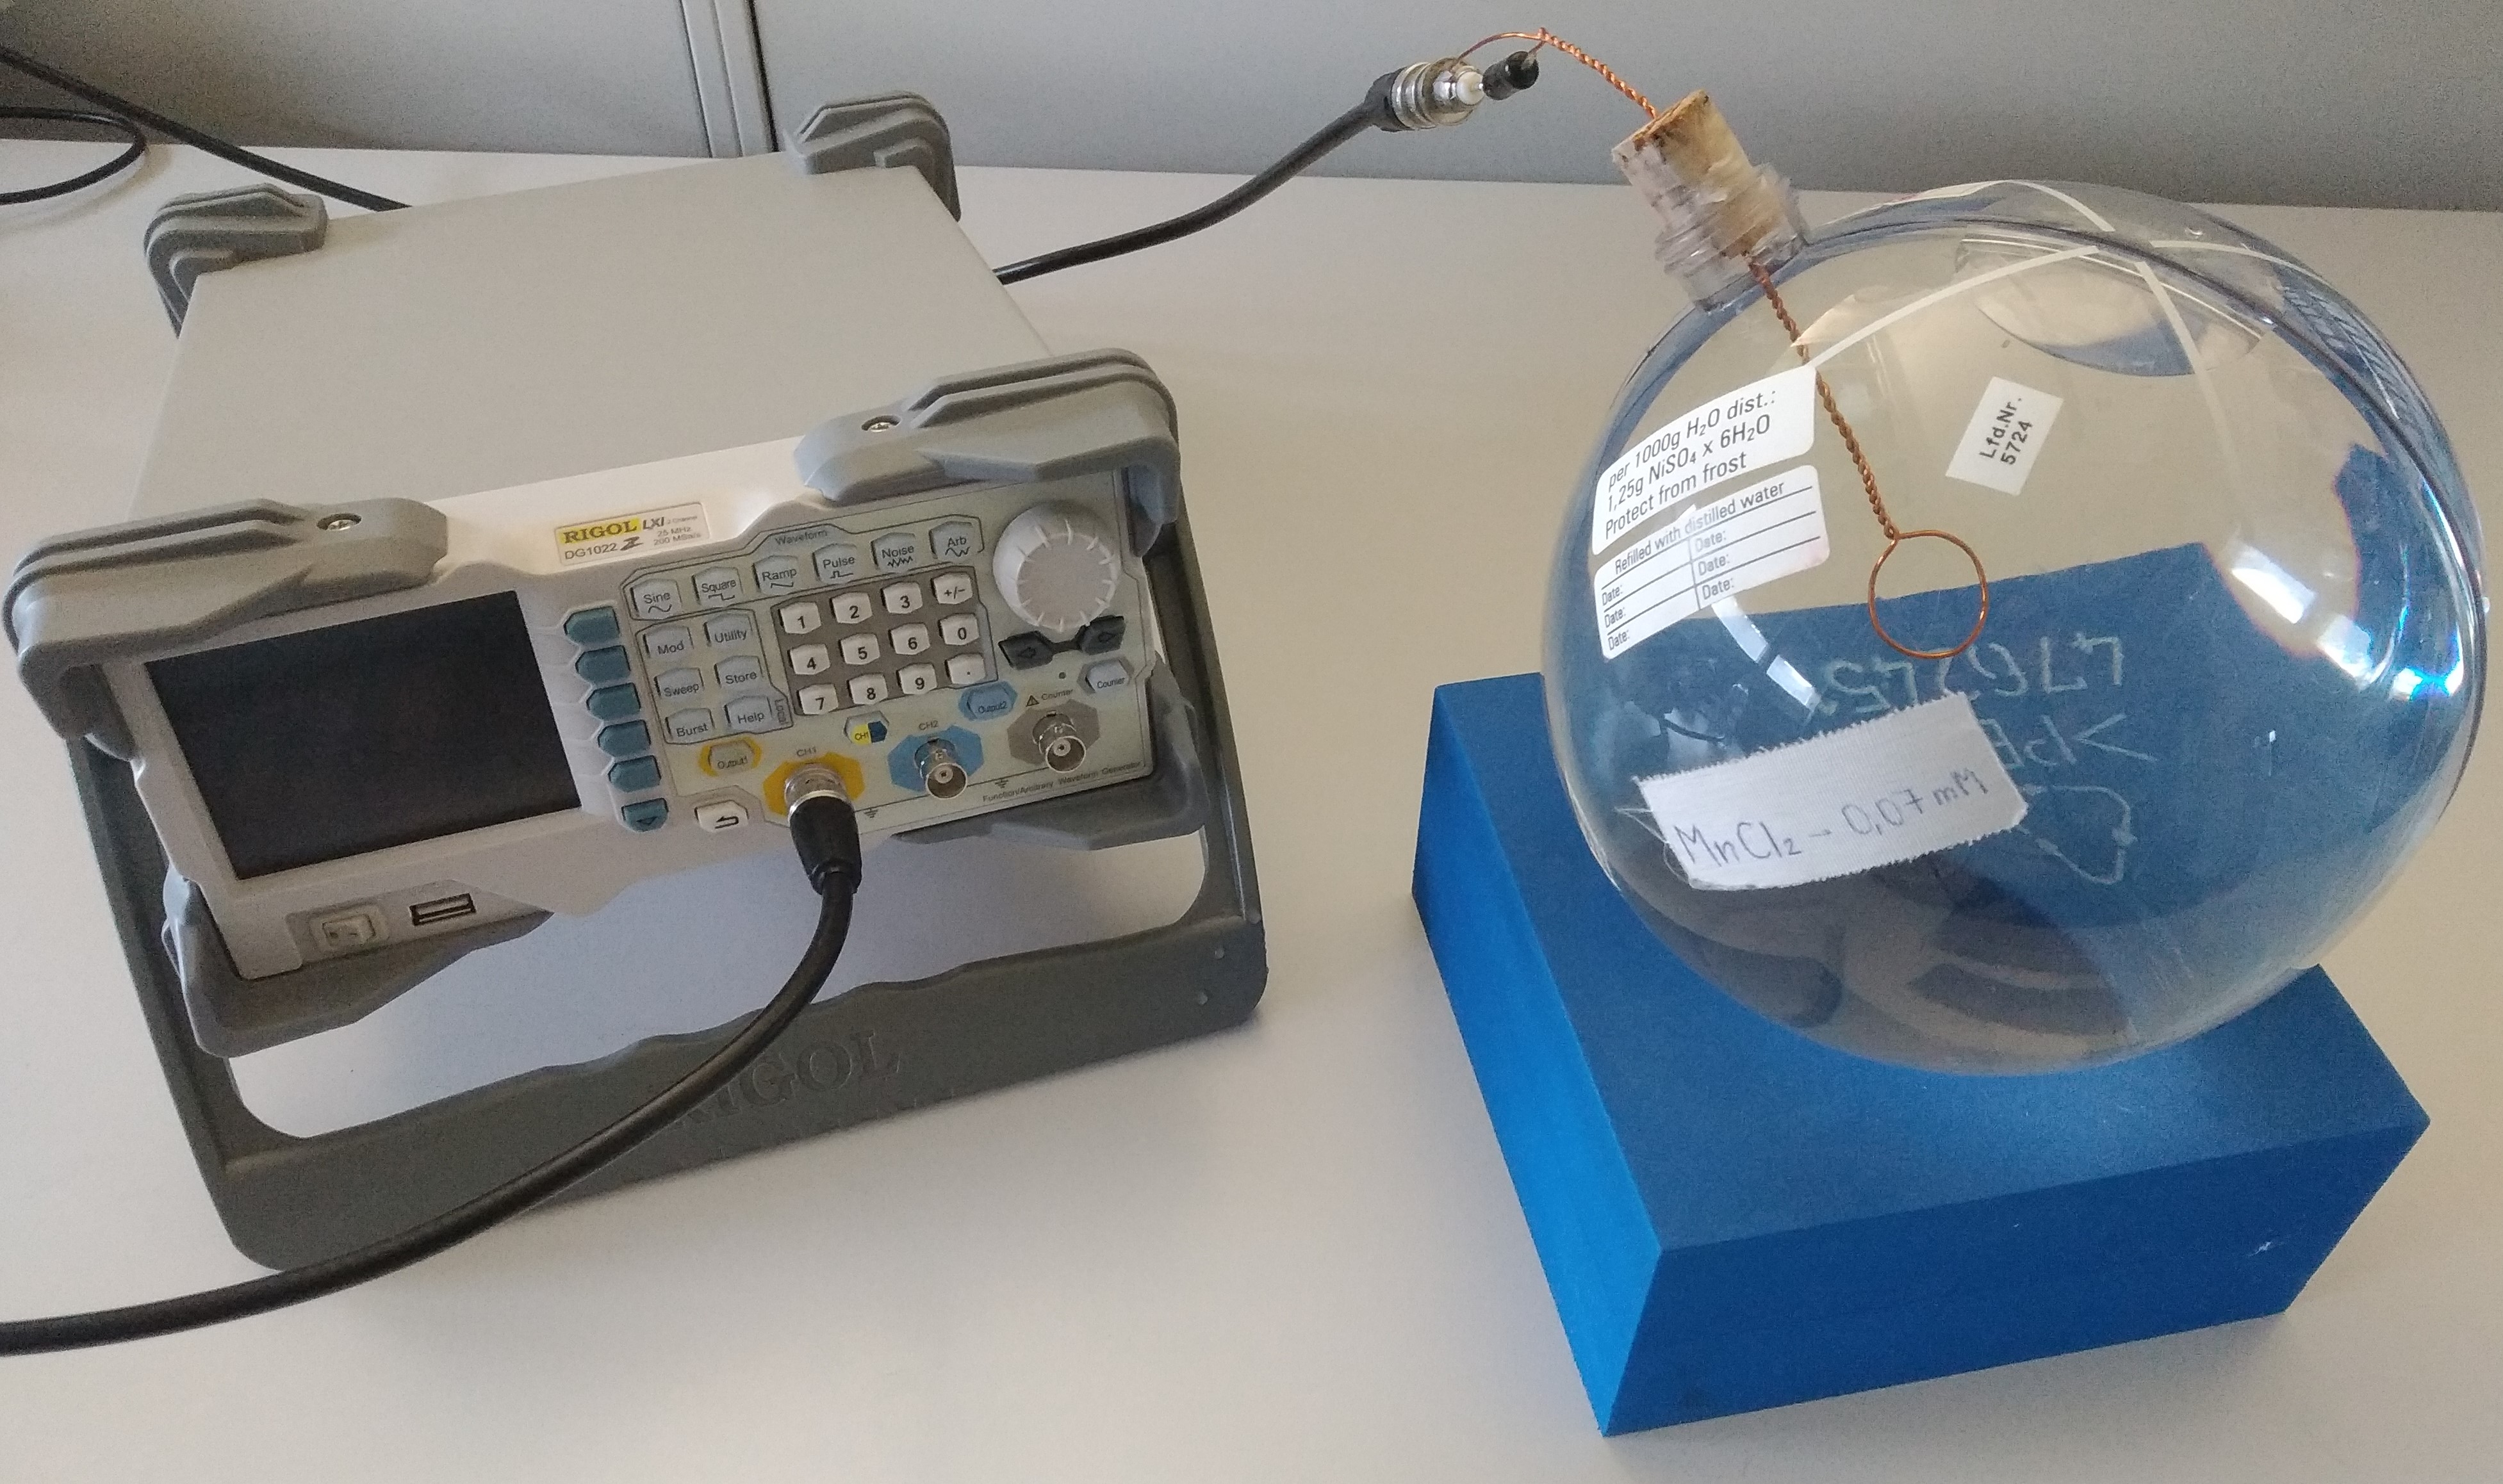
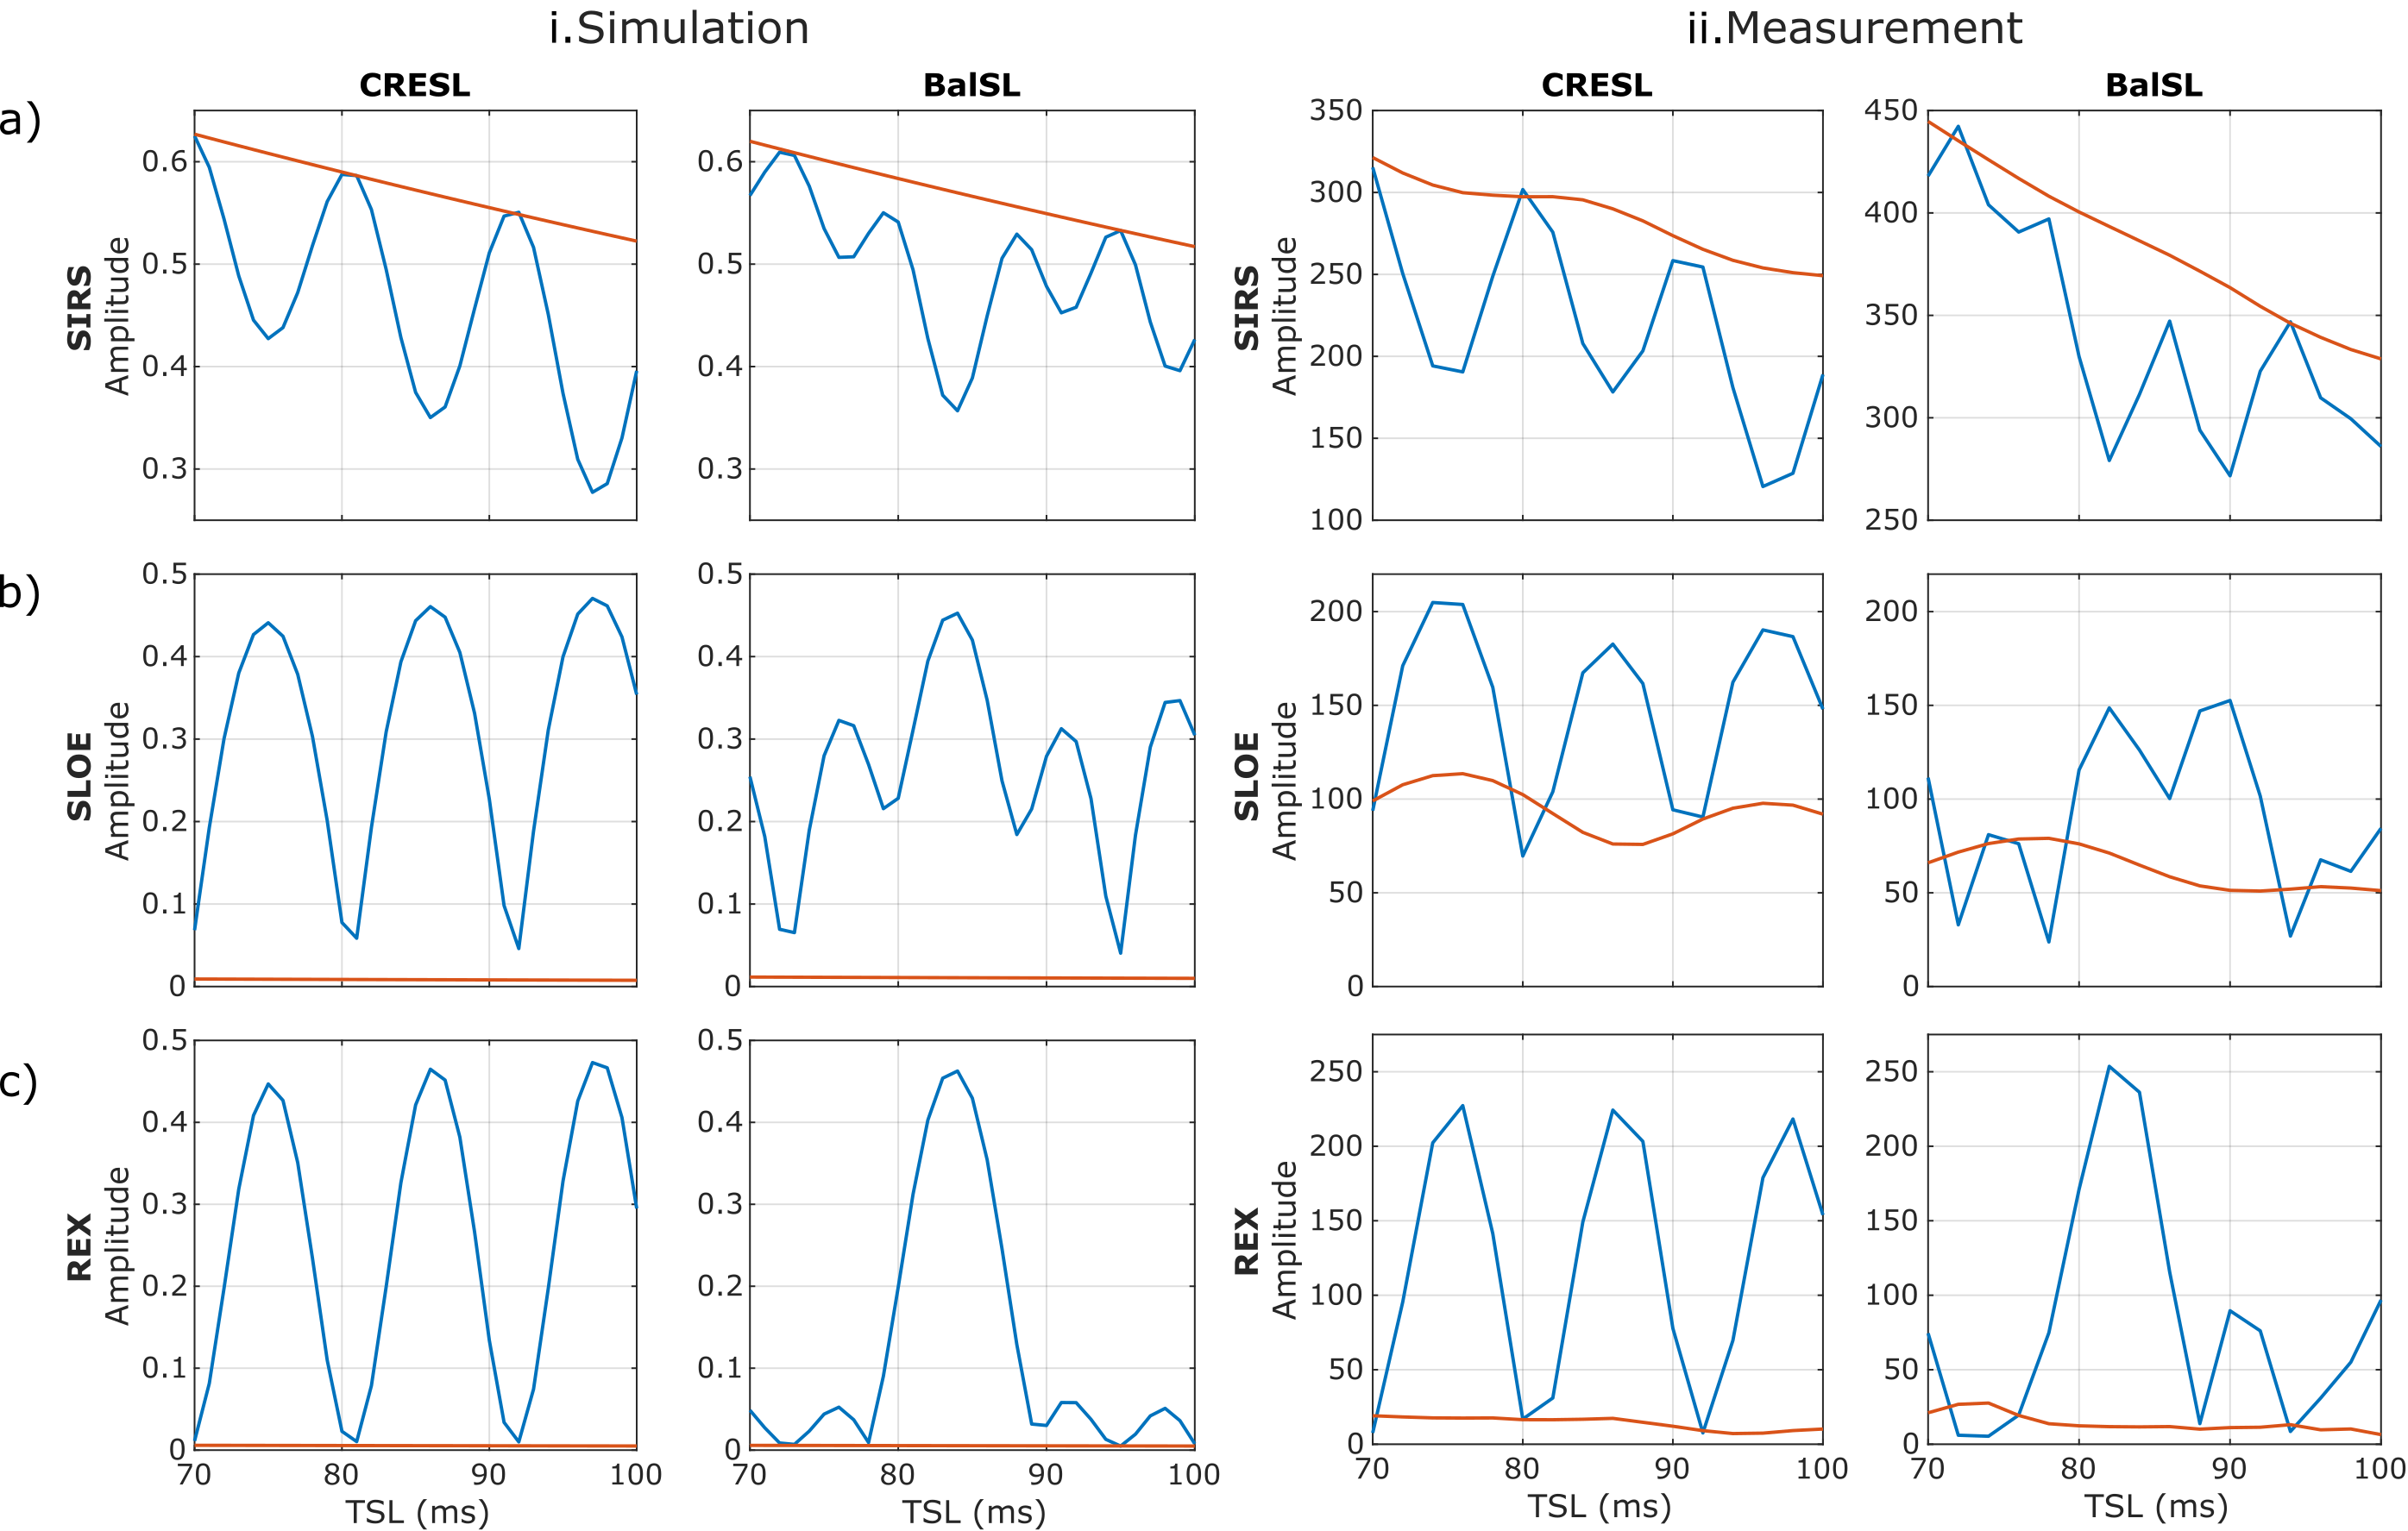
Figure 1.a. shows the three sequences along with the two SL variations used. In SIRS and SLOE, full CRESL and Balanced SL preparations are used, which are robust against B0 and B1 inhomogeneities. In REX, both preparations lack the last tip-up pulse as the contrast is already encoded on the z-axis after the long SL pulse. In this case, the preparations start with an adiabatic pulse to decrease the influence of B1 inhomogeneities5. We implemented a numerical simulator of the Bloch equations that considers the six studied variants and simulated the contrast as a function of the spin-lock time (TSL) and the initial phase of the target field $$$ \phi $$$, in resonance condition (FSL = FBT). For this case, we considered a target field of 90 Hz and 75 nT. We studied the frequency selectivity by analyzing the contrast response when averaging in all the possible initial phases of the target oscillatory field. To validate the model used, we contrasted simulations with phantom measurements using a 3T whole-body scanner (Prisma, Siemens). The oscillating target fields were simulated with the electrical phantom and experimental setup shown in Figure 2.Results
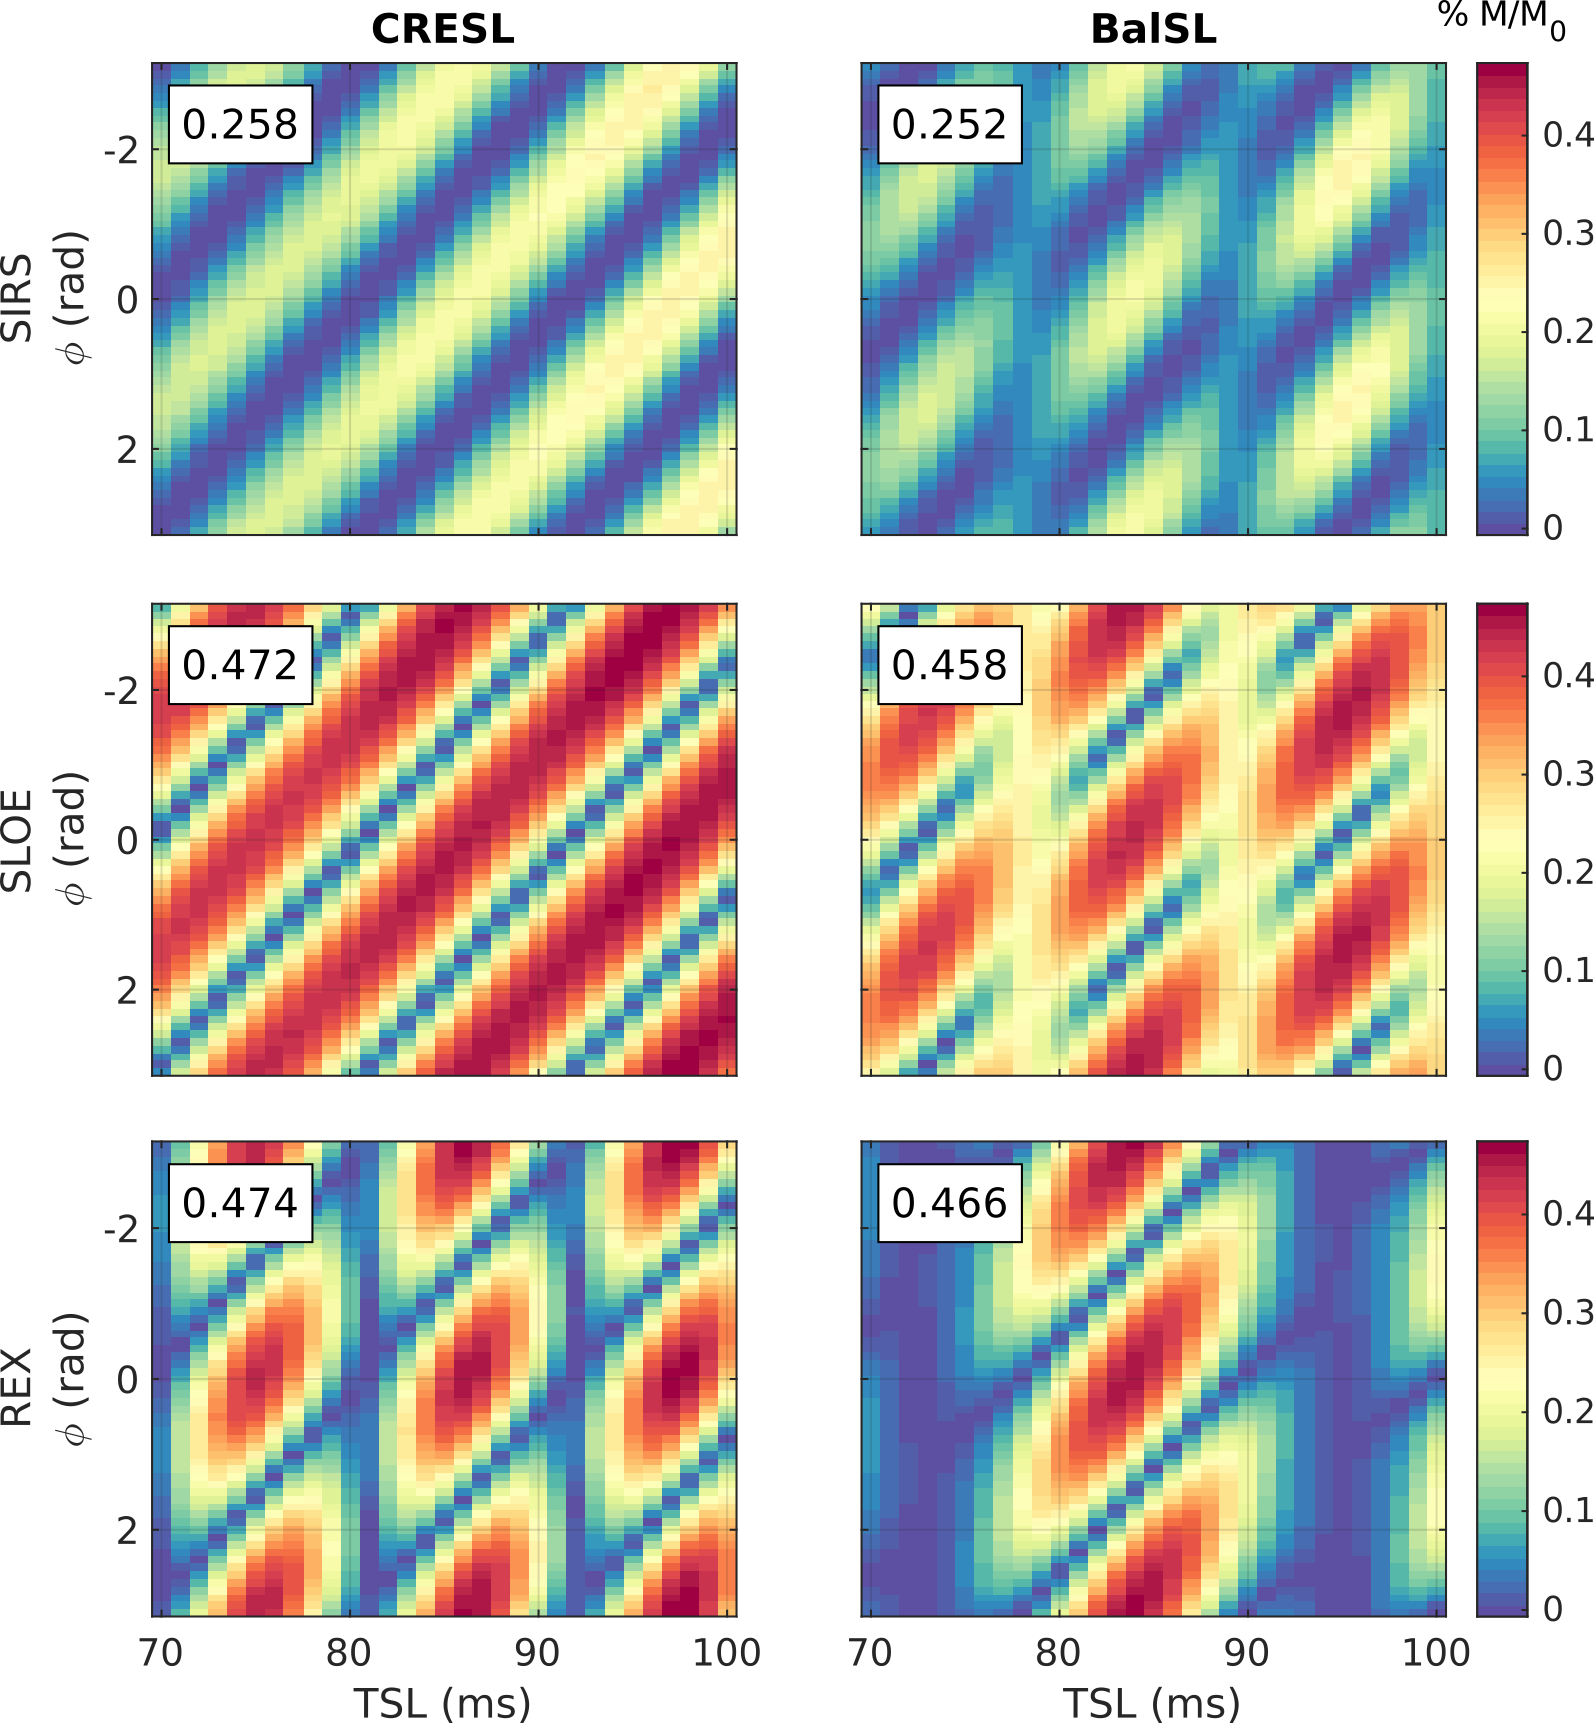
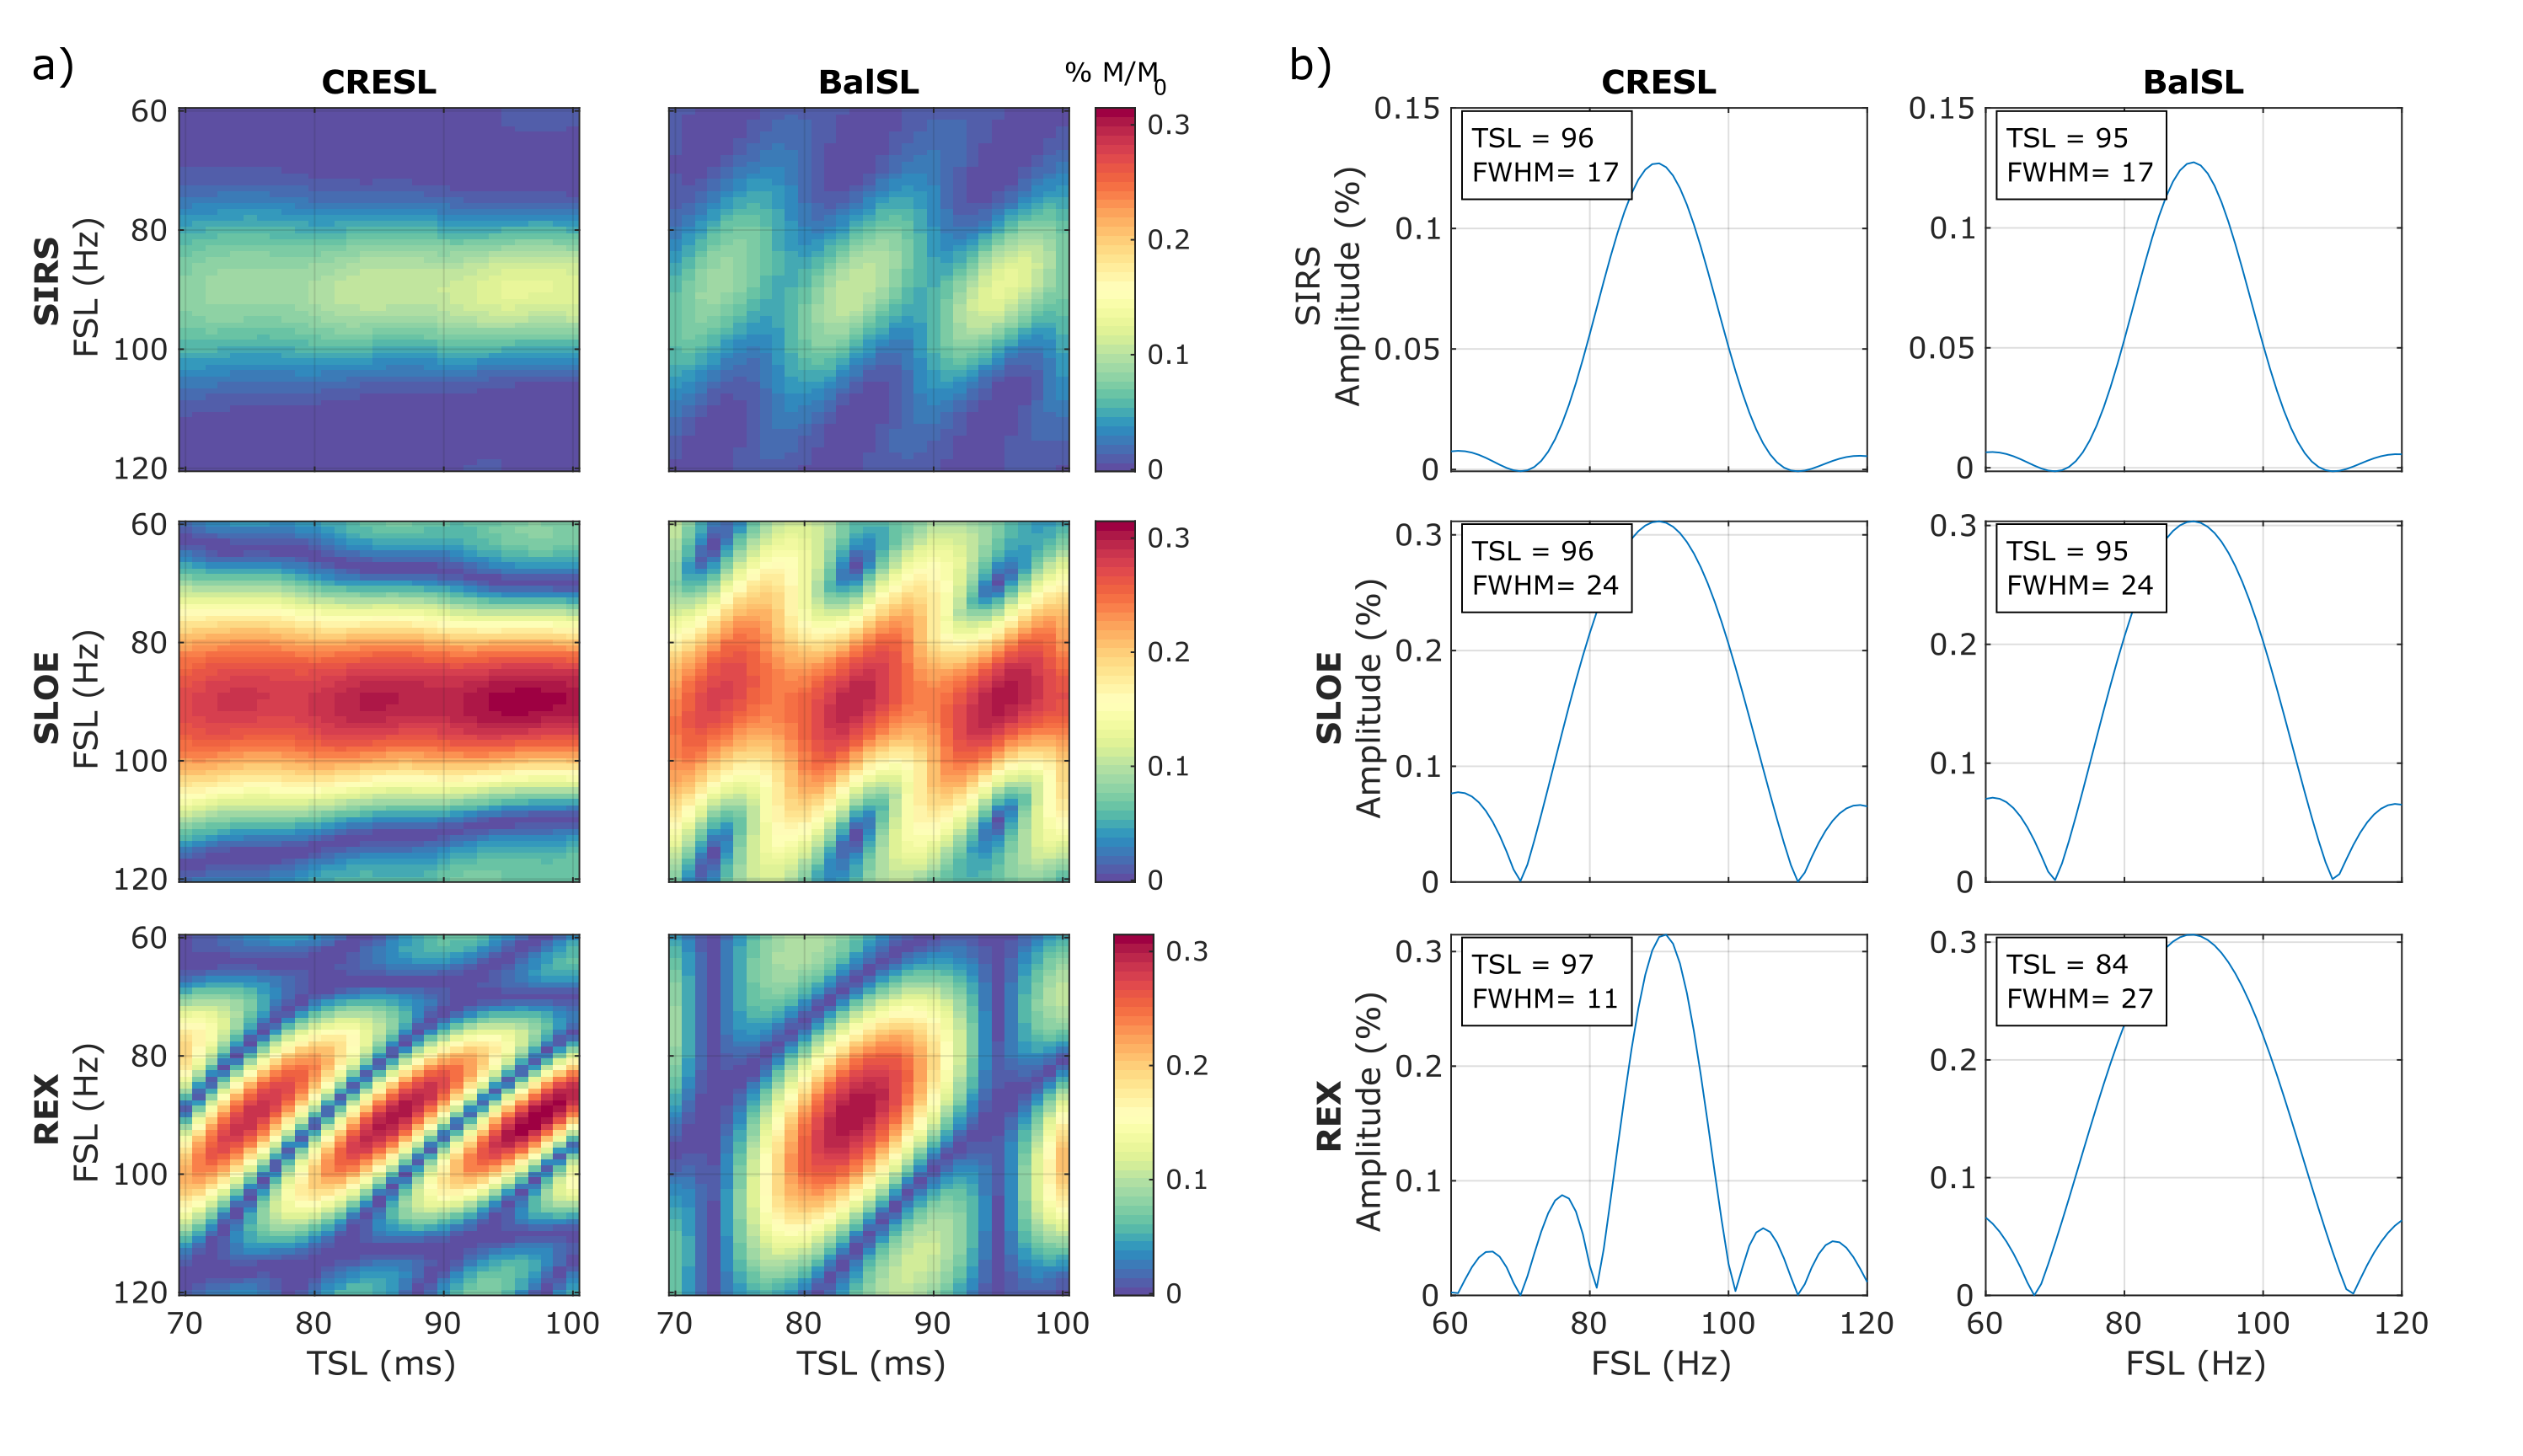
When in resonance condition (FSL = FBT = 90Hz in this case), the contrast varies as a function of the initial phase for each given TSL (Figure 3). Within SIRS and SLOE, CRESL has an oscillatory behavior, and the contrast increases with TSL. Within REX, CRESL presents values of TSL without contrast. Bal presents this behavior in the three sequences, with the TSL dependence being the strongest within the REX sequence. This requires choosing the correct TSL to maximize contrast within this option, in agreement with previous results5. However, when choosing the correct timing, both SLOE and REX outperform SIRS in terms of maximum contrast.To assess the selectivity of the sequences to be used as frequency filters, we simulated the contrast for a 90 Hz target field as a function of FSL and TSL as shown in Figure 4.a. The CRESL contrast is symmetrical with respect to the target frequency in SIRS and SLOE, with selectivity increasing with TSL, as previously shown in a previous study2. For the other four cases, bandwidth is highly dependent on the choice of TSL. The contrast amplitude as a function of FSL for the TSL that maximizes the contrast in each case is shown in Figure 4.b. The bandwidth of the filter is calculated as the full width at half maximum of each curve. For the correct TSL value, CRESL within the REX sequence can achieve the highest selectivity.
The model used for the presented simulations2 was validated by measuring the contrast as a function of TSL with initial phase $$$\phi = 0$$$ for each analyzed paradigm, as shown in Figure 5. The model correctly represents the qualitative behavior of each preparation. The discrepancy between the simulated and measured contrast is bigger in the SLOE case. This is likely due to imperfections in the 180° excitation pulse, and the use of adiabatic refocusing pulses should be considered for future applications.
Conclusions
We characterize the contrast of different SL techniques for the detection of oscillatory magnetic fields and their dependence on the SL duration and the initial phase of the target field. We analyze the frequency selectivity of each sequence and show that CRESL within the REX sequence exhibits the highest selectivity when in its maximum contrast. Given the high dependence of contrast on acquisition parameters and target frequency, each experiment must be custom designed to achieve optimal contrast. The characterization given in this work can be used as a basis for designing the appropriate sequence for future clinical studies.Acknowledgements
This project is funded by the Swiss National Science Foundation project “Predict and Monitor Epilepsy After a First Seizure: The Swiss-First Study (SNSF, CRSII5-180365), the Schweizerische Epilepsiestiftung and the Bernese Kernen Foundation.References
1. Witzel, Thomas, et al. "Stimulus-induced Rotary Saturation (SIRS): a potential method for the detection of neuronal currents with MRI." Neuroimage 42.4 (2008): 1357-1365.
2. Capiglioni, Milena, et al. "Analysis of the robustness and dynamics of spin-locking preparations for the detection of oscillatory magnetic fields." Scientific reports 12.1 (2022): 1-104.
3. Chai, Yuhui, et al. "Direct detection of optogenetically evoked oscillatory neuronal electrical activity in rats using SLOE sequence." NeuroImage 125 (2016): 533-543.
4. Truong, Trong‐Kha, et al. "Toward direct MRI of neuro‐electro‐magnetic oscillations in the human brain." Magnetic resonance in medicine 81.6 (2019): 3462-3475.
5. Gram, Maximilian, et al. “Towards robust in vivo quantification of oscillating biomagnetic fields using Rotary Excitation based MRI.” Sci Rep 12, 15375 (2022).
6. Witschey, W. R. T. et al. Artifacts in T1ρ-weighted imaging: Compensation for B1 and B0 field imperfections. J. Magn. Reson. 186, 75–85 (2007).
7. Gram, Maximilian, et al. "Balanced spin‐lock preparation for B1‐insensitive and B0‐insensitive quantification of the rotating frame relaxation time T1ρ." Magnetic Resonance in Medicine 85.5 (2021): 2771-2780.
Figures