4898
Repeatability of R1, R2* and fat fraction in Human Lumbar Vertebrae using a simultaneous multi-relaxation-time Imaging (TXI) method1Department of Radiology, Zigong First People's Hospital, Zigong, China, 2MR Scientific Marketing, Siemens Healthineers, Shanghai, China, 3Shanghai Key Laboratory of Magnetic Resonance, East China Normal University, Shanghai, China
Synopsis
Keywords: Multi-Contrast, Multi-Contrast
The quantitative MRI mapping techniques showed great potential in evaluating intervertebral disc degeneration (IVD) and diagnosing lower back pain. The repeatability of the quantitative methods is very important for clinical evaluation. A simultaneous multi-relaxation-time mapping (TXI) method was evaluated here, which can quantify the bone marrow fat fraction (BMFF), R2* and R1 value by a single scan and fast speed. The quantitative parameters of TXI showed high repeatability with high consistency and low CoVs, and could be applied in future clinical applications of IVD degeneration disease.Introduction
Lower back pain (LBP) is a common health problem which is related to intervertebral disc (IVD) degeneration1. MRI is a useful tool to characterize IVD degeneration due to its excellent spinal soft-tissue contrast, and MRI quantitative methods could provide specific biochemical information. T2* mapping allows assessment of the tissue composition of the IVD by reflecting information regarding the spatial architecture of the macromolecules and the mobility of water molecules2, and is correlated with functional lumbar mechanics3. T1 mapping has been widely used in cartilage degeneration4 , which is related to the water content5. Additional studies have confirmed the associations between bone marrow fat fraction (BMFF) and T1ρ/T2 mapping in the adjacent IVD, which suggested that the conversion of hematopoietic bone marrow to fatty bone marrow impairs the nutrients supply to cells in the IVD and may thereby accelerate disc degeneration6. Although these quantitative methods showed great clinical values, it need independent scans and the joint analysis of multiple parameters may potentially suffer from data mismatch problem due to motion between acquisitions and difference of imaging parameters. To facilitate the usage of multiple quantitative methods, a simulTaneous multi-relaXation-time Imaging technique, called TXI, was used to simultaneously acquired BMFF, R2* and R1 within a single scan, and its acquisition time was 1:50 min for IVD. This study aims to evaluate the test–retest repeatability of this simultaneous method in IVD of healthy subjects.Materials and Methods:
MR imaging: Six healthy subjects were recruited and underwent MR imaging on a 3T MR scanner (MAGNETOM VIDA, Siemens Healthcare, Erlangen, Germany). The TXI acquisition contains two 3D-multi-TE-GRE scans with two different flip angles (4˚,22˚) and an additional B1 mapping scan. The imaging parameters for 3D-multi-TE-GRE were as follows: TR = 12.4 ms, TE1/TE6/𝜟TE = 1.07/10.12/1.81ms, FOV = 380 × 336 mm2, matrix = 224 ×177, slice thickness = 3.5 mm, slice number = 24, total time 50 seconds for each scan. The B1 map sequence was acquired with following parameters: TR= 4350 ms, TE = 1.97 ms, FOV = 380 × 309 mm2, matrix = 64 × 64, slice thickness = 5 mm, total time 10 seconds. Subjects were scanned twice with an interval around 2 days.Quantification Algorithm: The TXI algorithm contains 4 steps: 1) water, fat signal and R2* map at 4˚ flip-angle were calculated by a T2*-IDEAL algorithm, based on a single R2* and 9-peak fat model, with the inhomogeneity magnetic field initialized by Spurs-gc algorithm7; 2) BMFF was calculated by dividing fat signal with total signal (fat+water); 3) The B1+ map was interpolated to the same image size of water signals; 4) water signals at 2 flip angles and the interpolated B1 map were then used to calculate T1 map using equation: S(FA) = water (FAb1) × sin(FA b1) × (1 – exp(-TR/T1) / (1 – cos(FAb1) × exp(-TR/T1)), where FAb1 was flip angle corrected by B1 map. The algorithm was implemented in Matlab 2018b and Python 3.5.
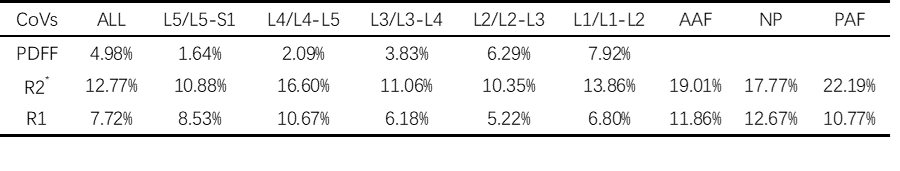
Image analysis: One region-of-interests (ROIs) were manually drawn covering the entire IVD to calculate the mean R2* and R1 value, and a second ROI covering entire vertebra were drawn to calculate BMFF. Three subregions in each of the lumbar IVD were drawn: the anterior 1/5 part representing the anterior annulus fibrosus (AAF), the medial 3/5 part representing NP, and the posterior 1/5 part representing the posterior annulus fibrosus (PAF) region.
Statistical Analysis: To assess the repeatability, a Bland–Altman analysis was performed, coefficients of variations (CoVs), and intraclass correlation coefficients were calculated. All analyses were done using SPSS software (version 25.0) and MedCalc (version 19.6.4).
Results
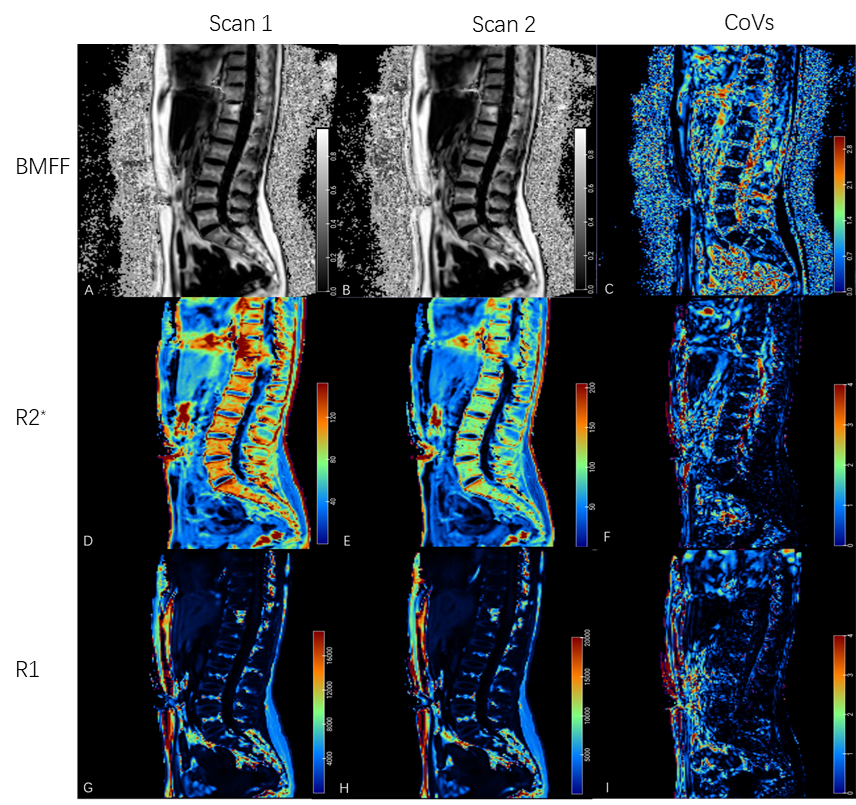
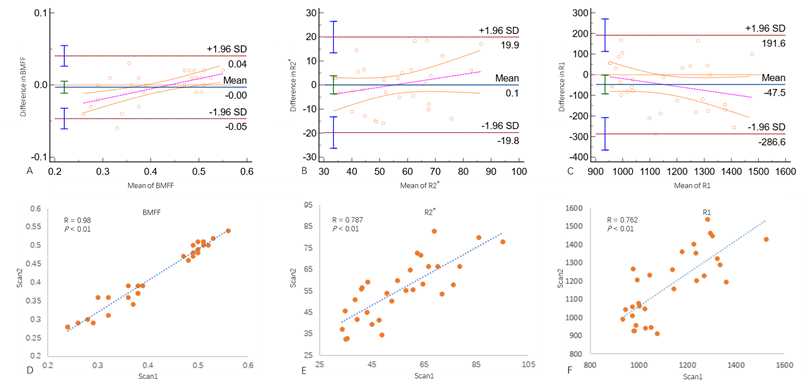
The BMFF, R2* and R1 maps from TXI method showed good image quality (Figure 1). The Bland–Altman plots and scatterplots for BMFF, R2* and R1 mapping are shown Figure 2, a bias of them were −0.005% (CI: −0.011 to 0.005), 0.05% (CI: -3.699 to 3.8617) and -47.5% ( CI: -93.067 to -1.965) and both scans showed a strong correlation (R>0.761, P<0.01). CoVs for PDFF, R2* and R1 were 4.98%, 12.77%, 7.72%, respectively (Table 1), and the intraclass correlation coefficients (ICCs) were 0.97(CI: 0.941 to 0.986),0.78(CI: 0.592 to 0.891), 0.73(CI: 0.496 to 0.863).Discussion
Acceptable CoVs and good consistency of BMFF, R2* and R1 mapping demonstrate the repeatability and accuracy of the TXI technique in quantification of IVD. For accurate fat quantification, the algorithm considers the effect of R2* and use the 9-peak model of fat components, which was reported to reflect the actual distribution of fat in the human body. Thus, a high repeatability of BMFF was achieved with small CoVs. For R1 mapping, a B1 filed was applied to correct spatial inhomogeneity of R1 maps, resulting in a good repeatability with CoVs 7.72%. The repeatability of R2* was lower than BMFF and R1. While Comparing comparing to previous study, the repeatability of BMFF and R2* were also better than those obtained by least square estimation-IQ8, which showed the potential value of TXI in body application.Conclusion
We evaluated the repeatability of simultaneous multi-relaxation-time imaging method and the result shows excellent performance in quantification of vertebrae, which is worthy of expectation.Acknowledgements
No acknowledgement found.References
1. Luoma K, Riihimaki H, Luukkonen R, et al. Low back pain in relation to lumbar disc degeneration. Spine. 2000;25:487-92.
2. Welsch H, Siegfried T, Tatjana P, al al. Parametric T2 and T2* mapping techniques to visualize intervertebral disc degeneration in patients with low back pain: Initial results on the clinical use of 3.0 Tesla MRI. Skeletal Radiol. 2011; 40(5):543-51.
3. Ellingson, M, MehtaH., Polly D, et al. Disc degeneration assessed by quantitative T2* (T2 Star) correlated with functional lumbar mechanics. Spine. 2013; 38:1533–1540.
4. Nebelung S, Björn S, Simon O, et al. Functional MR imaging mapping of human articular cartilage response to loading. Radiology. 2017; 282:464–474.
5. Shiguetomi M, Gottliebsen M, Kristiansen M, et al. Water-content calculation in growth plate and cartilage using MR T1-mapping design and validation of a new method in a porcine model. SkeletRadiol. 2013; 42:1413–1419.
6. Roland K, Gabrielle B, Misung H, et al. Associations between Vertebral Body Fat Fraction and Intervertebral Disc Biochemical Composition as assessed by Quantitative MRI. J Magn Reson Imaging. 2019; 50(4):1219-1226.
7. Dong J, Liu T, Chen F, et al. Simultaneous phase unwrapping and removal of chemical shift (SPURS) using graph cuts: application in quantitative susceptibility mapping. IEEE Trans Med Imaging. 2015; 34:531-540.
8. Ben S, Haiyan D, Qianzao L, el al. Repeatability and Image Quality of IDEAL-IQ in Human Lumbar Vertebrae for Fat and Iron Quantification across Acquisition Parameters. Comput Math Methods Med. 2022; 9:2022:2229.
Figures