4894
Characterizing the Temperature Dependence of T2 in Phantoms using an Ethylene Glycol Reference1Perspectum, Oxford, United Kingdom
Synopsis
Keywords: Relaxometry, Phantoms, Temperature
Phantom vials of varying T2 were calibrated as a function of temperature, where the temperature was measured via multi-echo gradient echo imaging of ethylene glycol in a phantom vial. The temperature calibrations were used to adjust T2 to a reference temperature, achieving T2 deviations to within [-3.2, 2.0] ms [-3.1%, 2.9%] on Siemens 3T (16.7ºC – 25.1ºC) and [-3.5, 1.4] ms [-3.4%, 0.8%] on GE 1.5T (16.5ºC – 23.7ºC). This demonstrates that corrections for T2 due to temperature can be performed while measuring temperature from gradient-echo imaging of ethylene glycol.Introduction
Cardiac T2 measurements across scanners are poorly characterized due to a lack of a standard calibration procedure. Phantoms can be employed to reproducibly evaluate T2; however, temperature fluctuations in the phantom add uncertainty to T2 characterization1,2. Temperature can be measured via the chemical shift between the OH and CH2 peaks in ethylene glycol3–5. Here, we incorporated ethylene glycol vials in phantoms with vials of varying T2 to: (1) measure the temperature in the ethylene glycol vials via gradient-echo imaging; (2) use the temperature to perform calibrations of T2 vs. temperature; and (3) use the temperature coefficients from the T2 calibrations to correct the measured T2 discrepancies due to temperature. The objective is to employ phantoms to reproducibly evaluate T2 for cardiac applications across MRI scanners at varying temperatures.Methods
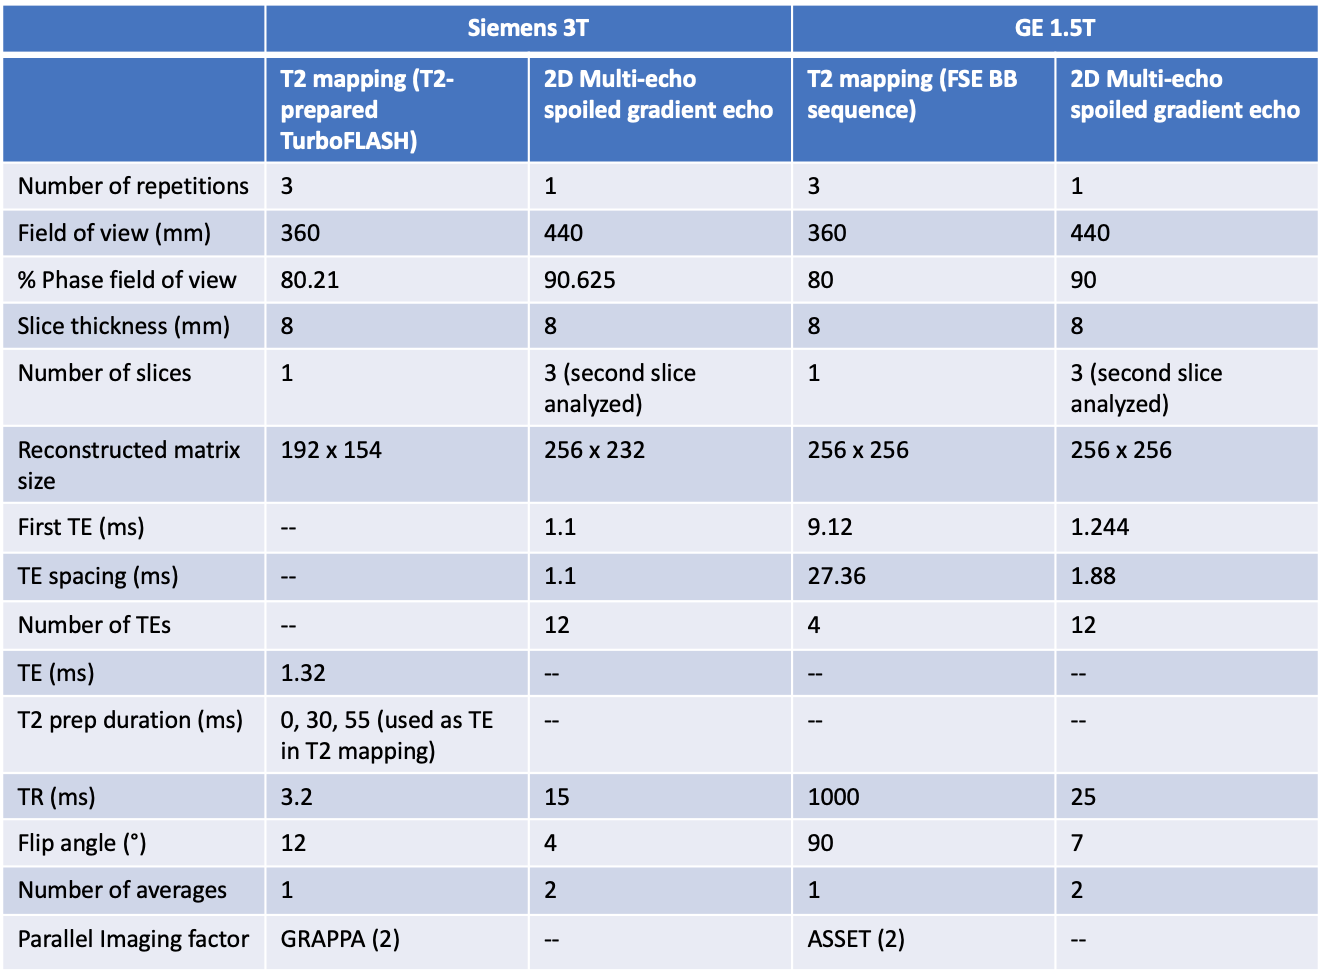
Two spherical phantoms, a calibration phantom and a testing phantom, each containing vials within a flood-filled housing, were scanned on a Siemens 3T Prisma and a GE 1.5T SIGNA Voyager. The calibration phantom and testing phantom contained five and eight agar-and-NiCl2-doped vials to vary the T2, respectively, and one ethylene glycol vial each for the temperature measurement. The phantoms were placed overnight in a fridge at ~10ºC prior to scanning. The phantoms were scanned with a T2 mapping sequence, and a multi-echo spoiled gradient-echo sequence for the ethylene glycol temperature measurement (Table 1). Subsequently, the phantoms were heated in a domestic microwave oven to elevate the temperature by ~2ºC. The phantoms were rested for 20 mins between heating and the T2 mapping acquisition to ensure an even heat distribution. The cycle of heating, resting and scanning was repeated to achieve varying temperatures.Analysis was performed in MATLAB, using in-house code. For the T2 images, mono-exponential T2 fitting was performed pixel-by-pixel in the phantom images to create a T2 map. ROIs (diameter = 15 mm) covering each vial were drawn on the T2 map yielding a median T2 per ROI.
For the temperature measurement, an ROI (diameter = 15 mm) was drawn on the ethylene glycol vial to find the mean signal. This acquired signal was correlated against a dictionary of simulated signals of varying temperatures to determine the temperature of ethylene glycol. The frequency offset $$$\Delta f$$$ between the OH and CH2 peaks of ethylene glycol is given by $$$\Delta f=\frac{f_0(466.5-T)}{102.0\times 10^6}$$$, where f0 is the resonance frequency (Hz) and T is the temperature (kelvin)6. The simulated signals S were constructed via $$$S=\vert{e^{-\frac{TE}{T2}}(A_1+C\cdot A_2 e^{i2\pi \Delta fTE})}\vert$$$, where A1 and A2 are the amplitudes of the OH and CH2 peaks, TE is the echo time, and C is the CH2 amplitude due to differences in T2 or T1 weighting of the two peaks.
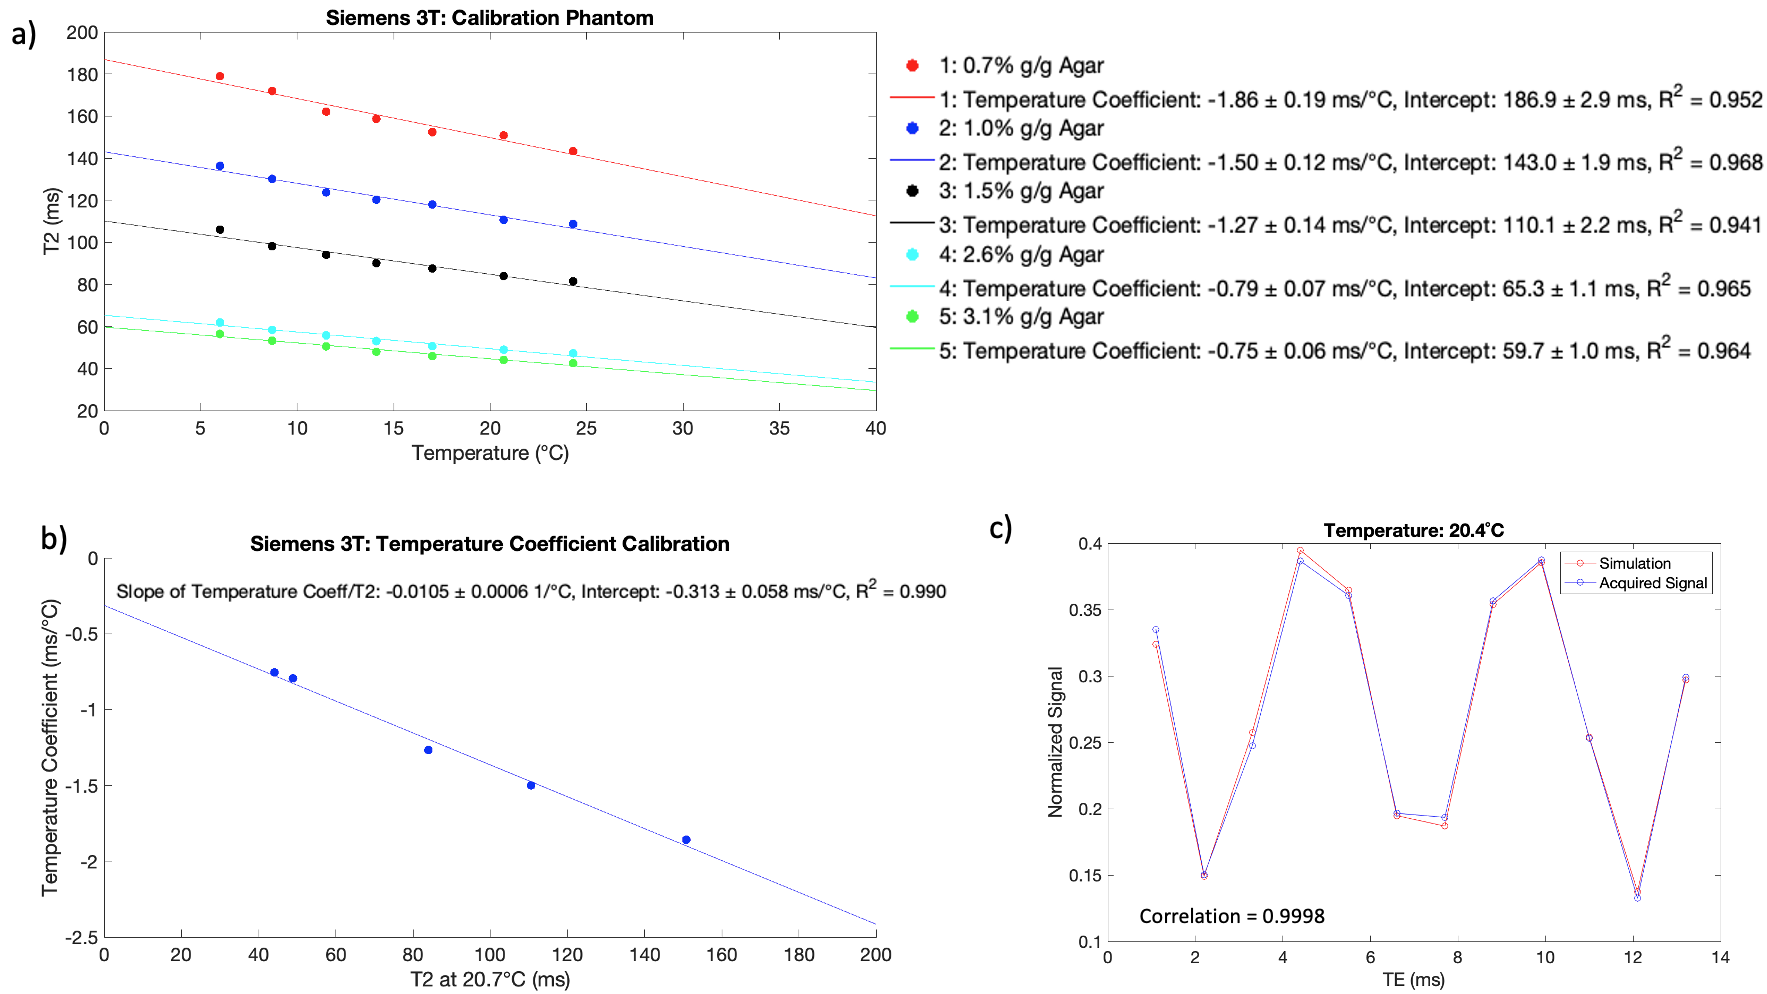
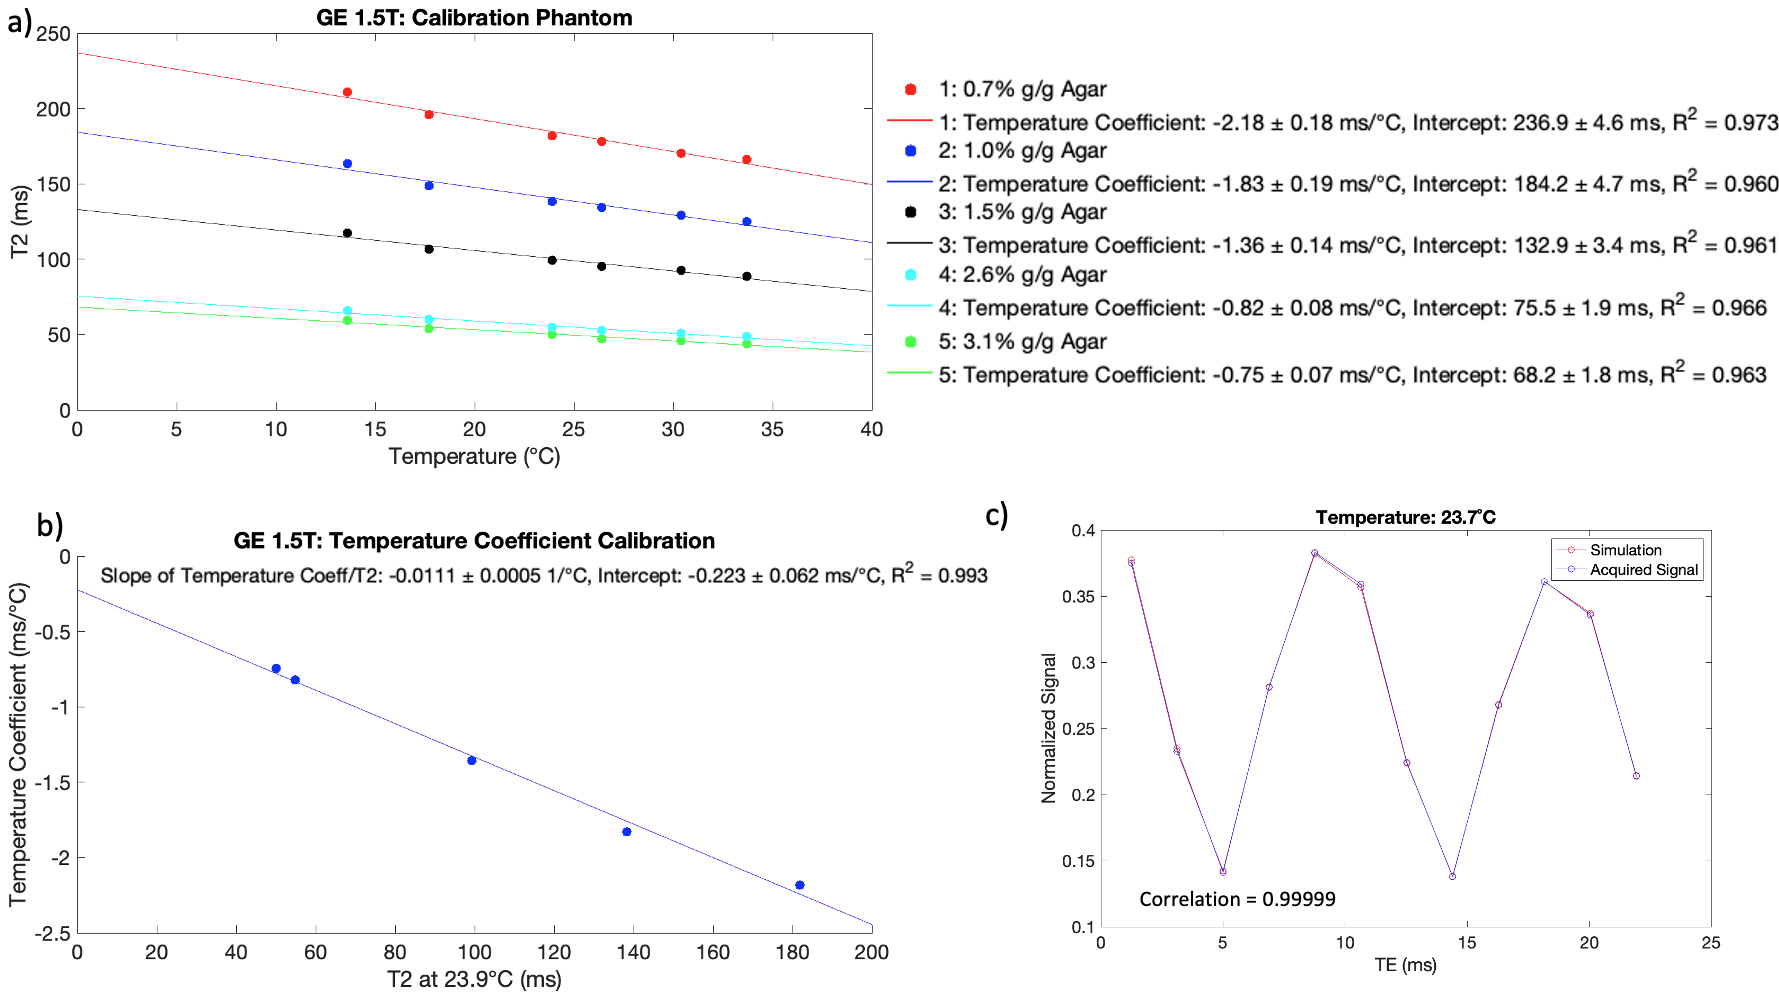
For each vial in the calibration phantom, the T2 was linearly calibrated against the ethylene glycol temperature. A reference temperature in the calibration phantom (20.7ºC at 3T and 23.9ºC at 1.5T) was chosen to match equivalent temperatures achieved by the testing phantom (20.4ºC at 3T and 23.7ºC at 1.5T) as closely as possible. The temperature coefficient was linearly calibrated against the T2 at the reference temperature in the calibration phantom to determine the slope of the temperature coefficient over T2. For each vial in the testing phantom, the temperature coefficient was calculated using the T2 at the equivalent temperature; the temperature coefficient was used to correct the T2 to a temperature of 21.1ºC.
Results and Discussion
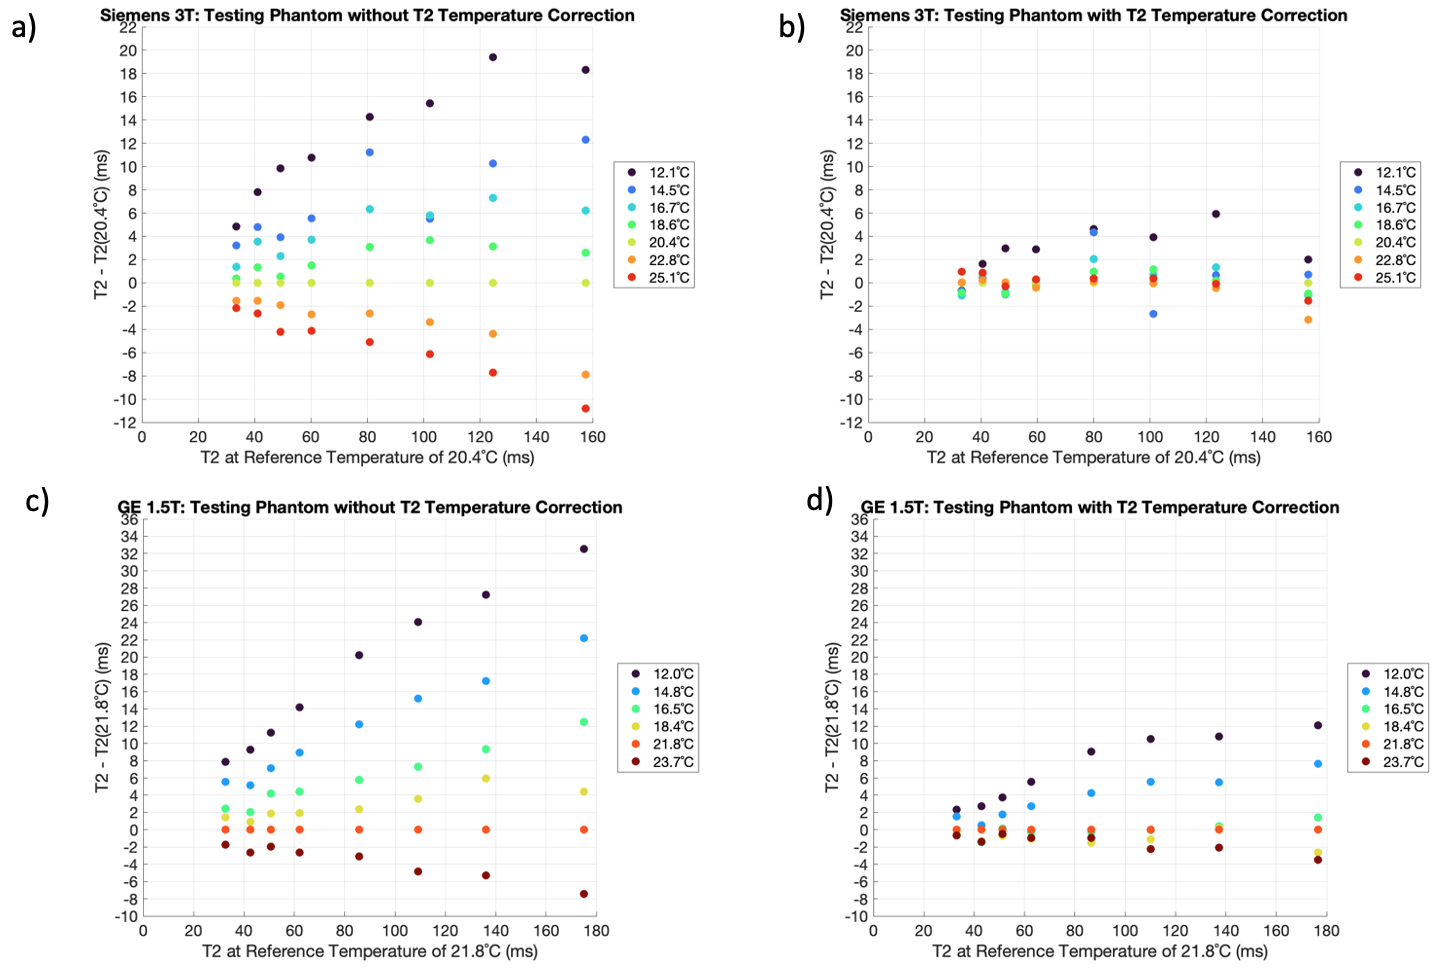
The T2 calibration produced temperature coefficients that decreased with increasing agar concentration (Figures 1a and 2a). The slopes of the temperature coefficient over T2 were -0.0105 ± 0.0006 1/ºC at 3T and -0.0111 ± 0.0005 1/ºC at 1.5T, respectively (Figures 1b and 2b). There was good correlation between the simulated and acquired ethylene glycol signals; correlations of 0.9998 at 20.4ºC at 3T and 0.99999 at 23.7ºC at 1.5T were found in the testing phantom (Figures 1c and 2c).Figure 3 shows the T2 values in the testing phantom without and with the temperature correction. At 3T, the T2 difference range was [-10.8, 7.3] ms ([-8.6%, 8.6%] in percent difference from the T2 at the reference temperature) without correction, and [-3.2, 2.0] ms [-3.1%, 2.9%] with correction, omitting temperatures of 12.1ºC and 14.5ºC. At 1.5T, the T2 difference range was [-7.4, 12.5] ms [-6.2%, 8.3%] without correction, and [-3.5, 1.4] ms [-3.4%, 0.8%] with correction, omitting temperatures of 12.0ºC and 14.8ºC. Hence, the correction reduced the discrepancies in T2 values due to varying temperature.
Currently, the temperature correction is reasonable for temperature ranges of 16.7ºC – 25.1ºC on Siemens 3T and 16.5ºC – 23.7ºC on GE 1.5T. The T2 deviations at the two lowest temperatures (12.1ºC and 14.5ºC at 3T, 12.0ºC and 14.8ºC at 1.5T) were acceptable, as phantoms are not expected to reach such temperatures in MRI scanner rooms. Further work will be performed to extend the calibration range, but the present approach is adequate for phantom calibrations, e.g. for cardiac applications.
Conclusion
Correction of T2 with MR temperature measurements of ethylene glycol at 3T and 1.5T reduced T2 deviations to within [-3.2, 2.0] ms [-3.1%, 2.9%] on Siemens 3T (16.7ºC – 25.1ºC) and [-3.5, 1.4] ms [-3.4%, 0.8%] on GE 1.5T (16.5ºC – 23.7ºC).Acknowledgements
No acknowledgement found.References
1. Nelson TR, Tung SM. Temperature Dependence of Proton Relaxation Times In Vitro. Vol 5.; 1987.
2. Hardy PA, Li X. Temperature Dependence of T1, T2 and T1rho in Agarose Phantoms. In: Joint AAPM Virtual Comp Meeting; 2020. Accessed November 6, 2022. https://virtual.aapm.org/aapm/2020/eposters/302983/peter.hardy.temperature.dependence.of.t1.t2.and.t1rho.in.agarose.phantoms.html?f=listing%3D3%2Abrowseby%3D8%2Asortby%3D2%2Amedia%3D3%2Aspeaker%3D788059%2Ace_id%3D1784%2Amarker%3D1133
3. Ambrosone L, Dïerrico G, Sartoriob R, Costantino L. Dynamic Properties of Aqueous Solutions of Ethylene Glycol Oligomers as Measured by the Pulsed Gradient Spin-Echo NMR Technique at 25°C.
4. van Geet AL. Calibration of the Methanol and Glycol Nuclear Magnetic Resonance Thermometers with a Static Thermistor Probe. Anal Chem. 1968;40(14).
5. Odéen H, Hofstetter L, Kim SE, Parker DL. High spatial and temporal resolution absolute temperature imaging of Ethylene Glycol. In: Proceedings of the International Society for Magnetic Resonance in Medicine; 2022:2171.
6. Ammann C, Meier P, Merbach AE. A Simple Multinuclear NMR Thermometer. Journal of Magnetic Resonance. 1982;46:319-321.
Figures