4893
Comparing Diagnostic Performance and Quality of NeuroMix (NM) to Routine Brain MRI Sequences1GE Healthcare, Boston, MA, United States, 2Department of Radiology, Beth Israel Deaconess Medical Center, Harvard Medical School, Boston, MA, United States, 3GE Healthcare, Stockholm, Sweden, 4Karolinska Institutet, Stockholm, Sweden, 5Karolinska University Hospital, Stockholm, Sweden
Synopsis
Keywords: Multi-Contrast, Brain
The focus of this study is to assess the diagnostic performance of NeuroMix, a single push-button, novel, fast multi-contrast MRI sequence, to that of routine brain scans that typically consist of multiple sequences. NeuroMix has the ability to provide several different contrasts in about 3.5 minutes with only one prescription and prescan. While the sequence has initially shown to be fast and motion-robust, more evaluation is needed across the various contrasts compared to gold standard, optimized sequences routinely used in the clinic. Here we present initial qualitative and quantitative comparisons between NeuroMix and routine scans across a variety of patients.Introduction
Recent developments in fast, multi-contrast MRI sequences have provided new opportunities in rapid neurological scanning1-3. For routine scanning, these sequences provide the necessary image contrasts for proper diagnosis in a short total scan time. One such recent development is NeuroMix (NM), which can provide T1-FLAIR/T2-FLAIR/T2*w/T2w/T1w/SWI/DWI/ADC images in ~3.5 minutes with full brain coverage1. NeuroMix is an enhancement of the EPI based EPIMix2, with inclusion of SSFSE for better T2 contrast, and additional contrasts1. However, there is still a need to evaluate NM in the clinical setting as has recently been done with EPIMix4-6. The goal of this study was to compare the qualitative and quantitative diagnostic performance of NM relative to routine clinical brain MRI protocols.Methods
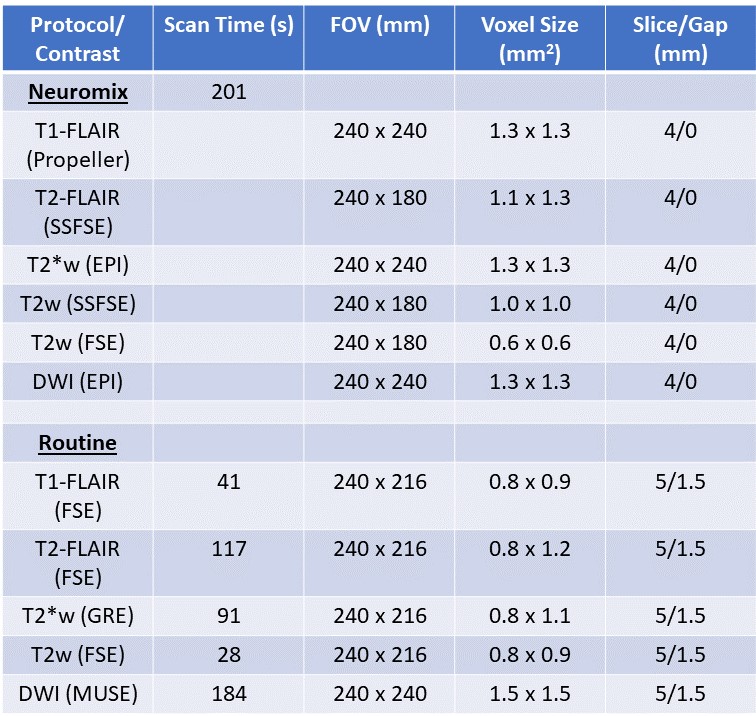
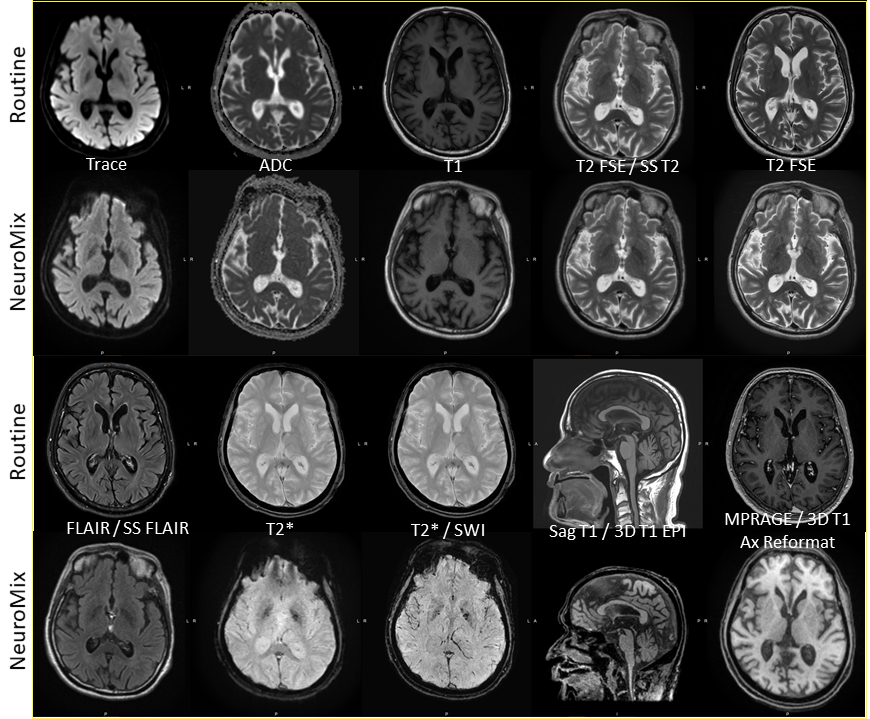
All exams were performed on a 3T Premier MR system (GE Healthcare, WI, USA). NM was included within routine brain protocols at Beth Israel Deaconess Hospital, which generally consisted of routine T1-FLAIR/T2-FLAIR/T2*w/T2w/DWI (and sometimes MPRAGE) sequences. For routine sequences, where possible, a commercial deep learning (DL) reconstruction was applied (AIR™ Recon DL, GE Healthcare)7. Figure 1 presents the acquisition parameters of NM versus the Routine Protocols. 39 patients clinically indicated for brain MRI were scanned between April 2022-September 2022, and retrospectively included in this study under an IRB approved protocol. The retrospective data was gathered without sub-grouping into different disease types (some example findings listed in Figure 1). NM imaging was performed prior to any contrast administration for all but 2 cases.Qualitative Assessment: 3 Readers (1 CAQ certified Neuroradiologist and 2 diagnostic radiology residents) were asked to assess the diagnostic confidence of Neuromix by comparison of image quality metrics to the routine MRI, which was considered the gold standard (see Figure 2). Each reader reviewed both the NM and routine precontrast images for visibility of the pathology (if present) on the exam, and scored them as equivalent, or required routine MRI to make diagnosis. Each of the relevant contrasts in each group (Neuromix and Routine) were rated on basis of three criteria after reviewing the NM and routine images:
1. Would the reader be comfortable replacing a noncontrast routine MRI Brain protocol with the set of NM images.
2. Would the reader be comfortable replacing a noncontrast routine MRI Brain sequence with the corresponding NM sequence. If yes, which ones.
3. Would the reader be comfortable reading a noncontrast NM sequence if the corresponding routine MRI Brain sequence was not available. If yes, which ones.
4. Is the major pathology from the study equivalently visible on NM and routine non contrast images.
Rating agreement was calculated using Fleiss’ Kappa.
Quantitative Assessment: The signal-to-noise ratio (SNR) and contrast-to-noise ratio (CNR) for the core NeuroMix contrasts was calculated according to the equations used in Magnotta et al.8 The CSF, white matter (WM), and gray matter (GM) were segmented on the T2w images via FSL FAST9 and applied to other contrasts. For DWI, the coefficient of variation (CV) in the apparent diffusion coefficient (ADC) map was calculated in a representative axial slice for both NeuroMix and routine protocols and compared via a t-test.
Results
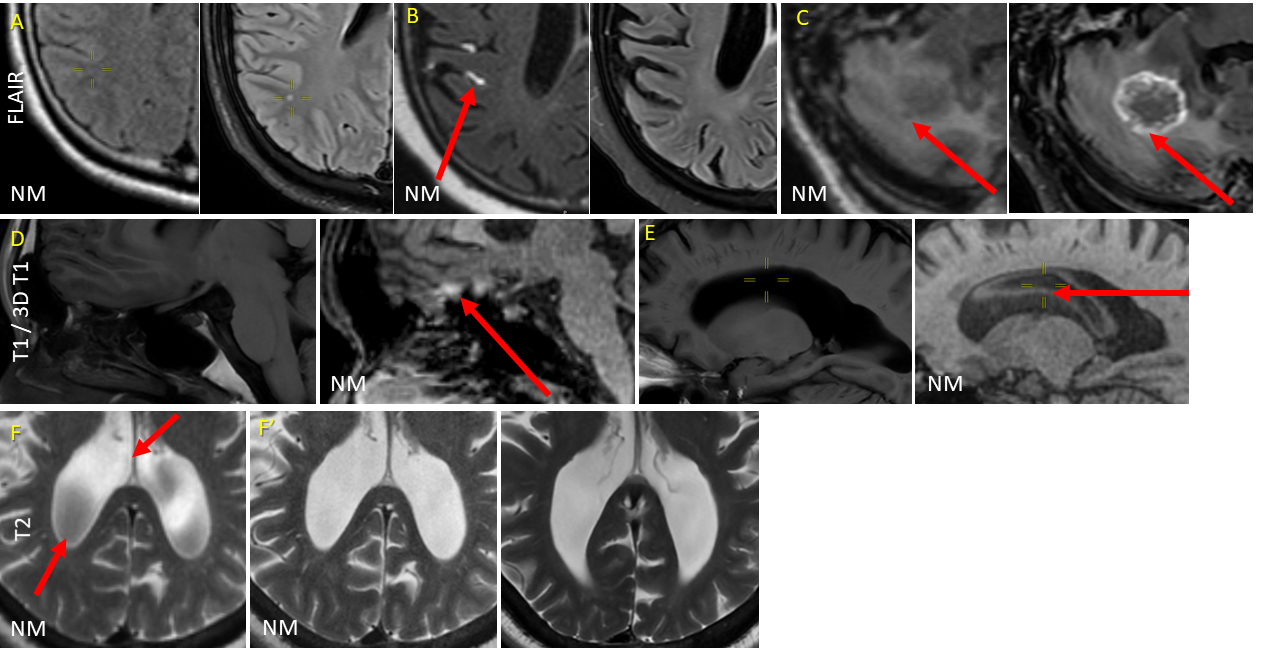
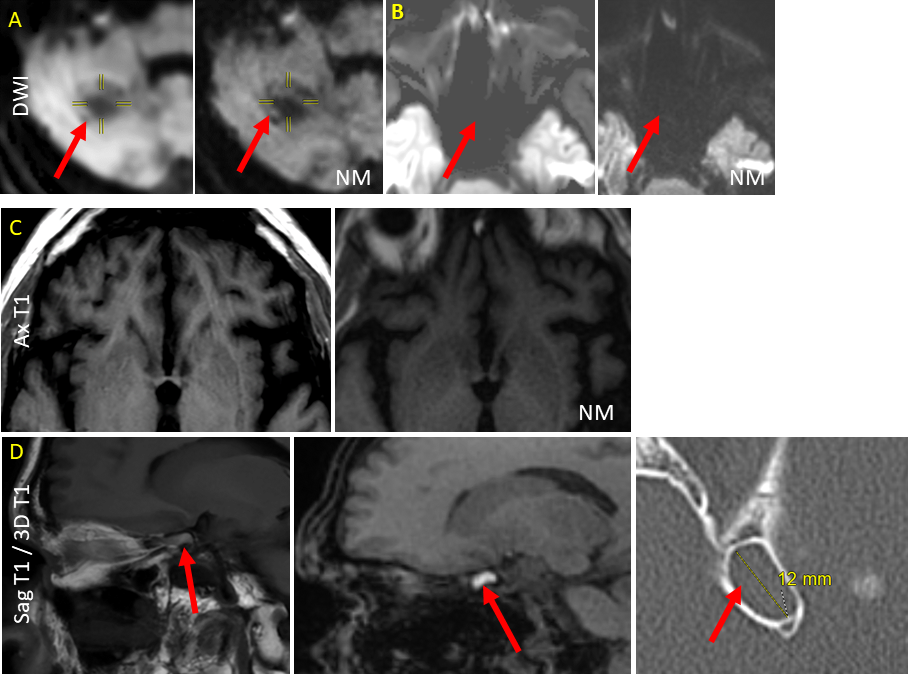
Qualitative: For question 1, all readers responded no. For question 2, all readers responded yes regarding substituting any of the NM sequences in place of the corresponding routine sequence. Regarding which sequence they would be comfortable substituting, all responded yes for DWI, all responded no for FLAIR, 3D T1 EPI, or T2*. There was limited agreement with regard to T1 (Kappa -0.5), T2 (Kappa -0.4), SS T2 (Kappa -.03) and SWI (Kappa -.02). See Figure 3 for some artifacts routinely encountered in NM sequences, and Figure 4 for examples where NM provided better images relative to routine MRI.For question 3, all 3 readers overall responded yes they would prefer reading some NM sequences if the alternative was to not have the corresponding routine sequences, with the exception of 1 reader for 2 cases (Kappa -.02). To which of the specific NM sequences for Q3, all readers responded yes for DWI/T2SSFSE/SWI. There was limited agreement regarding T1 (Kappa -0.09), T2, FLAIR (Kappa -0.2), 3D T1 (Kappa -0.1), and T2* (Kappa -0.09).
For question 4, all readers responded yes, the pathology visualized on the noncontrast brain images was visible in the corresponding NM series but 1 case.
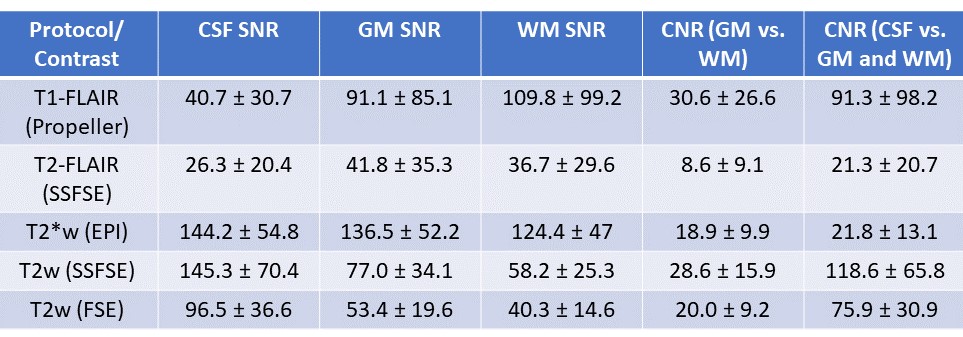
Quantitative: Figure 5 shows the calculated SNR and CNR for multiple NeuroMix contrasts. In all cases, the SNR and CNR was high enough to visualize the relevant anatomy. Furthermore, in the cases of FLAIR acquisitions, the GM and WM SNR was considerably higher than the CSF, indicating good nulling of the CSF. Additionally, there was no statistically significant difference between the CV in the Neuromix and routine ADC maps (p = 0.084).
Discussion
Qualitative analysis revealed both positives and some pitfalls of NeuroMix, while the quantitative analysis showed high enough SNR and CNR. These results indicate Neuromix as having the capability to be a backup sequence in case artifacts are present in routine sequences, or potentially a replacement for some contrasts altogether. These encouraging results warrant a continuation of the study, including increasing the cohort size and calculating SNR/CNR across the whole brain volume.Acknowledgements
No acknowledgement found.References
1. Sprenger et al. NeuroMix—A single-scan brain exam. Magn Reson Med. 2022:87:2178-2193.
2. Skare et al. “A 1-minute full brain MR exam using a multicontrast EPI sequence,” Magn Reson Med. 2018;79:3045-3054.
3. Clifford et al. “An artificial intelligence-accelerated 2-minute multi-shot echo planar imaging protocol for comprehensive high-quality clinical brain imaging,” Magn Reson Med. 2022;87:2453–2463.
4. Delgado et al. “Diagnostic performance of a new multicontrast one-minute full brain exam (EPIMix) in neuroradiology: A prospective study,” J Magn Reson Imaging 2019;50:1824-1833.
5. Ryu et al. “Clinical experience of 1-minute brain MRI using a multicontrast EPI sequence in a different scan environment,” Am J Neuroradiol 2020;41:424-429.
6. Kits et al. “One-minute multi-contrast Echo planar brain MRI in ischemic stroke: A retrospective observational study of diagnostic performance,” J Magn Reson Imaging 2021;54:1088-1095.
7. Lebel, RM. “Performance characterization of a novel deep learning-based MR image reconstruction pipeline,” arXiv 2020.
8. Magnotta et al. “Measurement of Signal-to-Noise and Contrast-to-Noise in the fBIRN Multicenter Imaging Study,” J. Digit Imaging 2006;19:140-147.
9. Zhang et al. “Segmentation of brain MR images through a hidden Markov random field model and the expectation-maximization algorithm,” IEEE Trans Med Imag 2001;20(1):45-57.
Figures