4886
A dedicated arterial input function compensating for inflow and partial voluming in dynamic contrast enhanced MRI
Chih-Hsien Tseng1, Martijn Nagtegaal1, Jaap Jaspers2, Alejandra Mendez Romero2, Piotr Wielopolski3, Marion Smits3,4, Matthias J.P. van Osch4,5, and Frans Vos1,3,4
1Imaging Physics, Delft University of Technology, Delft, Netherlands, 2Radiation Oncology, Erasmus MC Cancer Institute, University Medical Center, Rotterdam, Netherlands, 3Radiation and Nuclear Medicine, Erasmus MC, University Medical Center, Rotterdam, Netherlands, 4Medical Delta, Delft, Netherlands, 5Radiology, C.J. Gorter MRI center, Leiden University Medical Center, Leiden, Netherlands
1Imaging Physics, Delft University of Technology, Delft, Netherlands, 2Radiation Oncology, Erasmus MC Cancer Institute, University Medical Center, Rotterdam, Netherlands, 3Radiation and Nuclear Medicine, Erasmus MC, University Medical Center, Rotterdam, Netherlands, 4Medical Delta, Delft, Netherlands, 5Radiology, C.J. Gorter MRI center, Leiden University Medical Center, Leiden, Netherlands
Synopsis
Keywords: Contrast Mechanisms, DSC & DCE Perfusion
Both inflow and partial volume effects (PVE) are sources of error when measuring the arterial input function (AIF) in DCE-MRI. We proposed a method that estimated the perceived pulse number of spins, and then corrected with these such that both effects were simultaneously compensated. Simulation data demonstrated that the reconstructed AIFs showed only marginal bias. In addition, the algorithm yielded highly correlated reconstructed curves over a wide range of PVEs in clinical data. Our findings show that the PVE can be compensated by considering it as part of the inflow correction as it exhibits similar confounding effects when measuring DCE-AIFs.Introduction
The Arterial Input Function (AIF) plays a crucial role in estimating vascular properties from Dynamic Contrast Enhanced MR imaging (DCE-MRI). Several confounders affect the outcomes, in particular inflow and PVE. Previously [1], inflow effects were corrected by estimating the perceived pulse number, however, PVEs were not addressed. We aimed to take the PVE into account to recover an even more accurate and reliable AIF. We hypothesized that the PVE could be interpreted as an underestimation of the perceived pulse number due to similar detrimental impact on AIF measurement in DCE-MRI.Methods
Simulation: Orton’s model [2] was used to artificially produce a standardized AIF concentration curve with parameters based on population means. The simulated AIF was converted into signal intensity assuming simple T2* decay of unsaturated longitudinal magnetization Mz(n):S(n)=sin(α)·Mz(n)·e−TE/T2*………(1).
with α=14◦, TE=0.9ms, T2*=200ms, and n representing the perceived number of RF-pulses by the spins, which directly reflects the degree of saturation. The expression for Mz(n) is
Mz(n)=M0·((1−(1−e−TR/T1)/(1−cos(α)·e−TR/T1))·(cos(α)·e−TR/T1)n+(1−e−TR/T1)/(1−cos(α)·e−TR/T1)………(2)
with M0 the assumed net blood magnetization: 1000, TR the repetition time: 2s, and T1 longitudinal relaxation time changed with the contrast concentration C:
1/T1=1/T10+(1−Hct)·R1·C………(3)
with T10 the initial longitudinal relaxation time: 1.6s. Hct the hematocrit level: 0.45, and R1 the relaxivity of the contrast agent: 4.5(mM·s)−1. In tissue, the saturated signal (S′(∞)) was modelled assuming constant T1 and T2*, and setting n equal to infinity in equation(1-2). A linear combination of the AIF-signal and the tissue-signal was applied modeling PVE:
SP(f,n)=(1−f)·S(n)+f·S′(∞)………(4)
with the PVE fraction f. White Gaussian noise was added to the resulting signal-intensity curve with SNR equal to 30. Finally, simulated signal-intensity curves were transformed into signal ratio curves Dsimu(t) by normalizing with the baseline signal (without contrast).
Imaging: Images were acquired from 10 patients suffering from diffuse glioma in a 3T MRI system (Signa Premier, GE Healthcare). In each patient, 7.5 ml of Gadobutrol (Gadovist®, Bayer), corresponding to a standard dose for a 75kg patient were automatically injected by a power injector during which DCE imaging was performed. DCE images were acquired using a differential subsampling with cartesian ordering 3D sequence[3] with TR/TE: 2.7/0.9ms, flip angle: 14◦; FOV: 220×220×142mm3, matrix size: 128×128, 72 slices, in-plane resolution: 1.7×1.7mm2, slice thickness: 2mm, temporal resolution: 2s, and 183 volumes in total.
Analysis: Mere inflow was simulated first: the PVE fraction (f) was set to 0. For each n∈[40,140], 1000 simulations were performed with different noise realizations yielding signal ratio curves Dsimu(t). Subsequently, this minimization problem was solved:
($$$θ$$$,$$$n$$$)=argminθ,n∥Dsimu(t)−D(COrton(t,θ),n)∥2………(5),
in which D(COrton(t,θ),n) is the fitted signal ratio curve. While doing so, Orton’s AIF parameters (θ) [2] were estimated as well as the perceived pulse number n. Next, the estimated pulse number ($$$n$$$) was used to determine the contrast concentration (C(t)) by solving
($$$C(t)$$$)=argminC∥Dsimu(t)−D(C(t),$$$n$$$)∥2………(6).
Lastly, the AIF’s peak value, FWHM and AUC were compared with the ground truth (from the simulation). Then, partial voluming was included by increasing f up to 50% (equation (4)). Subsequently, the correction algorithm was again applied and the peak value and FWHM of the reconstructed AIFs were compared. Finally, the correction algorithm was applied on the 10 clinical datasets. In each subject, one voxel inside the internal carotid artery was selected. Then, the intensity of this voxel was averaged with surrounding voxels applying increasing kernel size from 3-by-3 to 9-by-9. As such we aimed to mimic increasing PVE. The estimated pulse number from each kernel was compared with the estimated pulse number of the central voxel. Also, the normalized root mean square error (NRMSE) was calculated from the difference between each reconstructed AIF and the one from the central voxel (as a reference).
Results
Figure 1 shows the simulated AIF concentration curve (a), the signal ratio curves including inflow (b) and the signal ratio curves with both inflow and PVE (c). Error percentages of the estimated pulse number, reconstructed peak value, FWHM and AUC simulating only inflow effect are shown as box plots in figure 2. Clearly, there was no bias observable in any of the plotted parameters. As PVEs were introduced, the estimated pulse numbers gradually decreased (figure 3a). Simultaneously, however, only a mild bias was observed in the peak values and FWHMs of the reconstructed AIFs (figure 3b,c). A more obvious bias resulted when using the real pulse number to reconstruct AIFs (figure 3d,e). Figure 4 shows a representative example of PVE compensation in a clinical subject. Obviously, the AIFs were faithfully reconstructed even with large partial voluming. A decrease in estimated pulse number when increasing the fraction of PVE was observed in every subject (table 1). Furthermore, the NRMSE generally stayed small but becomes moderately higher with larger kernel sizes.Discussion
Partial voluming is often unavoidable when measuring the AIF. The PVE on the AIF measurement can be interpreted as increasing inflow (lower perceived pulse number) as it has comparable influence. As such we compensated the PVE through implicitly underestimating the received pulse number. Although a small bias can be observed in the reconstructed AIF concentration curves, it appears a more reliable approach than simply ignoring it.Conclusion
This study demonstrates that our method can successfully reconstruct the DCE AIFs contaminated by inflow effect and PVE with marginal bias.Acknowledgements
No acknowledgement found.References
[1] Jeroen J N van Schie, Cristina Lavini, Lucas J van Vliet, and Frans M Vos. “Estimating the arterial input function from dynamic contrast-enhanced MRI data with compensation for flow enhancement (I): Theory, method, and phantom experiments.” In: Journal of magnetic resonance imaging : JMRI 47.5 (2018), pp. 1190–1196. issn: 1522-2586. doi: 10.1002/jmri.25906.4[2] Matthew R Orton, James A d’Arcy, Simon Walker-Samuel, David J Hawkes, David Atkinson, David J Collins, and Martin O Leach. “Computationally efficient vascular input function models for quantitative kinetic modelling using DCE-MRI.” In: Physics in medicine and biology 53.5 (Mar. 2008), pp. 1225–39. issn: 0031-9155.doi: 10.1088/0031-9155/53/5/005.5
[3] Manojkumar Saranathan, Dan W. Rettmann, Brian A. Hargreaves, Sharon E.Clarke, and Shreyas S. Vasanawala. “DIfferential subsampling with cartesian ordering (DISCO): A high spatio-temporal resolution dixon imaging sequence for multiphasic contrast enhanced abdominal imaging”. In: Journal of Magnetic Resonance Imaging 35.6 (June 2012), pp. 1484– 1492. issn: 10531807. doi: 10 . 1002 / jmri .23602.5
Figures
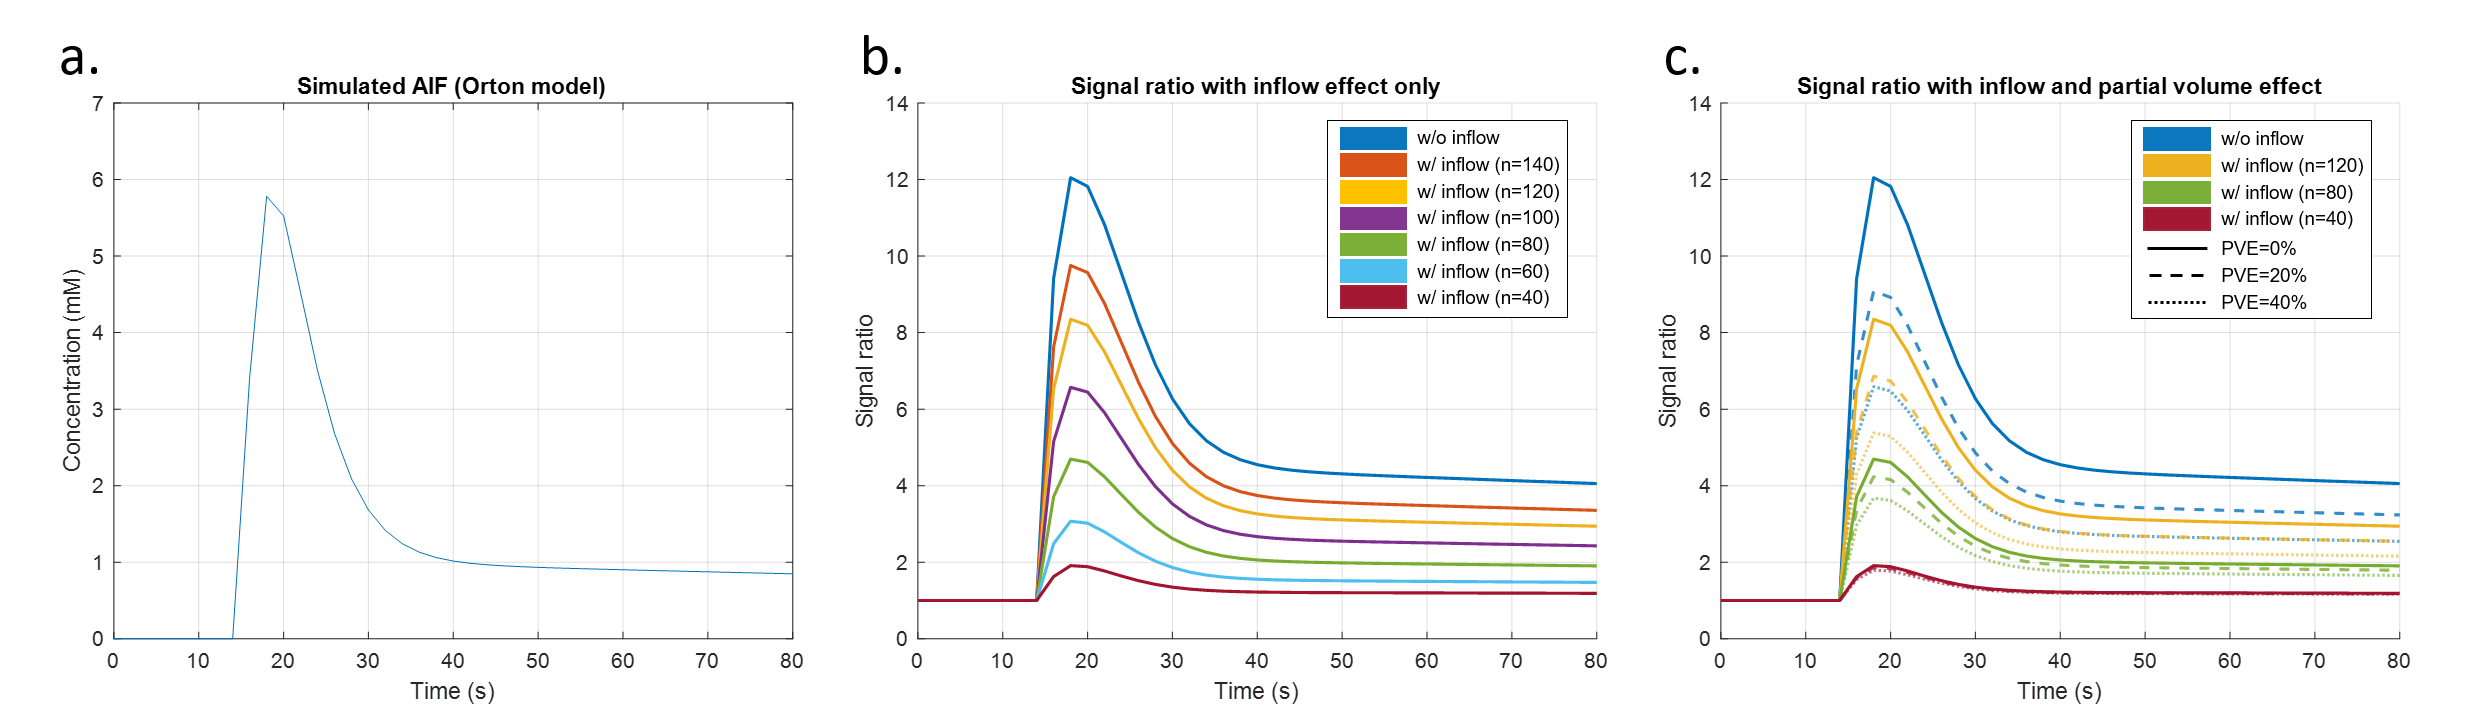
Figure 1. Simulated AIF concentration curve from Orton's model (a), signal ratio curves from simulated AIF concentration curves with inflow effect only (b) and likewise with partial voluming added (c). Notice that PVE led to similar underestimation of the AIF curves as inflow did.
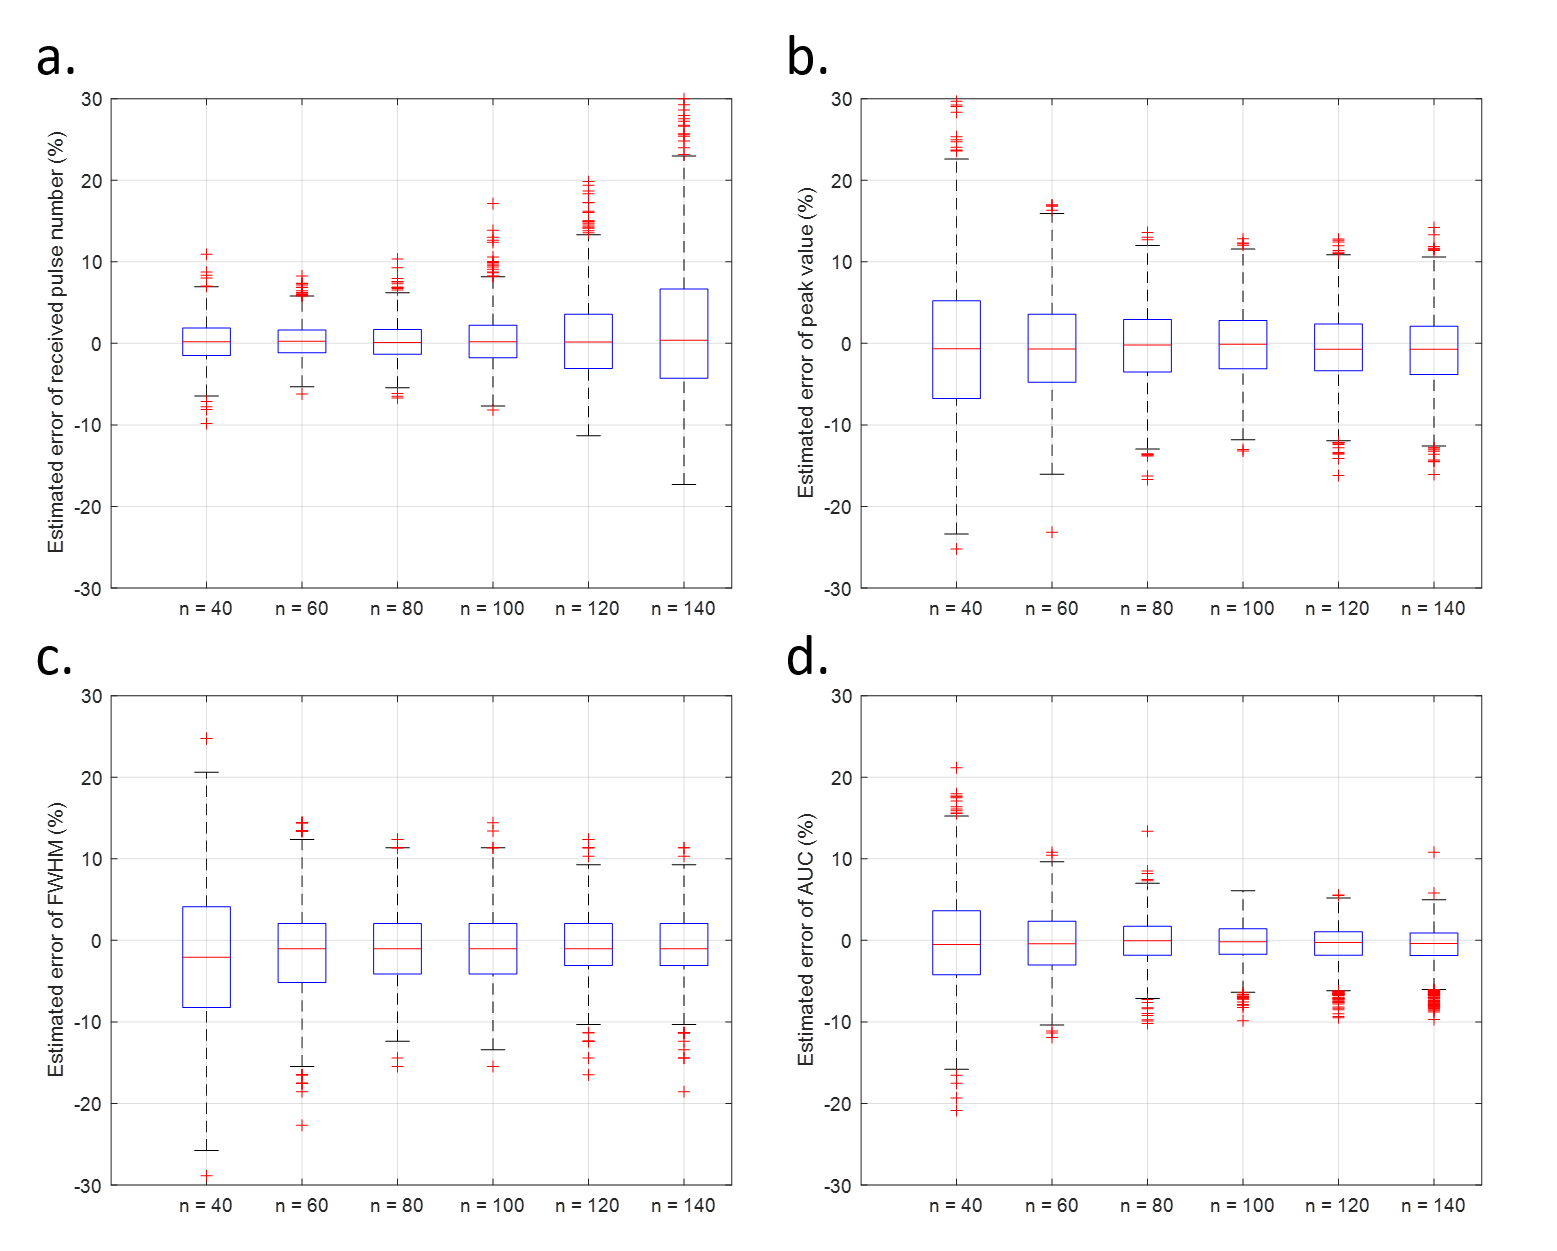
Figure 2. Error percentage of estimated pulse number (a), peak value (b), FWHM (c) and AUC (d) of compensated AIFs while only inflow effect was simulated.
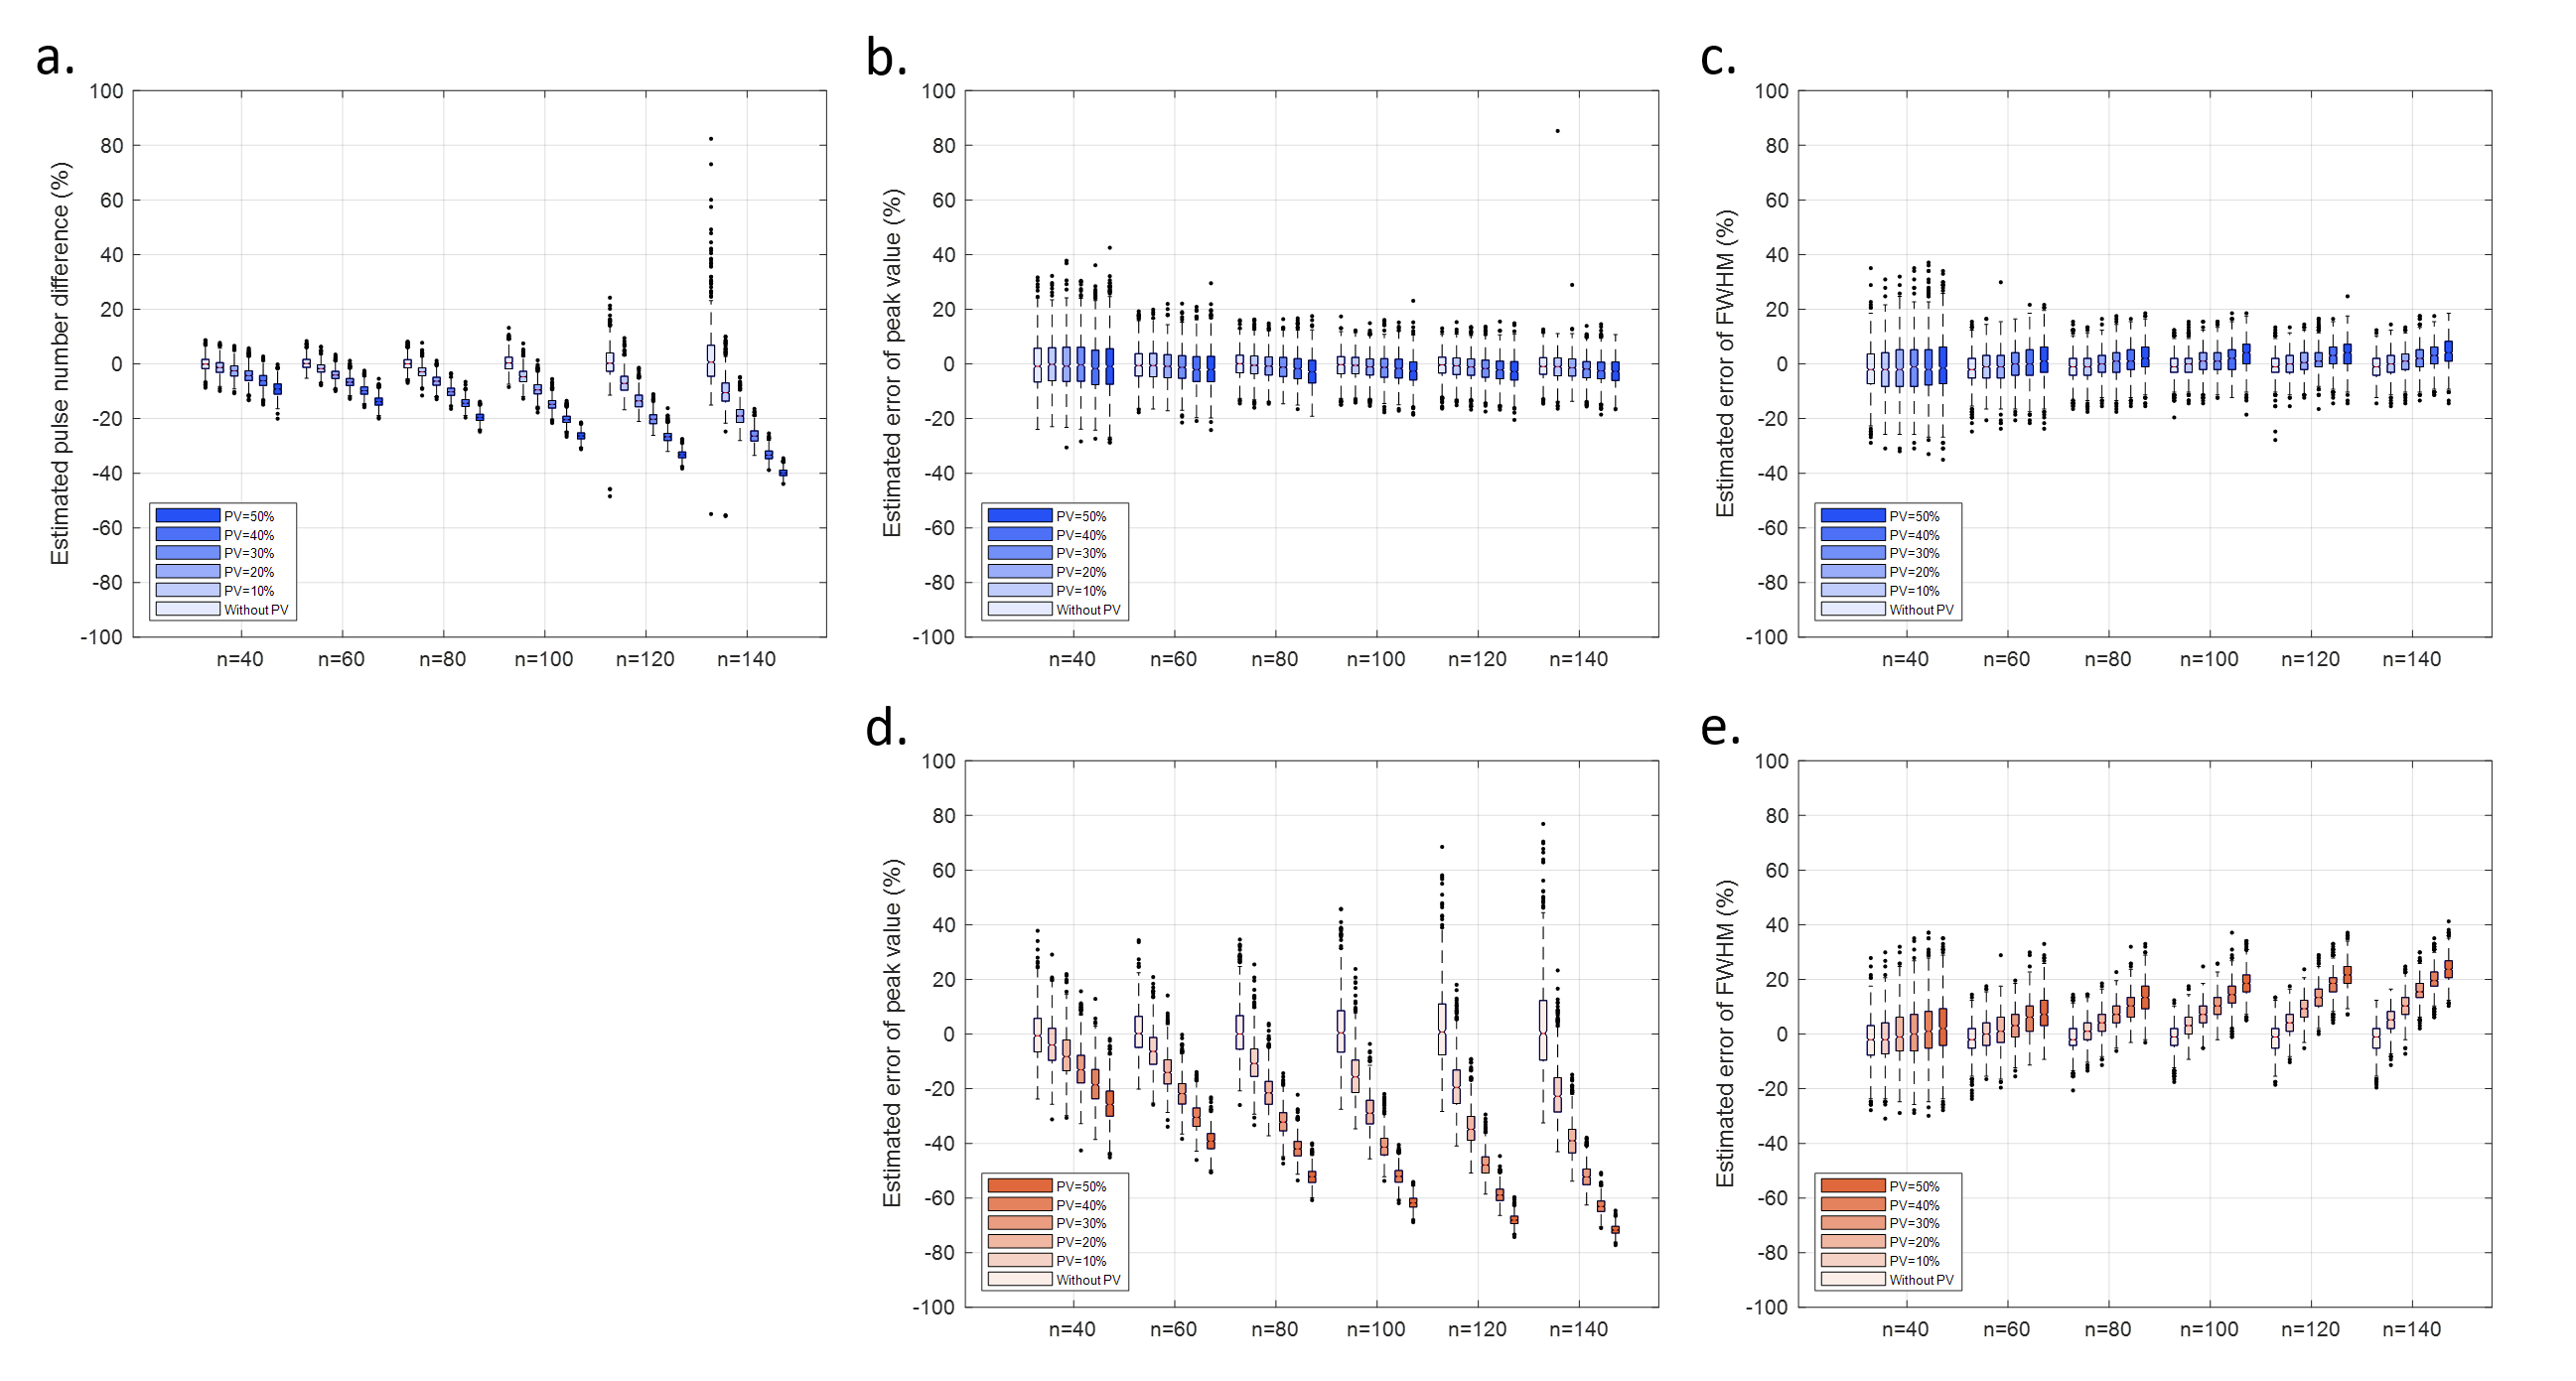
Figure 3. Error in the estimated pulse number (a), peak value of the AIF (b) and FWHM (c) when PVE was included in simulated signal ratio curves. Furthermore, error in peak values (d) and FWHMs (e) when using the true pulse number during AIF reconstruction.
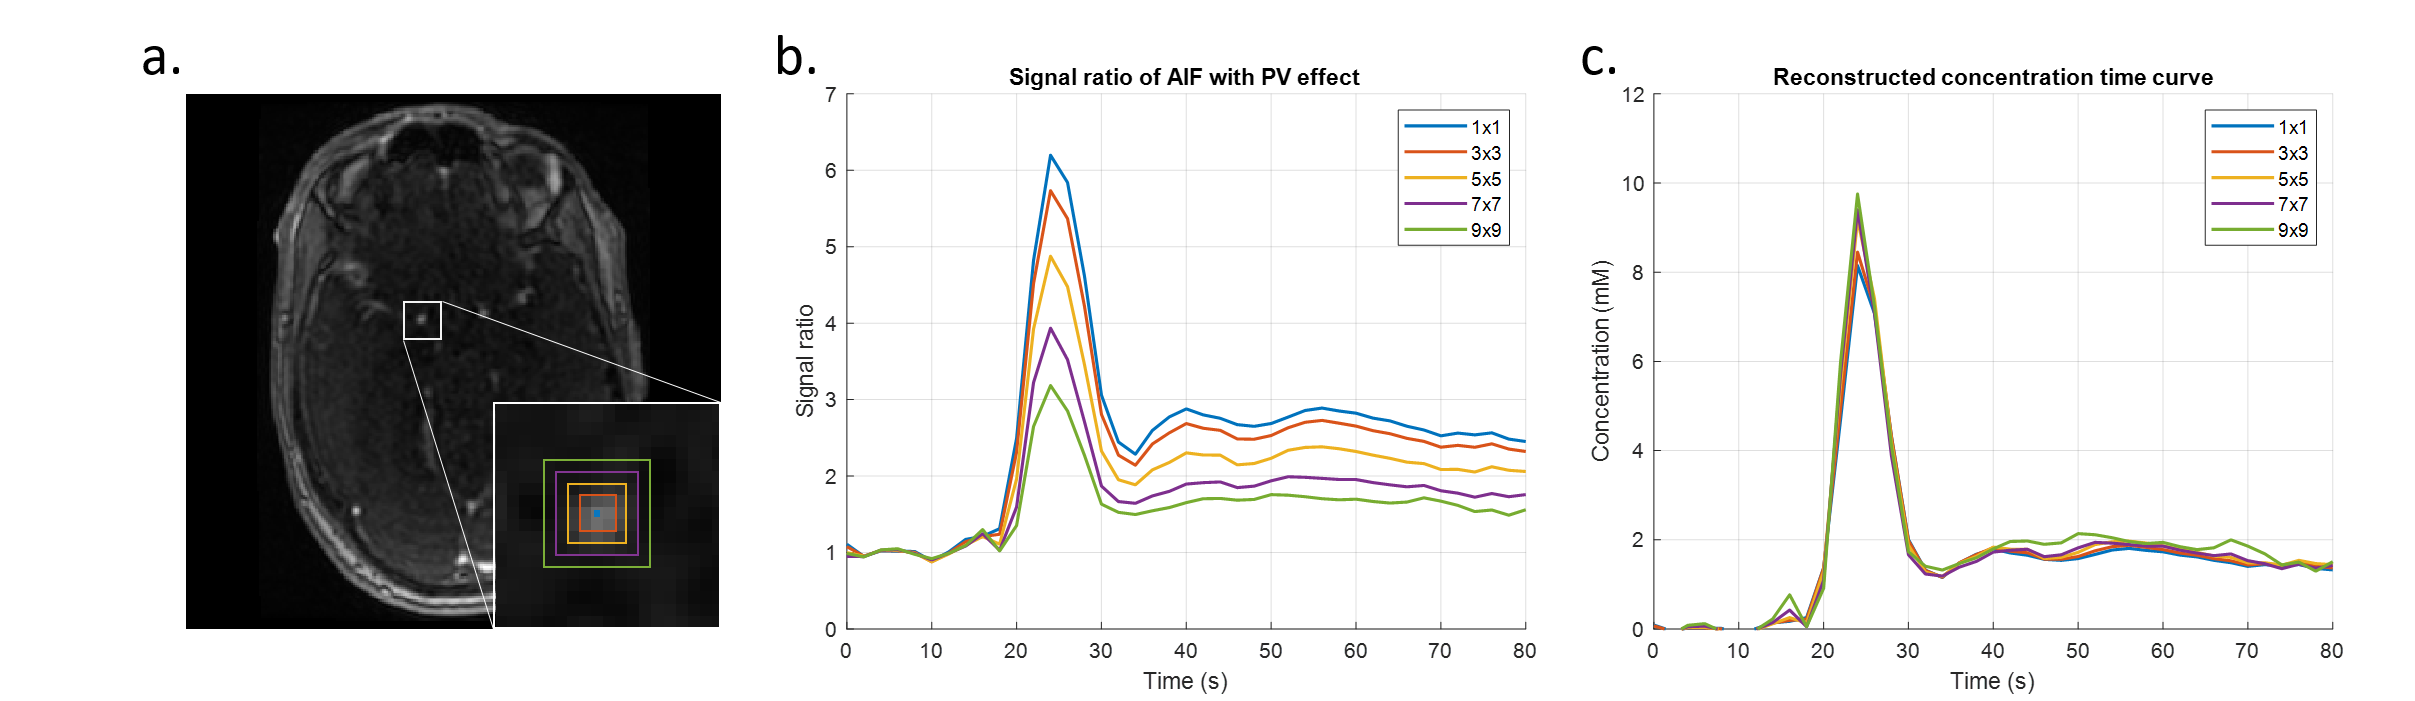
Figure 4. An example of reconstructing the AIF concentration curve measured in the internal carotid artery simulating while increasing PVE (a). Mean signal ratio curves within kernels and reconstructed AIF concentration curves are shown in (b) and (c), respectively.
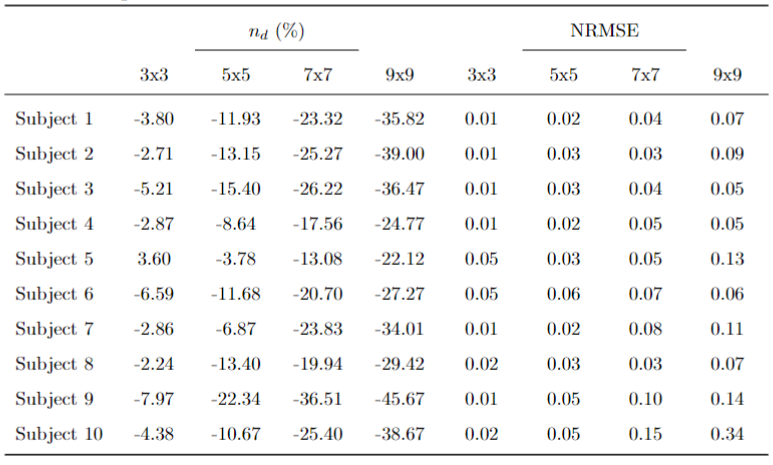
Table 1. Difference in estimated pulse number (nd) and NRMSE of reconstructed AIFs with increasing PVE (i.e. applied kernel size) in comparison to data from a single arterial voxel.
DOI: https://doi.org/10.58530/2023/4886