4881
Robust in vivo MRI of OATP reporter gene expressing cells using standard clinical dose of MRI contrast agent1Radiology and Institute for Quantitative Health Sciences and Engineering, Michigan State University, East Lansing, MI, United States
Synopsis
Keywords: Molecular Imaging, Cell Tracking & Reporter Genes
Hepatic OATPs are a promising molecular imaging reporter gene for MRI yet its translation for human studies is limited by the reported extremely high dose of contrast agent required (>40x clinical dose) for robust detection of engineered cells in vivo. Here we describe studies that culminated in the in vivo MRI detection of OATP-overexpressing cells using standard clinical doses. OATP-overexpression was accomplished by lentiviral transduction of tumor cells, followed by MRI screening to determine the best performing OATPs. In vivo MRI of OATP-overexpressing tumors was accomplished using a combination of both T1-weighted and dynamic contrast enhanced (DCE-) MRI.Introduction
Hepatic organic anion transporting polypeptides (OATPs) are promising reporter genes for MRI-based molecular imaging. OATPs transport clinical MRI contrast agents Gd-EOB-DTPA and Gd-BOPTA, the intracellular accumulation of which in hepatocytes or in OATP-overexpressing cells causes signal enhancement on T1-weighted MRI. MRI detection of OATP-overexpressing cells to date has required very high doses of MRI contrast agent (>40x clinical dose) and/or long wait times (several hours) after injection1-5. With recent safety and regulatory concern over linear contrast agents such as Gd-EOB-DTPA and Gd-BOPTA, translation of this imaging paradigm to humans will require lower doses of contrast agent. Here we describe MRI detection of OATP-overexpressing cells in vivo at standard clinical doses, combining both T1-weighted MRI and dynamic contrast enhanced (DCE-) imaging6.Material and methods
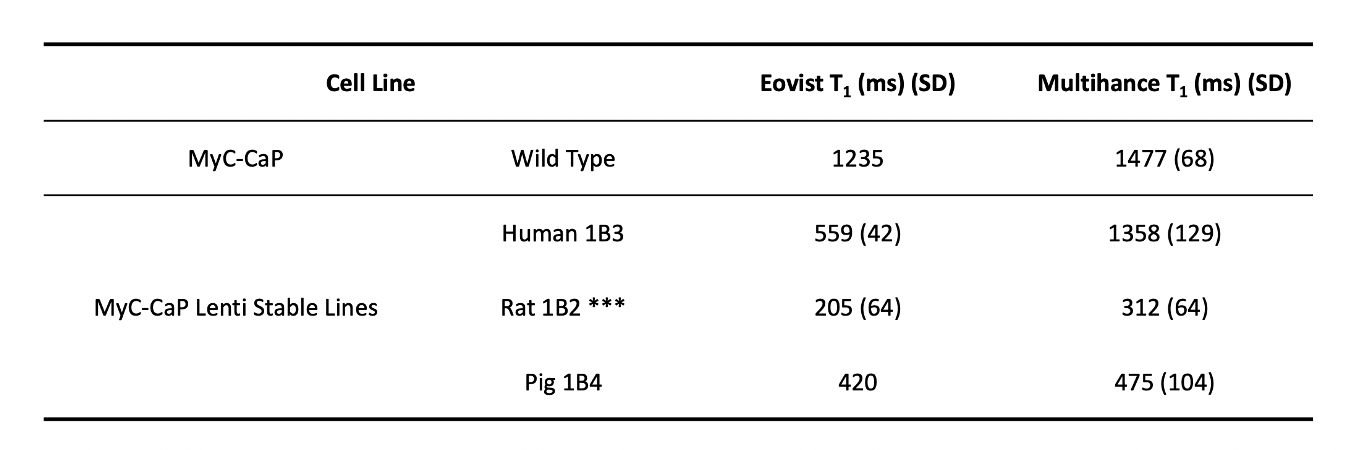
Cells: Lentivirus’ carrying human OATP1B3, rat OATP1B2 or pig OATP1B4, driven by EF1a promoter with blasticidin selection were purchased (VectorBuilder). Lentiviral transduction of MyC-Cap cells (mouse prostate cancer cell line) to express individual OATPs was accomplished via infection with 10 MOU viral particles followed by antibiotic selection.In-vitro MRI: Cells were incubated in culture media with either Gd-EOB-DTPA or Gd-BOPTA (2.5 mM, 1 hour). Media was then removed, cells were washed with PBS, and then trypsinized to detach from the plate. Cell pellets were washed twice more with PBS before MRI (Bruker 7.0T, 70/30 BioSpec). T1 maps of cell pellets were measured using standard sequences. Cells with lowest T1 values (highest contrast agent uptake) progressed to in vivo studies. Animal models: Tumors were developed by subcutaneous injection of 2x10⁶ cells in 100ml PBS with 100ml Matrigel on the right (OATP-expressing cells) and left flanks (wild-type cells) of mice. Humanized OATP knock-in mice7 or wild-type FVB mice were used to evaluate the background effects of human and rodent transporters in the liver. Mice underwent MRI two weeks post-inoculation, when tumors had formed.
In-vivo MRI: Mice underwent MRI on a Bruker 70/30 BioSpec using a 40 mm volume coil. Contrast agent doses for Gd-EOB-DTPA were 0.025 mmol/kg (clinical dose) or 0.25 mmol/kg (10x clinical dose), and for Gd-BOPTA were 0.025 mmol/kg (0.5 clinical dose) or 0.25 mmol/kg (5x clinical dose). Before tail-vein IV contrast agent administration, T2-weighted RARE (TR/TE 3000/40 ms) and T1-weighted RARE (TR/TE 750/6.5 ms) images were acquired. A dynamic T1-weighted FLASH sequence (TR/TE 46/2.5 ms) was acquired during injection and continuing for 1 hour with 30 s temporal resolution and then a T1-weighted RARE image was acquired 1 hour post contrast administration. Image resolution was 200x200 um and slice thickness was 1mm for all sequences.
Results
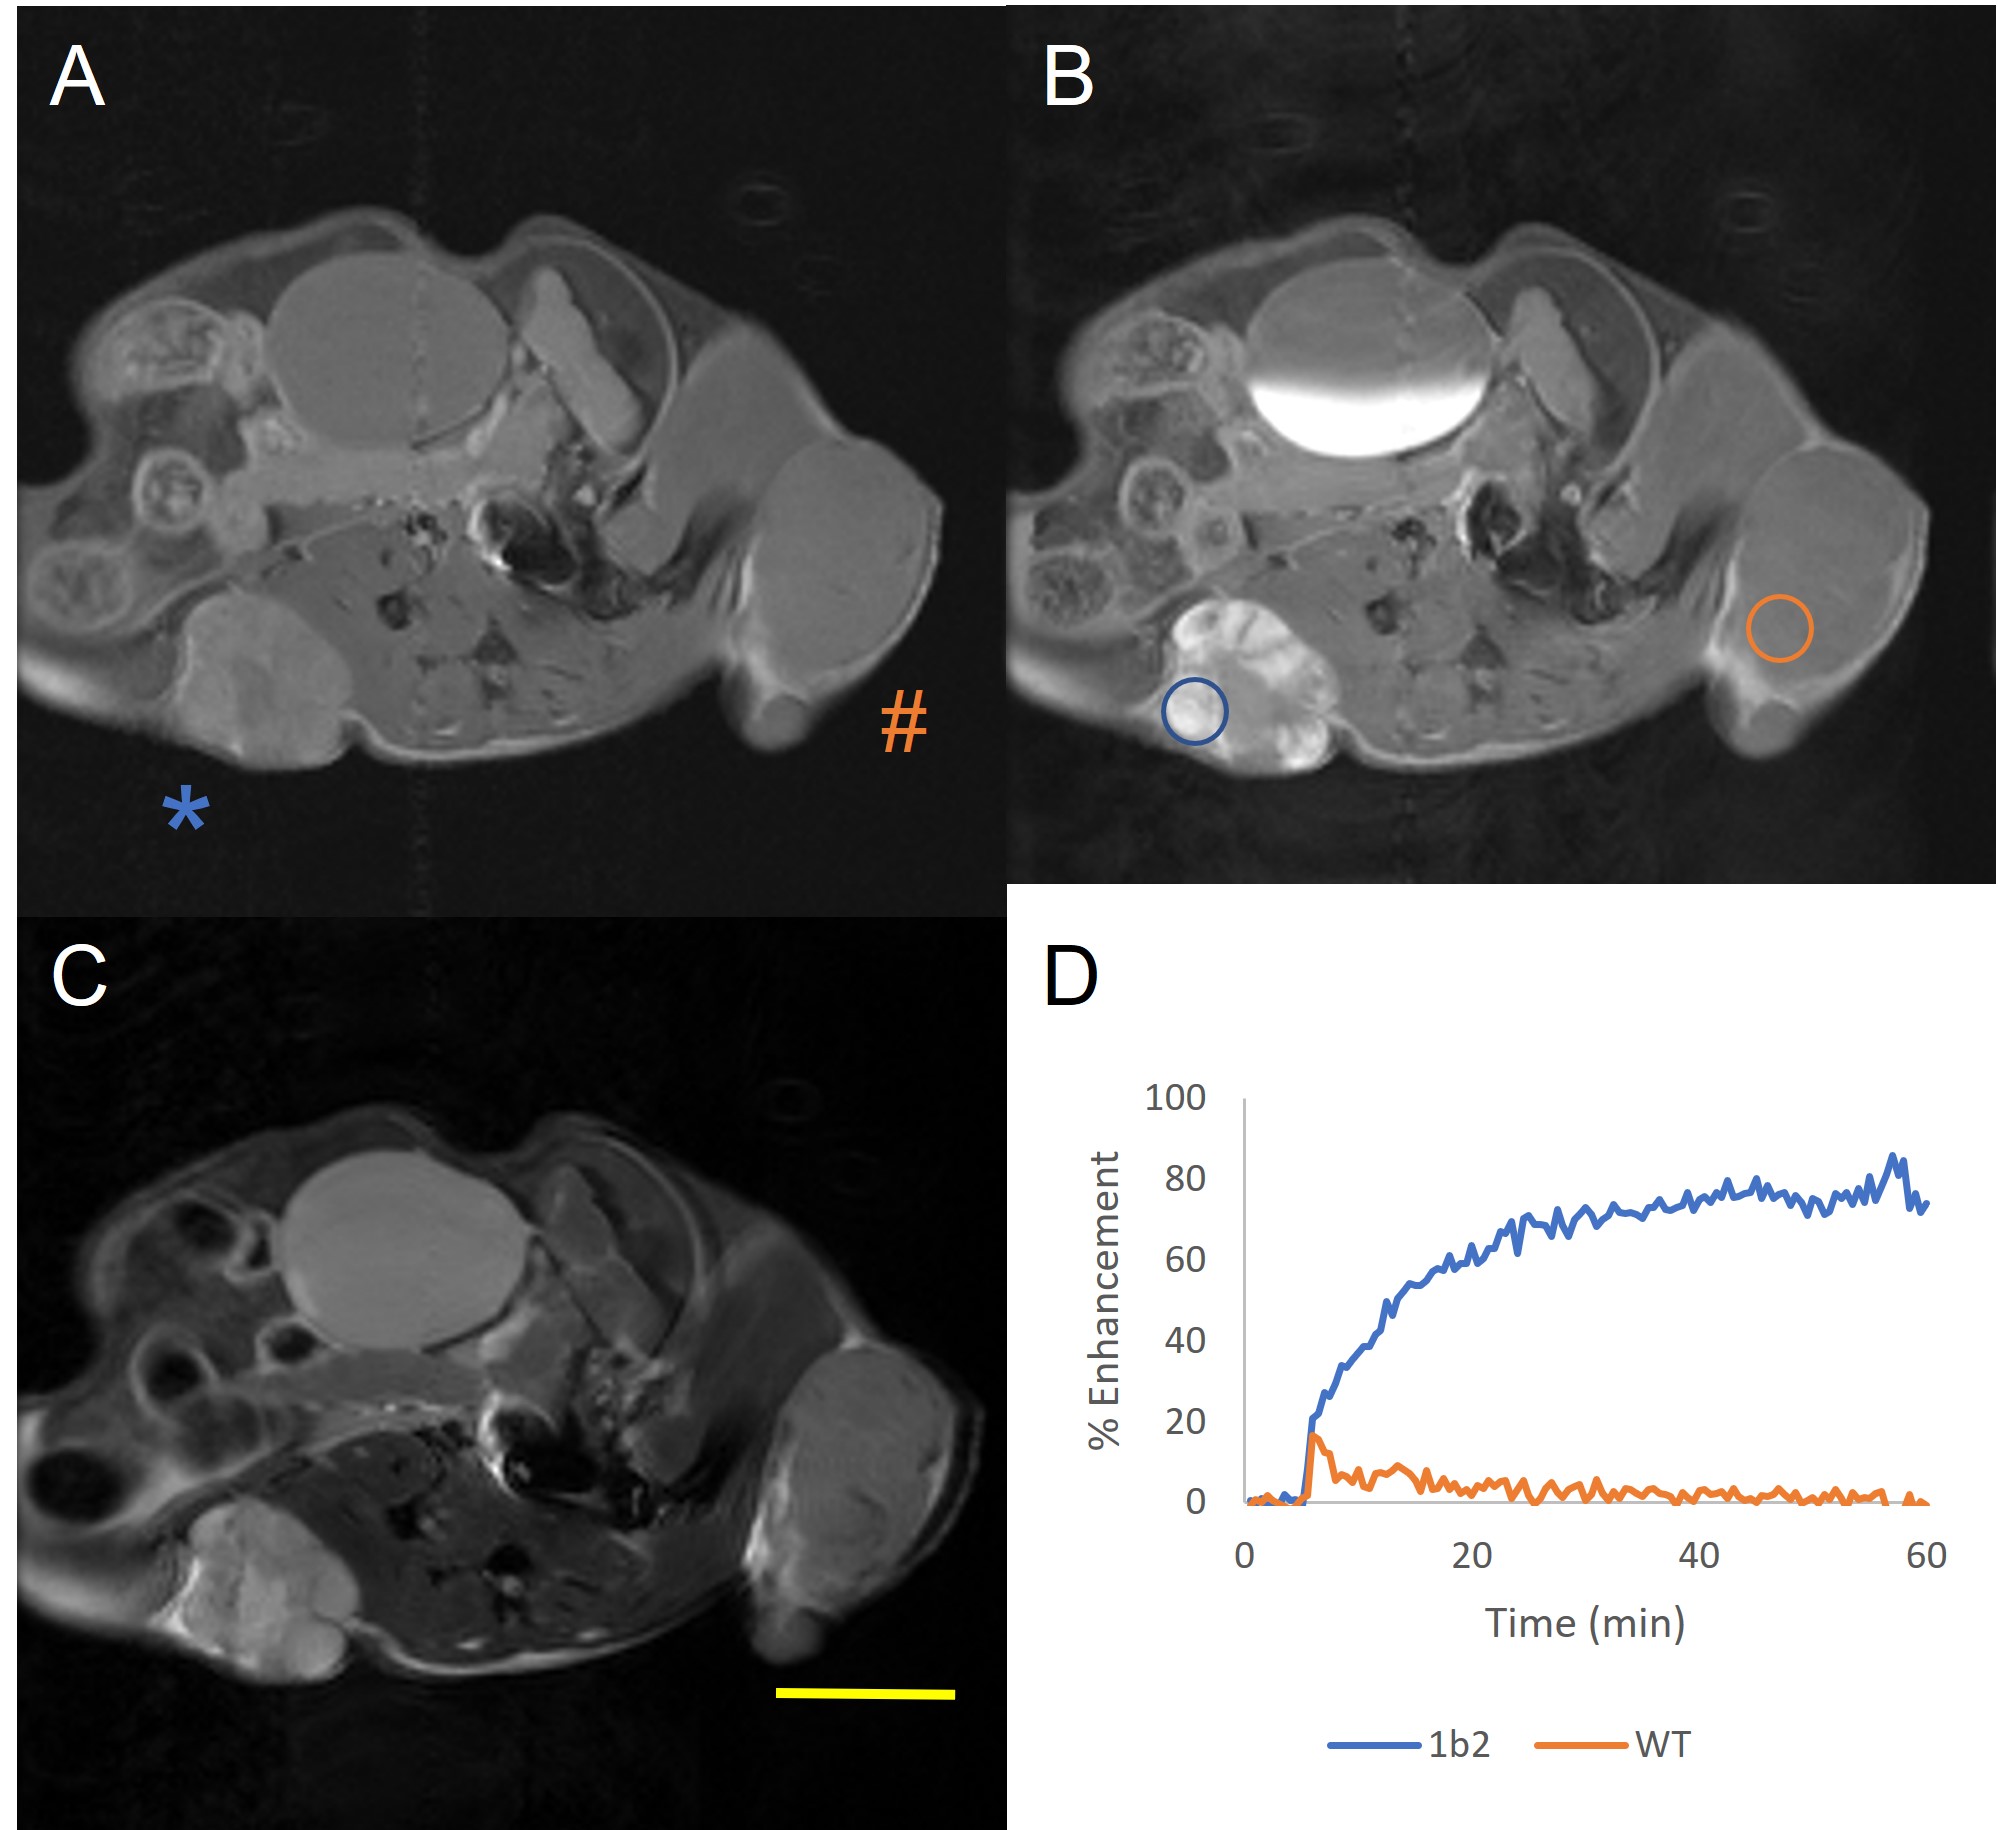
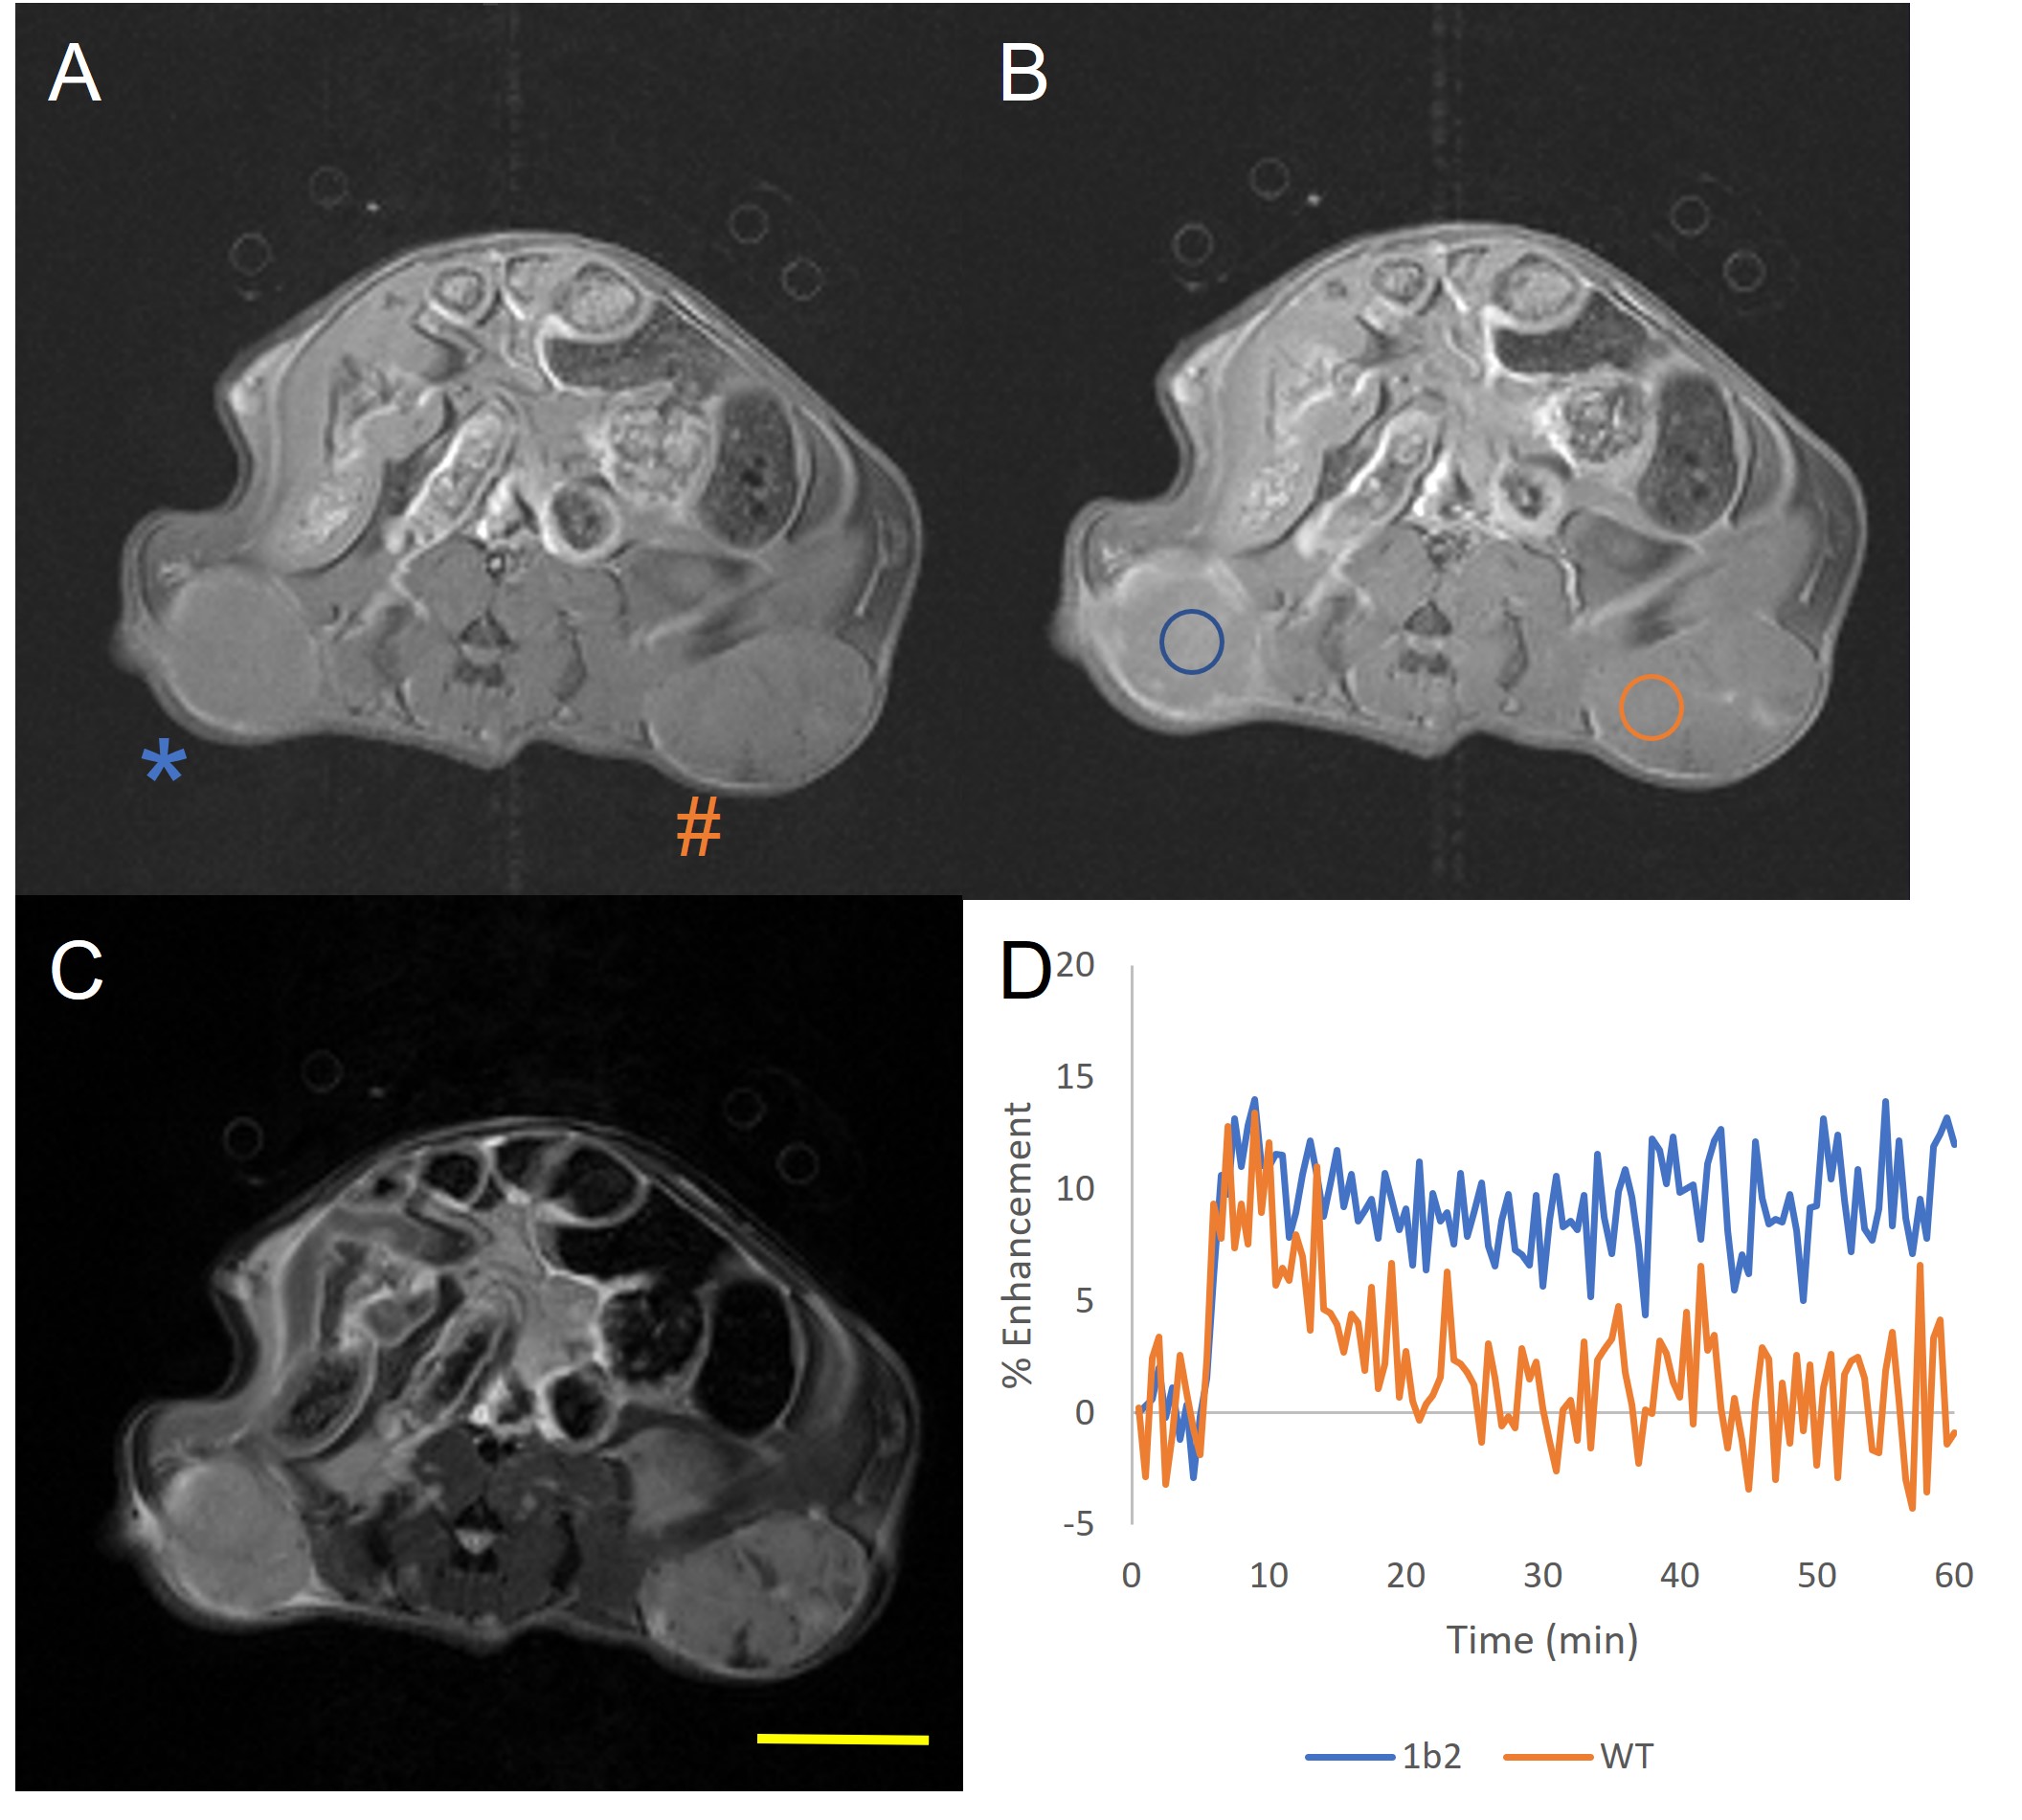
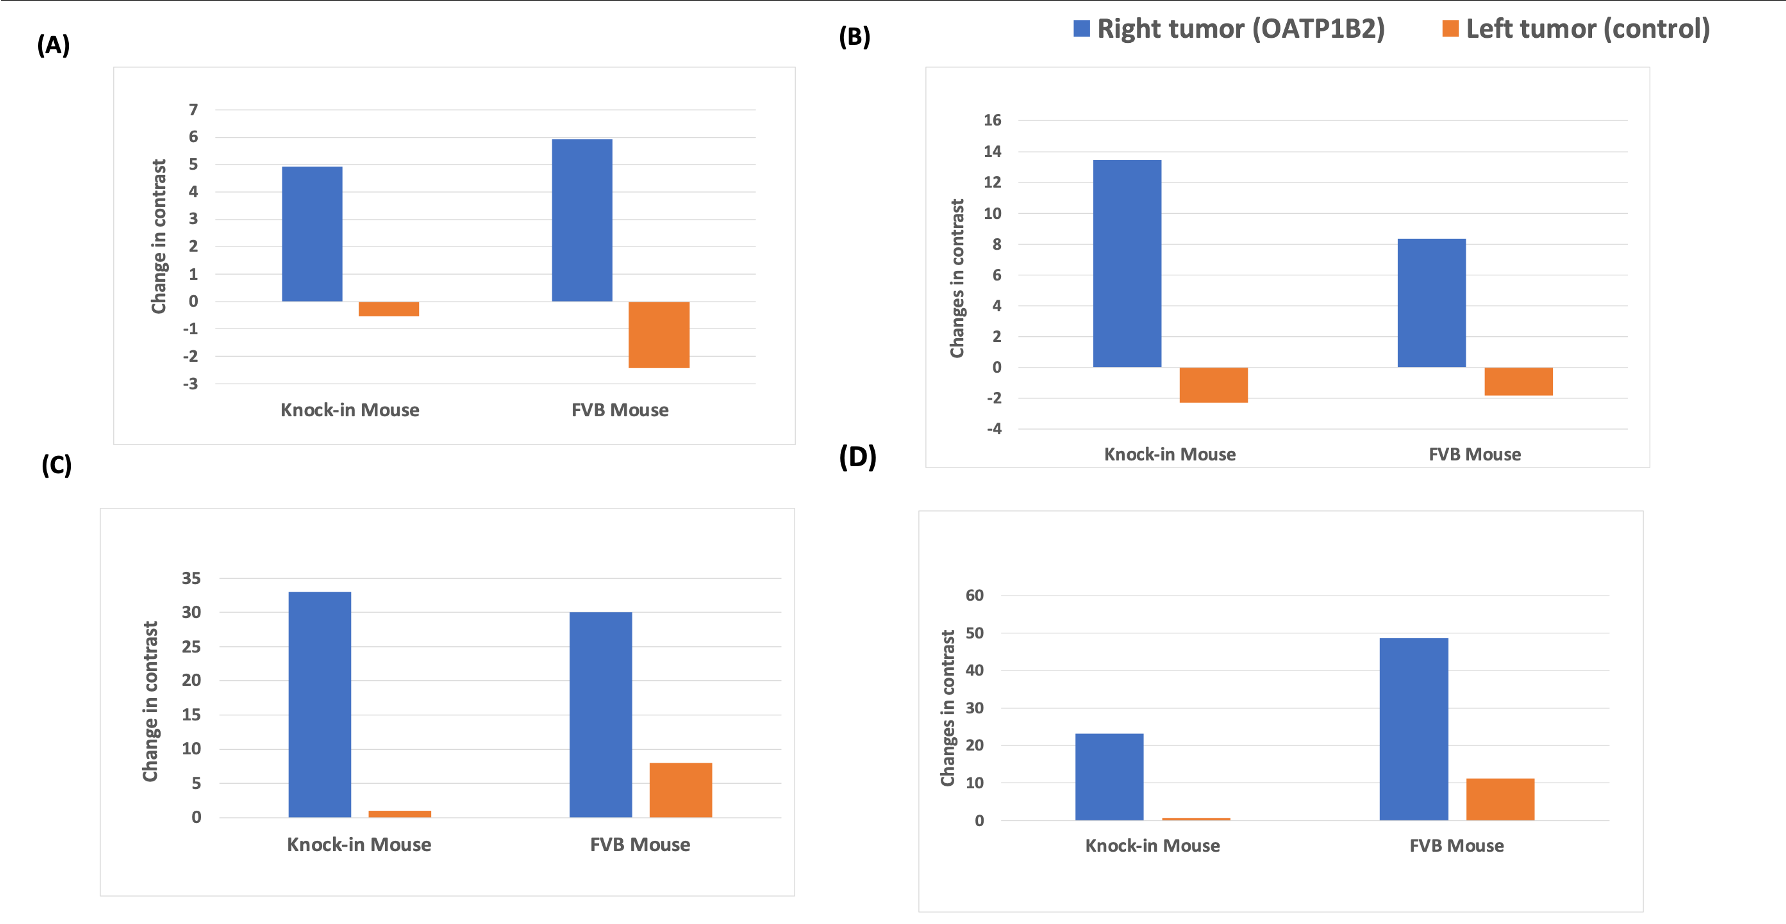
Rat OATP1B2 overexpressing MyC-Cap cells had the lowest T1 values (Figure 1), so these cells progressed to in vivo experiments. Figure 2 shows MRI from a humanized OATP-knock-in mouse harboring a rat OATP1B2-overexpressing tumor (*) and a wild-type tumor (#). This mouse received standard clinical dose of Gd-EOB-DTPA. Substantial signal enhancement in the OATP-overexpressing tumor is observed. Figure 3 shows MRI from a wild-type FVB mouse harboring a rat OATP1B2-overexpressing tumor (*) and a wild-type tumor (#). This mouse received half clinical dose of Gd-BOPTA. In this example, hyperintense MRI signal is less obvious, yet the DCE-MRI time course clearly demonstrates the retained low hyperintensity on the OATP-overexpressing tumor versus wash out from the wild-type tumor. Signal enhancement is patchy because of the way these tumors grow. Figure 4 quantifies the contrast-to-noise gains in enhancing regions of the tumors for various tumor types in the two animal strains tested. Both Gd-EOB-DTPA and Gd-BOPTA were equally effective, in both humanized OATP1B1/OATP1B3 knock-in and wild-type mice. Delivery of 10X clinical dose of Gd-EOB-DTPA or 5X dose of Gd-BOPTA yielded increased CNR gains versus 1X or 0.5X, respectively, on the ability to discriminate engineered tumors. Rat OATP1B2 overexpressing cells grew similarly in humanized OATP mouse models as in syngeneic FVB mice, suggesting that rat OATP1B2 has low immunogenicity in genetically disparate scenarios.Discussion
A major challenge in cell/gene therapy is to monitor therapeutic/engineered cells through non-invasive imaging. MRI reporter genes and clinically approved contrast agents can potentially solve this dilemma, however, agents need to be delivered at clinical doses or lower for clinical translation. We first screened species-specific hepatic OATPs in transduced cell lines and determined that rat OATP1B2 was the most effective OATP for transporting both Gd-EOB-DTPA and Gd-BOPTA. Rat OATP1B2 is 63% (456 residues) identical to human OATP1B3 with 161 additional similar residues8, yet we acknowledge the potential challenge of using a rodent protein for human molecular imaging. More important than this detail, at this point, is that the screening of OATP-expressing cell lines for maximal accumulation of agent via T1 mapping enabled rational choice of cell line for generating OATP-expressing tumors that could be detected in vivo in mice using clinical dose of agent, nearly immediately after delivery of the agent. Indeed, the combination of T1-weighted MRI and DCE-MRI facilitates the differentiation of OATP-expressing tumors where T1-weighting alone may not be sufficient.Conclusion
OATP-overexpressing cell transplants (tumors in this demonstration) can be detected in vivo using standard clinical doses if the OATP expression level is sufficiently high. DCE-MRI in combination with T1-weighted MRI is helpful to identify these cells.Acknowledgements
This work was supported by NIH R21 EB032110.
Imaging was performed at the Advanced Molecular Imaging Facility at Michigan State University.
References
1. Kelly, J. J.; Saee-Marand, M.; Nyström, N. N.; Evans, M. M.; Chen, Y.; Martinez, F. M.; Hamilton, A. M.; Ronald, J. A., Safe harbor-targeted CRISPR-Cas9 homology-independent targeted integration for multimodality reporter gene-based cell tracking. Science Advances 2021, 7 (4), eabc3791.
2. Nystrom, N. N.; Hamilton, A. M.; Xia, W.; Liu, S.; Scholl, T. J.; Ronald, J. A., Longitudinal Visualization of Viable Cancer Cell Intratumoral Distribution in Mouse Models Using Oatp1a1-Enhanced Magnetic Resonance Imaging. Invest Radiol 2019, 54 (5), 302-311.
3. Wu, M. R.; Hsiao, J. K.; Liu, H. M.; Huang, Y. Y.; Tseng, Y. J.; Chou, P. T.; Weng, T. I.; Yang, C. Y., In vivo imaging of insulin-secreting human pancreatic ductal cells using MRI reporter gene technique: A feasibility study. Magn Reson Med 2019, 82 (2), 763-774.
4. Wu, M. R.; Liu, H. M.; Lu, C. W.; Shen, W. H.; Lin, I. J.; Liao, L. W.; Huang, Y. Y.; Shieh, M. J.; Hsiao, J. K., Organic anion-transporting polypeptide 1B3 as a dual reporter gene for fluorescence and magnetic resonance imaging. FASEB J 2018, 32 (3), 1705-1715.
5. Patrick, P. S.; Hammersley, J.; Loizou, L.; Kettunen, M. I.; Rodrigues, T. B.; Hu, D. E.; Tee, S. S.; Hesketh, R.; Lyons, S. K.; Soloviev, D.; Lewis, D. Y.; Aime, S.; Fulton, S. M.; Brindle, K. M., Dual-modality gene reporter for in vivo imaging. Proc Natl Acad Sci U S A 2014, 111 (1), 415-20.
6. Shuboni-Mulligan, D. D.; Parys, M.; Blanco-Fernandez, B.; Mallett, C. L.; Schnegelberger, R.; Takada, M.; Chakravarty, S.; Hagenbuch, B.; Shapiro, E. M., Dynamic Contrast-Enhanced MRI of OATP Dysfunction in Diabetes. Diabetes 2019, 68 (2), 271-280.
7. Mir, F. F.; Tomaszewski, R. P.; Shuboni-Mulligan, D. D.; Mallett, C. L.; Hix, J. M. L.; Ether, N. D.; Shapiro, E. M., Chimeric mouse model for MRI contrast agent evaluation. Magnetic Resonance in Medicine 2019, 82 (1), 387-394.
8. Hagenbuch, B.; Stieger, B., The SLCO (former SLC21) superfamily of transporters. Mol. Aspects Med 2013, 34 (2-3), 396-412.
Figures