4878
Relaxometry Measurements of Europium-doped Mn0.6Zn0.4Fe2O4 at Increasing Magnetic Field1Division of Medical Physics, Department of Radiology, University Medical Center Freiburg, Freiburg, Germany, 2Faculty of Physics, University of Isfahan, Isfahan, Iran (Islamic Republic of)
Synopsis
Keywords: Contrast Agent, Relaxometry, Relaxometery, longitudinal Relaxation Time
Magnetic resonance imaging (MRI) contrast agents with both intrinsic high r1 and r2 relaxivities are desirable in medical diagnosis to achieve highly accurate and ambiguity-free MR images. Here, we report synthesis and MRI tests of Europium doped Mn-Zn ferrite (EuMZF) nanoparticles at different magnetic field strengths. EuMZF nanoparticles showed significant improvement in both positive (T1) and negative (T2) contrasts. The results showed that by increasing magnetic field, r1 relaxivity decreased while r2 increased so that the EuMZF is suitable as a dual-mode contrast at 1.5 and 3T but it is a T2 agent at 7 and 9.4T.
Introduction
Contrast agents are essential in clinical MRI, as they can improve the sensitivity and reliability of MR images1. Two classes of MRI contrast agents are used: paramagnetic metal chelates that shorten T1, and superparamagnetic iron oxide particles that induce a reduction of T2*2. In this work, we investigate the effect of Europium-doping on the relaxivities r1 and r2 of Mn-Zn spinel ferrite (MZF) at different magnetic field strengths (1.5, 3, 7 and 9.4T).Methods
To synthesize Eu-doped Mn-Zn ferrite (EuMZF) with a coprecipitation method, adequate amounts of Fe3+, Mn2+, Zn2+, and Eu3+ metal salts with a molar ratio of Fe: Eu equals 10 and citric acid were dissolved in water on a hot magnetic stirrer at 80 °C. A boiling solution of NaOH (2M) was prepared, and the mixture was poured entirely into the boiling NaOH. The resulting black precipitation was washed with water several times and dried at 60 °C for 4 hours to obtain nanopowders of EuMZF. The crystal structure of nanoparticles was analyzed by X-Ray Diffraction (XRD) method. The room temperature magnetic properties of the samples were investigated via a VSM unit. Relaxometry measurements were performed at room temperature at 1.5T/3T using a clinical Magnetom Aera/Prisma Fit MRI system (Siemens AG, Erlangen, Germany) and a 15-channel transmit/receive knee coil (QED, Cleveland, OH) / 20-channel head coil (Siemens). At both 1.5 and 3T, a segmented Turbo FLASH sequence3 was used to measure T1 using 9 different saturation recovery times (TS): 100, 200, 300, 400, 500, 750, 1250, 2500, and 5000 ms. From the images, T1 was obtained by fitting the experimental signal data to the saturation recovery equation:$$S(TS)=S_0(1-e^{-TS/T1})$$
To measure T2, Carr-Purcell-Meiboom-Gill (CPMG) pulse sequence was applied4, and T2 was calculated by fitting to the signal equation:
$$S(TE)=S_0e^{-TE/T2}$$
Measurements at 7T and 9.4 were conducted using a pre-clinical Bruker system (Biospec 94/20, Bruker, Ettlingen, Germany) equipped with a four-channel receiver array (Bruker, Ettlingen, Germany). Spin Echo T1 measurements were carried out at TE=7ms and TRs between 400 and 12500 ms. To calculate T2, the Standard Spin Echo (SE) pulse sequence protocol with a fixed TR of 1000ms and different echo times (TE=14-112ms) was applied. At 7 and 9.4T the longitudinal relaxation times were estimated using the following equation:
$$S(TR)=S_0e^{-TR/T2}$$
From the T1 and T2 values at different concentrations, the longitudinal (r1) and transverse (r2) relaxivities were calculated:
$$R_i=1/T_i=1/T_{io}+1/T_i^{CA}=R_{io}+r_i$$ with $$$i=1,2$$$. Here, $$$T_{io}=R_{io}^{-1}$$$ denotes the relaxation time of the solvent in the absence of the contrast agent.
Results
X-Ray diffraction pattern of the EuMZF sample (figure1) illustrates a spinel cubic phase (JCPDS file N° 96-200-9104) with Fd-3 m space group with no trace of any secondary phase. Figure 2 depicts the variation of the magnetization versus Magnetic field for MZF and EuMZF samples. The saturation magnetization (Ms) for MZF is 58 while for EuMZF it is 45emu/g.Figure 3 shows the T1-weighted and T2-weighted MR images of MZF and EuMZF at 3T. With increasing concentration, the signal intensity of the EuMZF samples in the T1-weighted image increased significantly whereas for the MZF sample no signal improvement can be seen. The signal intensity in the T2-weighted images has decreased monotonically with increasing concentration of both samples. Figure 4a and 4b illustrate the variation of the longitudinal and transverse relaxation rates R1 and R2 as a function of concentration. Relaxation rates increased linearly with concentration yielding an r1=11.6s-1mM-1 for the EuMZF and 1.7s-1mM-1 for MZF. The r2 values for the EuMZF and the MZF samples were 130 and 250s-1mM-1 respectively. The r1 relaxivity decreased with increasing magnetic field while the r2 relaxivity increased. The r1, r2, and the ratio of r2/r1 values at 1.5, 3, 7 and 9.4T are listed in table1. The ratio of r2/r1 of the EuMZF increased with the magnetic field from 8.9 at 1.5T to 115 at 9.4T.
Discussion and Conclusion
In EuMZF the dipole-dipole interaction between paramagnetic centers of Mn2+ and Eu3+ ions and water protons in inner- and outer-sphere shells is responsible for the high r1 relaxivity5. Citric acid coating controls the size of the EuMZF nanoparticles and makes them dispersible in aqueous media6 which further contributes to r1. r2 is proportional to squared M7; thus, the higher M of MZF leads to a higher r2 value for MZF as compared to EuMZF. The magnetization of the superparamagnetic EuMZF increases with increasing magnetic field which in turn alters r1 and r2 relaxivities (a reduction in r1 and an increase in r2 with increasing magnetic field). The ratio of r2/r1 determines the efficiency of a contrast agent. T1-weighted contrast agents normally have low values of r2/r1 close to one, and T2-weighted contrast agents have a very high one. Dual-mode contrast agents have a moderate r2/r1. According to table one, EuMZF at 1.5T and 3T has a moderate r2/r1 so it can potentially be used as a dual-mode contrast agent. At 7T and 9.4T, r2/r1 is much higher making EuMZF a good candidate for a T2-weighted contrast agent at these field strengths.Acknowledgements
No acknowledgement found.References
1. Xiao Y-D, Paudel R, Liu J, Ma C, Zhang Z-S, Zhou S-K. MRI contrast agents: Classification and application (Review). Int. J. Mol. Med. 2016; 38:1319–1326 doi: 10.3892/ijmm.2016.2744.
2. Laurent S, Henoumont C, Stanicki D, et al. MRI Applications: Classification According to Their Biodistribution. In: Laurent S, Henoumont C, Stanicki D, et al., editors. MRI Contrast Agents: From Molecules to Particles. SpringerBriefs in Applied Sciences and Technology. Singapore: Springer; 2017. pp. 111–125. doi: 10.1007/978-981-10-2529-7_6.
3. Bock M, Schulz J, Ueltzhoeffer S, Giesel F, Voth M, Essig M. Intravascular contrast agent T1 shortening: fast T1 relaxometry in a carotid volunteer study. Magma N. Y. N 2008; 21:363–368 doi: 10.1007/s10334-008-0134-2.
4. Meiboom S, Gill D. Modified Spin‐Echo Method for Measuring Nuclear Relaxation Times. Rev. Sci. Instrum. 1958; 29:688–691 doi: 10.1063/1.1716296.
5. Tóth É, Helm L, Merbach AE. Relaxivity of MRI Contrast Agents. In: Krause W, editor. Contrast Agents I: Magnetic Resonance Imaging. Topics in Current Chemistry. Berlin, Heidelberg: Springer; 2002. pp. 61–101. doi: 10.1007/3-540-45733-X_3.
6. Park JC, Lee GT, Kim H-K, et al. Surface Design of Eu-Doped Iron Oxide Nanoparticles for Tuning the Magnetic Relaxivity. ACS Appl. Mater. Interfaces 2018.
7. Zhang W, Liu L, Chen H, et al. Surface impact on nanoparticle-based magnetic resonance imaging contrast agents. Theranostics 2018; 8:2521–2548 doi: 10.7150/thno.23789.
Figures
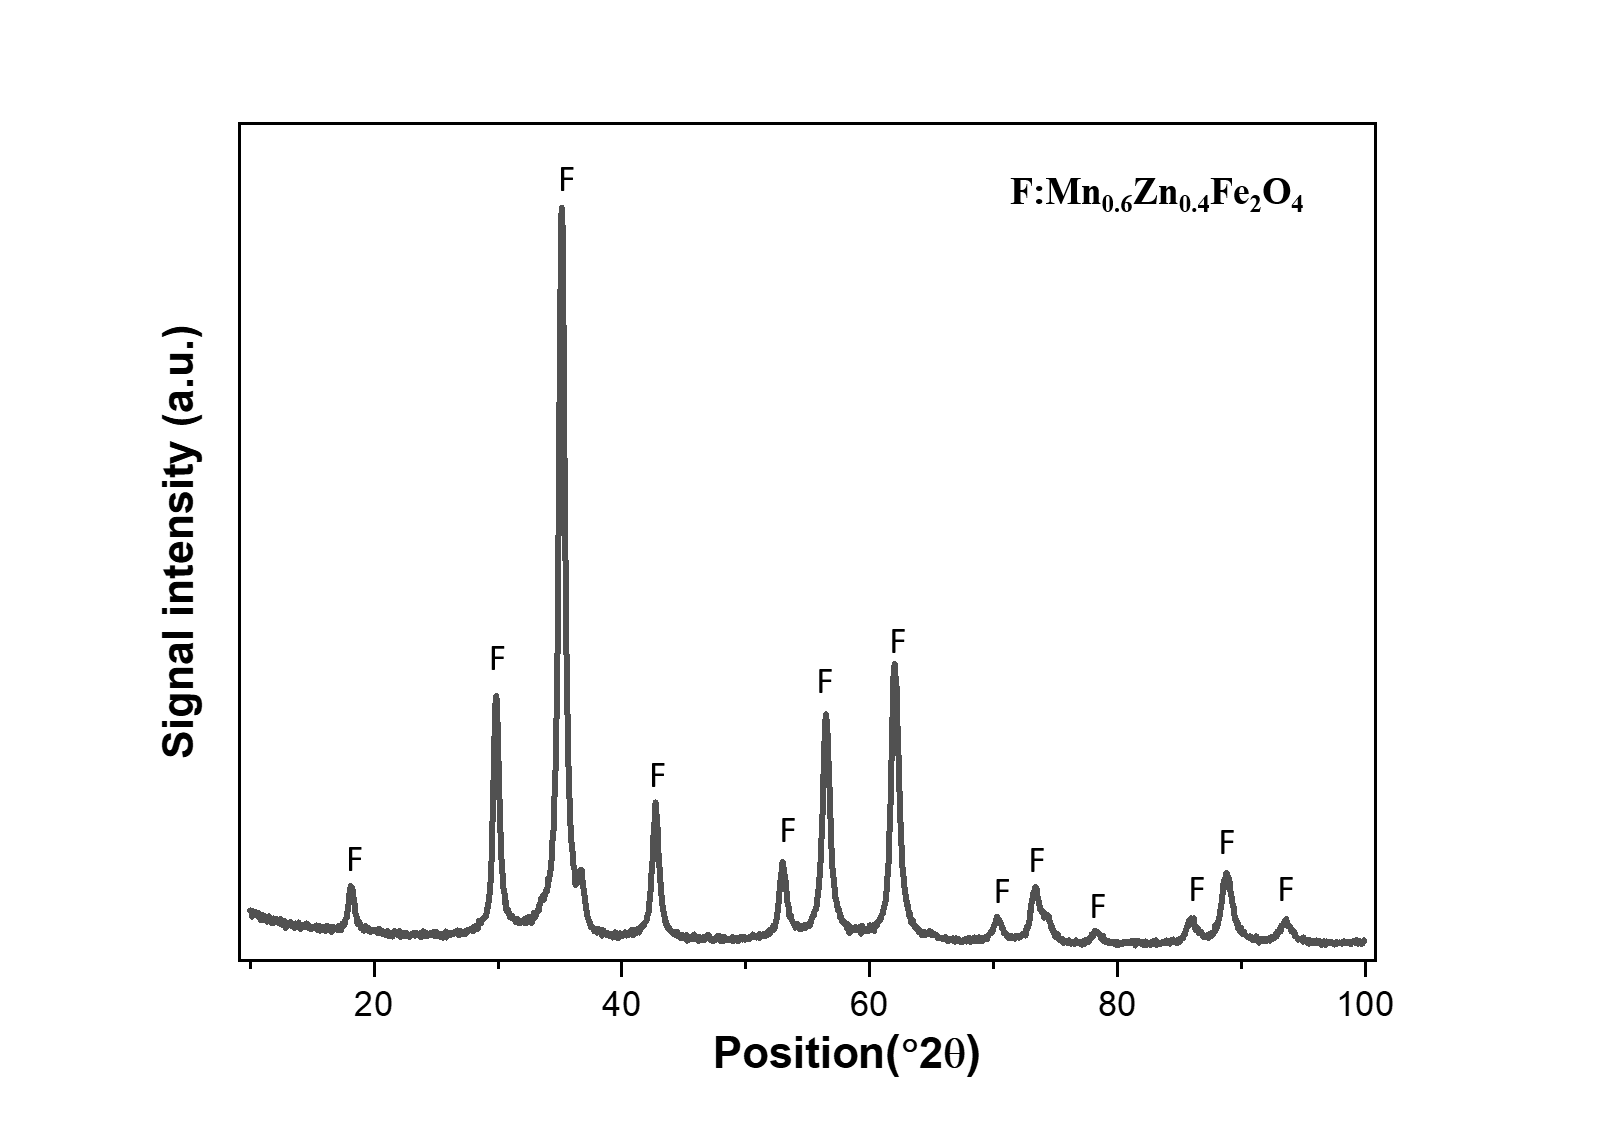
Figure 1. X-Ray Diffraction pattern of EuMZF
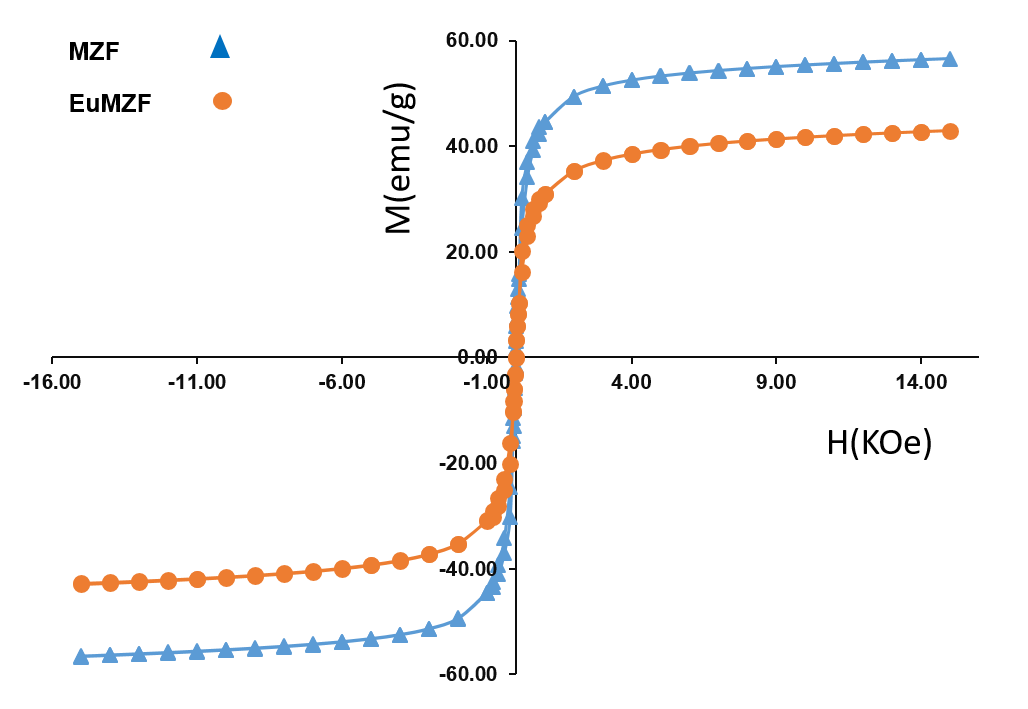
Figure 2. M-H curves of dried powders for MZF and EuMZF.
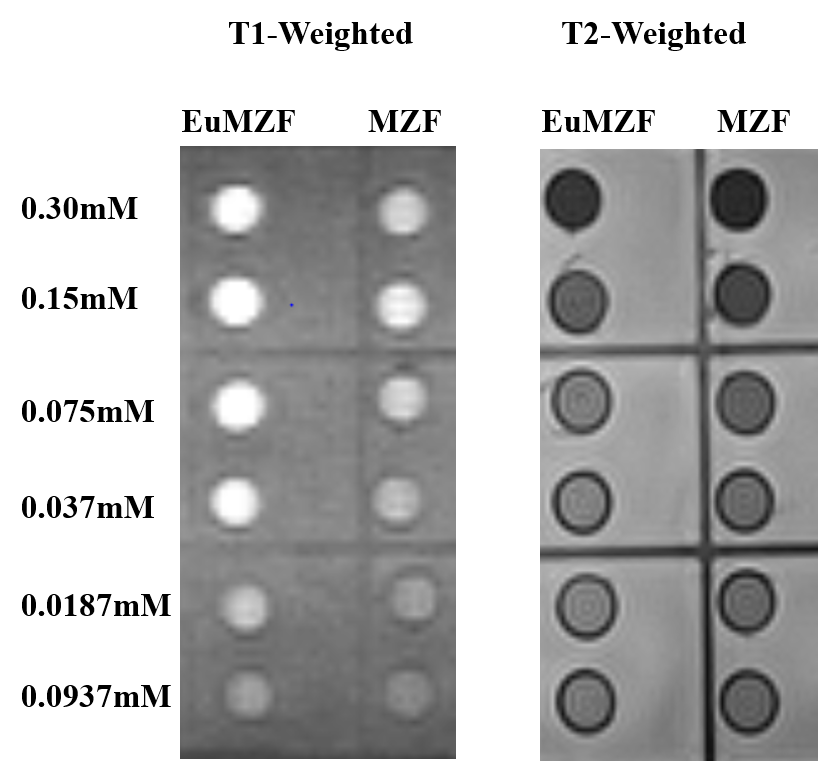
Figure 3. T1- and T2-weighted images of MZF and EuMZF at 3T
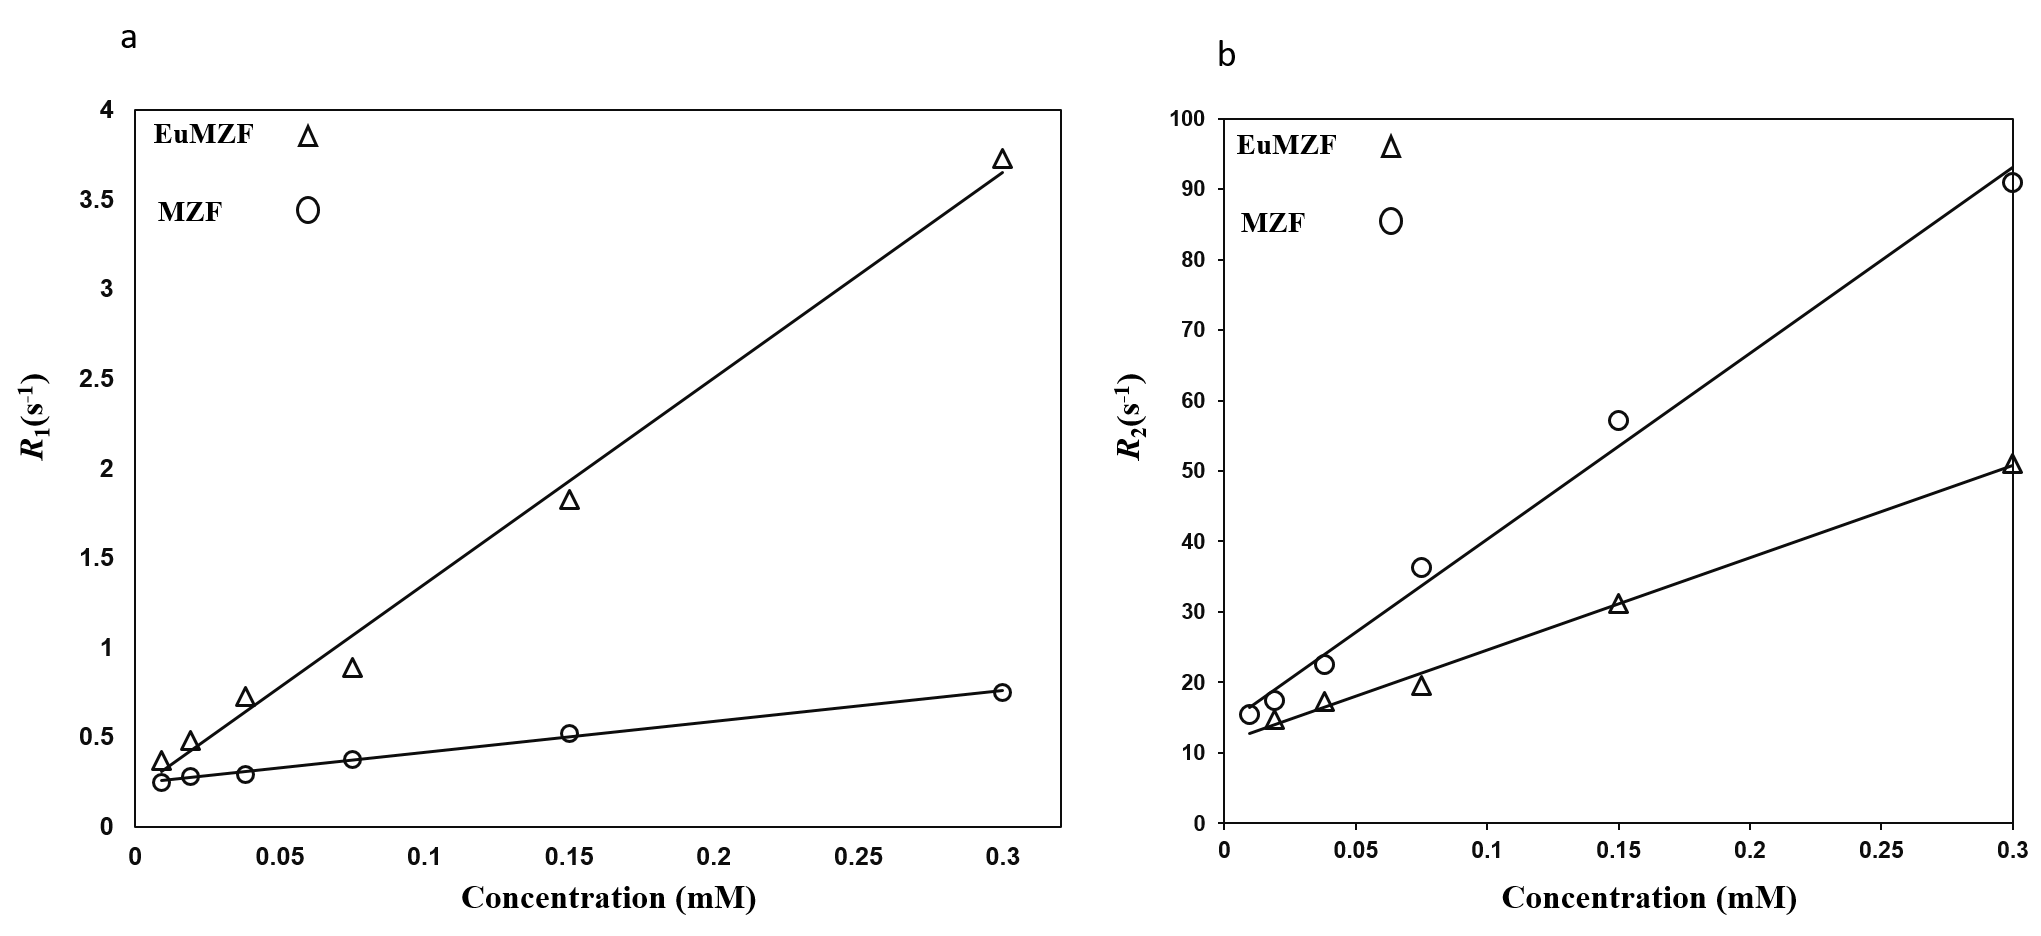
Figure 4. The variation of the relaxation rates (a) R1 and (b) R2 as a function of concentration for MZF and EuMZF samples at 3T.

Table 1: r1, r2 and r2/r1 for EuMZF sample at different magnetic field strengths of 1.5, 3, 7, and 9.4T.