4875
Towards cell-size and switchable magnetocaloric MRI contrast agents using micofabricated thin-film FeRh.1Laboratory of Functional and Molecular Imaging, NINDS, National Institutes of Health, Bethesda, MD, United States, 2Ceitec Magnetism, Central European Institute of Technology, Brno, Czech Republic, 3Uniformed Services University of the Health Sciences, Bethesda, MD, United States, 4NYU Langone Health - Tech4Health Institute, New York, NY, United States
Synopsis
Keywords: Contrast Agent, Cell Tracking & Reporter Genes, Magnetocaloric material
We present progress towards smaller magnetocaloric samples, that drastically change magnetic moment and hence T2* contrast when switched with external magnetic field or temperature, with the eventual goal of achieving a size appropriate for cell tracking. To that end a FeRh sample was microfabricated with a thickness of 200 nm, and patterned with varying linear dimensions from 500 micron down to 1 micron square. We demonstrate that this sample may be switched with temperature and with external field through imaging at 4.7 and 11.7T and with the application of pulsed B0 insert coil.Introduction
Cell-sized MRI labels with user-switchable contrast ratio would be an attractive development for cell tracking and functional imaging. Previously, we demonstrated the possibility of using magnetocaloric materials like Iron Rhodium (FeRh) as high-contrast ratio switchable agents for generating a controllable T2* MRI contrast, either with temperature, external field, or focused ultrasound (1-3) to distinguish from other endogenous T2* contrast (e.g. blood). However, all the previous results were obtained with “macroscopic” labels with dimensions above 100µm. In this work we explore whether biological-cell-sized (~10µm) magnetocaloric materials can be fabricated, whether they can be imaged in MRI, and whether their contrast in the scanner can be controllably switched with either in situ temperature or field shifters. We demonstrate that lithographically patterned 200-nm thin film FeRh sample may readily generate contrast down to sub-10µm FeRh particle size. We also demonstrate the characteristic sharp phase transition with temperature of these cell-sized magnetocaloric MRI labels. Finally, we explore and find evidence that an additional in situ B0 field shifter also induces label contrast change.Methods
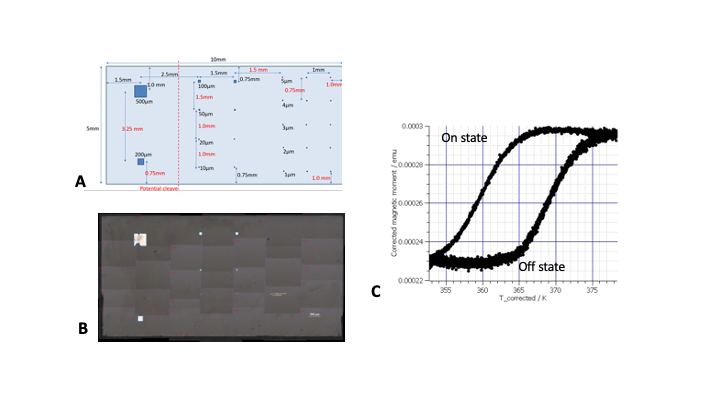
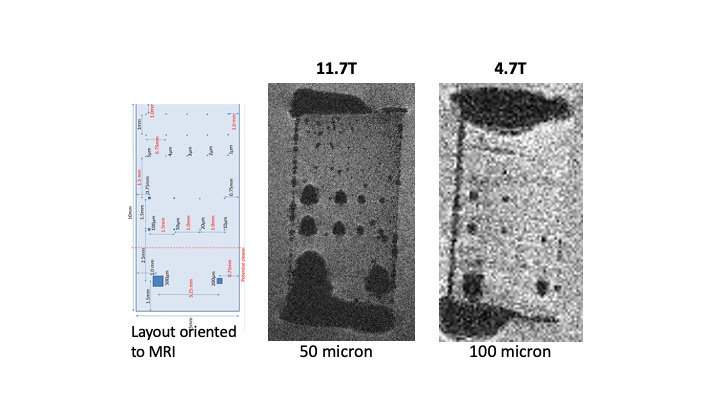
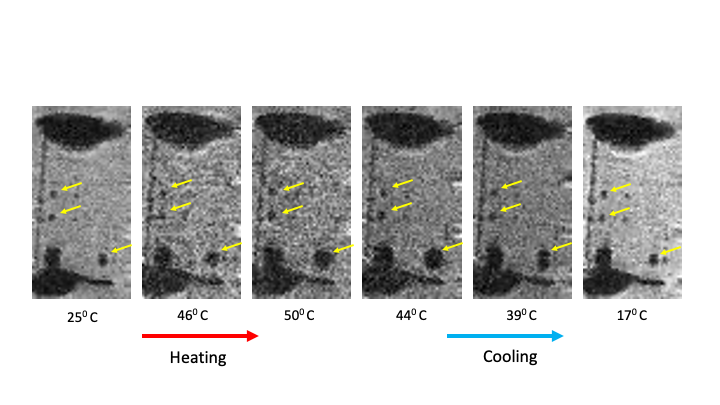
An epitaxial 200-nm-thick FeRh film was grown on MgO (001) substrates at 450 °C and an argon pressure of 2 mTorr by d.c. magnetron sputtering using an equiatomic target. The film was post-annealed at 800 °C for 45 min and subsequently coated with a 2-nm Pt layer. The FeRh film was patterned into microstructures (Layout in Figure 1) by e-beam lithography and ion-beam etching through a Ti/SiO2 mask. The sample was finally coated with a protective 100-nm-thick SiO2 film. Vibrating sample magnetomer measurement (VSM) in a field of 1T during a temperature sweep is shown in 1B. Baseline gradient-echo MR images (TR/TE=30/10 ms) of the thin film patterned FeRh sample shown in Figure 1, at 11.7T (at 50µm isotropic) and then at 4.7T (100 µm isotropic) at room temperature (~20 degrees C), In these conditions we considered the sample to be in the 'off' low magnetic moment state at 4.7T and in the 'on' high magnetic moment state at 11.7T. To observe the magnetic phase transition, we performed a temperature sweep at 4.7T. The sample tube temperature was controlled with a circulating water bath, and then serial images were acquired during a heating and cooling cycles. A fiber-optic temperature probe was attached to the platform holding the sample. After determining the transition temperature, we performed a preliminary experiment was performed to see if a change in B0 field within the 4.7T magnet could cause a moment change. To this end, a shielded B0 insert coil (Resonance Research Inc, Boston) driven by remotely controlled programmable power supplies was used. The sample was warmed just below the transition temperature point determined from the temperature sweep, temperature stability was monitored for 15 minutes, and MR images were acquired before and after a 0.11T pulse (40 A current), was applied for 2 seconds.Results and Discussion
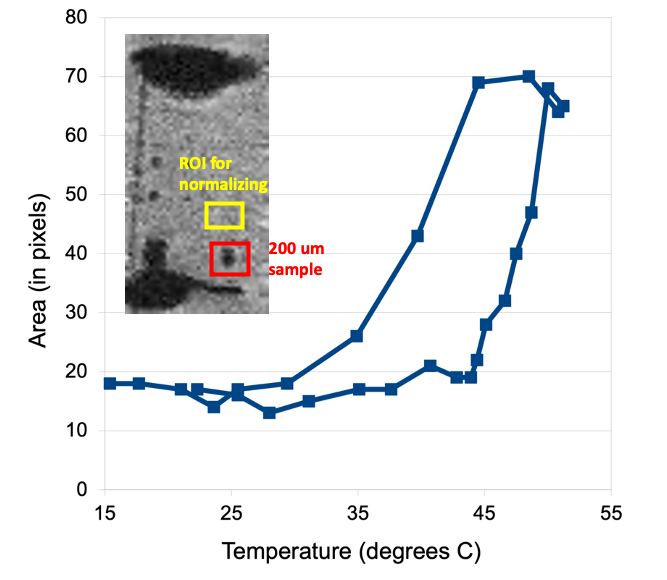
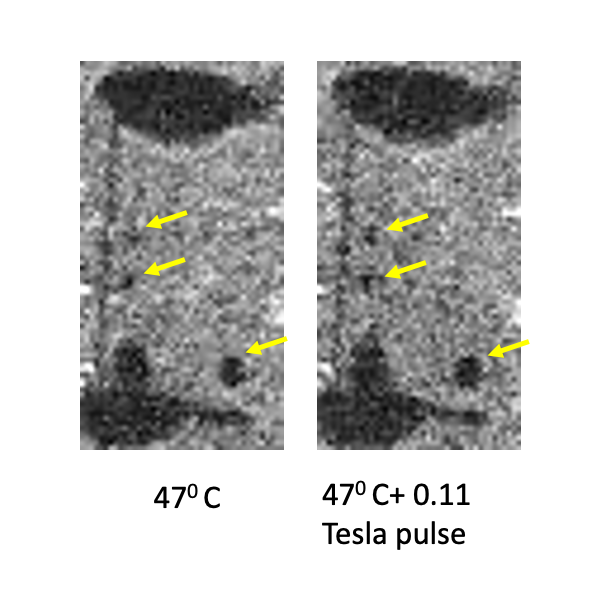
With the initial baseline MRIs in Figure 2, one can observe the larger particle signatures from being in the higher field where they would be in their ‘on’ state. There are artifacts from possible air bubbles being trapped under the sample slide, but the pattern is readily visible down to 2-3 microns in the 50 µm resolution image at 11.7T. At 4.7T, the sample signatures are smaller (approximately half the size in linear distance), which is typical of our ‘off’ state. Only 50 µm or larger samples are visible at this point.The temperature sweep at 4.7T, shown in Figure 3, starting around room temperature (which was determined to be in the ‘off’ state from our baseline images), up to about 50 degrees C demonstrated a significant change in the particle signatures. The area of the 200 µm particle was measured, normalized to the surrounding water, (a threshold of 30% less than mean intensity of the nearby unaffected ROI was used). This is plotted in figure 4. We note the characteristic curve of FeRh we have observed in our previous studies, with a mid-transition temperature of 48 degrees C. As a preliminary test of switching the material with a change of the magnetic field using a 1T coil insert. An increase in the area of the signature from the 200 µm particle of 45% was measured, indicative of a partial shift. The B0 insert is rated to generate a 1T field which we will move toward in future experiments, and it should be sufficient to fully switch the material when close to the transition point.
Conclusion
We have demonstrated that micron scale magnetocaloric particles can be used ot modulate MRI contrast with a change in temperature the a fixed imaging field and have opened the possibility of switching the field in the magnet to change moment at a fixed temperature. The patterned FeRh sample was only 200 nm thick and particles down to 10 microns could be detected opening the possibility of labeling biological cells. The characteristic FeRh moment vs temperature curve was observed in larger sample pieces, and we could see the difference in the smaller pieces between the ‘on’ and ‘off’ states with images at 11.7T and 4.7T. We also demonstrated the potential for switching with an additional pulsed external field.Acknowledgements
We would like to thank the NIH Intramural Research Program for support, and the Mouse Imaging Facility at NIH for the use of the 4.7T system.References
M. Barbic, S. Dodd, H. D. Morris, N. R. Dilley, B. Marcheschi, A. Huston, T. D. Harris, and A. P. Koretsky, “Magnetocaloric Materials as Switchable High Contrast Ratio MRI Labels” Magnetic Resonance in Medicine 81, 2238 (2019).
G. W. Miller, Y. Gilbo, S. J. Dodd, A. P. Koretsky, H. ElBidweihy, and M. Barbic, “Selective fast focal switching of high-contrast-ratio magnetocaloric MRI labels with focused ultrasound” Proc. Intl. Soc. Mag. Reson. Med. 28, 4119 (2020).
M. Barbic, S. Dodd, H. ElBidweihy, N. R. Dilley, B. Marcheschi, A. L. Huston, H. D. Morris, and A. P. Koretsky, “Multifield and Inverse-Contrast Switching of Magnetocaloric High Contrast Ratio MRI Labels” Magnetic Resonance in Medicine 85, 506 (2021).
Figures