4872
Dependency of R2 and R2* on Gd-DTPA Concentration: From Whole-Blood to Realistic Brain Tumor Vasculature1C. J. Gorter MRI Center, Department of Radiology, Leiden University Medical Center, Leiden, Netherlands, 2Radiology and Nuclear Medicine, Erasmus University Medical Center, Rotterdam, Netherlands, 3University Grenoble Alpes, Inserm, U1216, Grenoble Institut Neurosciences, Grenoble, France, 4Medical Delta, Delft, Netherlands, 5Brain Tumor Center, Erasmus MC Cancer Institute, Rotterdam, Netherlands, 6Radiology, Leiden University Medical Center, Leiden, Netherlands
Synopsis
Keywords: Simulations, DSC & DCE Perfusion
In quantitative DSC-MRI, the concentration-time course is obtained from the MR signal changes following a bolus injection of contrast agent. The generally assumed linear relationship between ΔR2* and contrast agent concentration is not always valid. In this study a realistic 3D simulation model was used to establish the characteristics of this relationship in whole-blood and brain tumor tissue. The results show an improved performance of the 3D simulation model compared to its 2D version. In addition, the relationship between ΔR2* and contrast agent concentration appeared to be dependent on the B0 direction and MR sequence.
INTRODUCTION
Quantitative analysis of dynamic susceptibility contrast MRI (DSC-MRI) data requires the measurement of the arterial input function (AIF) as well as the tissue concentration-time course , which are frequently obtained by assuming a linear relationship between the contrast agent concentration and ΔR2* (1). However, this relationship differs between whole-blood and tissue, is dependent on the MR sequence (gradient-echo or spin-echo), and might be dependent on the orientation of the vasculature in the main magnetic field2. Continuing on previous work using a 2D simulation model3, where it was shown that this relationship in whole-blood depends on the shape and orientation of the red blood cells, we make use of an extended version of the simulations to 3D as developed previously4. Besides the whole-blood geometry, we include realistic 3D models of unique brain tumor vasculature segmentations from high-resolution micro-Doppler ultrasound5 as input to the simulations to study the relationship between [Gd] and ΔR2(*) for both gradient-echo and spin-echo sequences. Finally, we investigate the influence of the orientation of the vasculature with respect to B0.METHODS
The 3D simulation model4 continues on the open-source code available on GitHub (https://github.com/nifm-gin). Conceptually the 3D simulation tool is similar to the 2D version, describing the effect of magnetic field changes, diffusion of water within these field changes, blood flow, contrast agent permeability and diffusion of contrast agent. In our experiments, we simulated impermeable vessels. Table 1 describes the simulation parameters.Whole-blood level
The relationship between [Gd] and ΔR2* was studied for a hematocrit of 36%, field strength of 1.5T, and gradient-echo sequence. A linearly increasing [Gd] was modeled and ΔR2* was derived from the following equation:
$$$ \triangle{R}_2^*(t)=-\frac{1}{TE}*\ln(|\frac{S(t)}{S_{base}}|) $$$ (1)
The results were compared with the in vitro data1 as well as previous work in 2D3.
Tissue level
First, randomly oriented vessels with different length, radius and oxygenation following a Gaussian distribution were simulated. Secondly, high-resolution micro-Doppler ultrasound images of the tumor’s vasculature were obtained intra-operatively. Post-processing of these images and segmenting the vascular structures was performed using 3D slicer. A smoothing Gaussian filter was used for denoising and subsequently thresholding was performed. Since the ultrasound probe was not sensitive to detect the smallest capillaries, we mimicked these by adding randomly oriented infinite cylinders until a realistic blood volume fraction of 6% was reached.
A first passage following a double bolus injection of Gd was simulated with impermeable vessels. The influence of the vessel geometry, MR sequence and the orientation of the vasculature with respect to B0 was studied. The latter was studied by varying the direction of B0.
RESULTS
Whole-blood level
Figure 1 shows the relationship between ΔR2* and [Gd] in whole-blood, where the 3D simulations with B0 in the z-direction, agreed quite well with the in vitro data up to a concentration of 12 mM. The 3D results seemed more similar to the in vitro data as compared to 2D simulations. Notice that when B0 is oriented in x or y-direction, the 3D curve approached the 2D simulation results.
Tissue level
Figure 2 shows the ΔR2* versus time curves for the different vascular networks, which were comparable to each other. The influence of the vessel orientation with respect to B0 is illustrated in Figure 3. The relaxivity was slightly lower when B0 is in the x or y-direction, compared to the z-direction. There was no difference between the curves for B0 in x-direction or y-direction. Figure 4 shows the influence of the MR sequence. For both gradient-echo and spin-echo sequences the relationship between ΔR2* and [Gd] approximated a linear relation.
DISCUSSION
In this work we studied the relationship between ΔR2(*) and [Gd] both in whole-blood and tissue using a realistic 3D simulation model. On the whole-blood level, the 3D results corresponded well with the in vitro data, especially compared to the 2D simulations. The drawback of the latter is that the magnetic field was averaged over 3 directions, while in the 3D simulations the magnetic field direction can be realistically simulated. This averaging could also explain why the 3D curves in the x-y direction are closer to the 2D results.In the next step, we incorporated vessel segmentations from astrocytoma tumors of different grade obtained intra-operatively with Doppler ultrasound. Interestingly, the vascular structures were quite different, though the smallest vessels were not detected by the ultrasound probe. Although some differences were seen at low contrast concentrations, the ΔR2* curves for the different vascular networks were similar. This was slightly unexpected, since the vessels from the ultrasound data are approximately parallel to the magnetic field, therefore extravascular magnetic field perturbations would be limited, reducing relaxivity. Further research will be performed with ultrasound data from different tumor types that are registered to MRI. Overall, the relaxivity values agree quite well with the paper of Kjølby et al.2. The curves for B0 in x-y direction were the same, which results from the rotational invariance of magnetic field perturbations of blood vessels that are approximately in the z-direction.
CONCLUSION
Our findings highlight the importance of using a realistic 3D model of the vasculature to study the relationship between ΔR2(*) and [Gd], which may allow for improved quantitative information on brain tumor perfusion.Acknowledgements
We are thankful to NWO domain AES (project 17079) and Medical Delta Cancer Diagnostics 3.0 for their support.References
1. van Osch MJP, Vonken EPA, Viergever MA, van der Grond J, Bakker CJG. Measuring the arterial input function with gradient echo sequences. Magn Reson Med. 2003;49(6):1067-1076. doi:10.1002/mrm.10461
2. Kjølby BF, Østergaard L, Kiselev VG. Theoretical model of intravascular paramagnetic tracers effect on tissue relaxation. Magn Reson Med. 2006;56(1):187-197. doi:10.1002/mrm.20920
3. van Dorth D, Venugopal K, Poot DHJ, et al. Dependency of R2 and R2* relaxation on Gd-DTPA concentration in arterial blood: Influence of hematocrit and magnetic field strength. NMR Biomed. 2022;35(5):e4653. doi:10.1002/NBM.4653
4. Delphin A, Boux F, Brossard C, et al. Using 3D realistic blood vessel structures and machine learning for MR vascular Fingerprinting. In: Joint Annual Meeting ISMRM-ESMRMB & ISMRT 31st Annual Meeting. ; 2022.
5. Soloukey S, Vincent AJPE, Satoer DD, et al. Functional Ultrasound (fUS) During Awake Brain Surgery: The Clinical Potential of Intra-Operative Functional and Vascular Brain Mapping. Front Neurosci. 2020;13:1384. doi:10.3389/FNINS.2019.01384/BIBTEX
6. Kinnunen M, Kauppila A, Karmenyan A, Myllylä R. Effect of the size and shape of a red blood cell on elastic light scattering properties at the single-cell level. Biomed Opt Express. 2011;2(7):1803-1814. doi:10.1364/BOE.2.001803
7. Spees WM, Yablonskiy DA, Oswood MC, Ackerman JJH. Water proton MR properties of human blood at 1.5 Tesla: Magnetic susceptibility, T1, T2*, T2, and non-Lorentzian signal behavior. Magn Reson Med. 2001;45(4):533-542. doi:10.1002/mrm.1072
8. Li W, van Zijl PCM. Quantitative theory for the transverse relaxation time of blood water. NMR Biomed. 2020;33(5). doi:10.1002/nbm.4207
9. Pannetier NA, Debacker CS, Mauconduit F, Christen T, Barbier EL. A Simulation Tool for Dynamic Contrast Enhanced MRI. PLoS One. 2013;8(3). doi:10.1371/journal.pone.0057636
10. Rohrer M, Bauer H, Mintorovitch J, Requardt M, Weinmann HJ. Comparison of magnetic properties of MRI contrast media solutions at different magnetic field strengths. Invest Radiol. 2005;40(11):715-724. doi:10.1097/01.rli.0000184756.66360.d3
11. Vignaud
A, Violas X, Rahmouni A, Robert P, Amadon A. Comparison of Marketed
Gadolinium-Based Contrast Agents Relaxivities on Clinical MR Scanner at 1.5T,
3T and 7T in Water and Plasma for a Large Range of Physiological Concentrations.
Vol 54.; 2010.
Figures
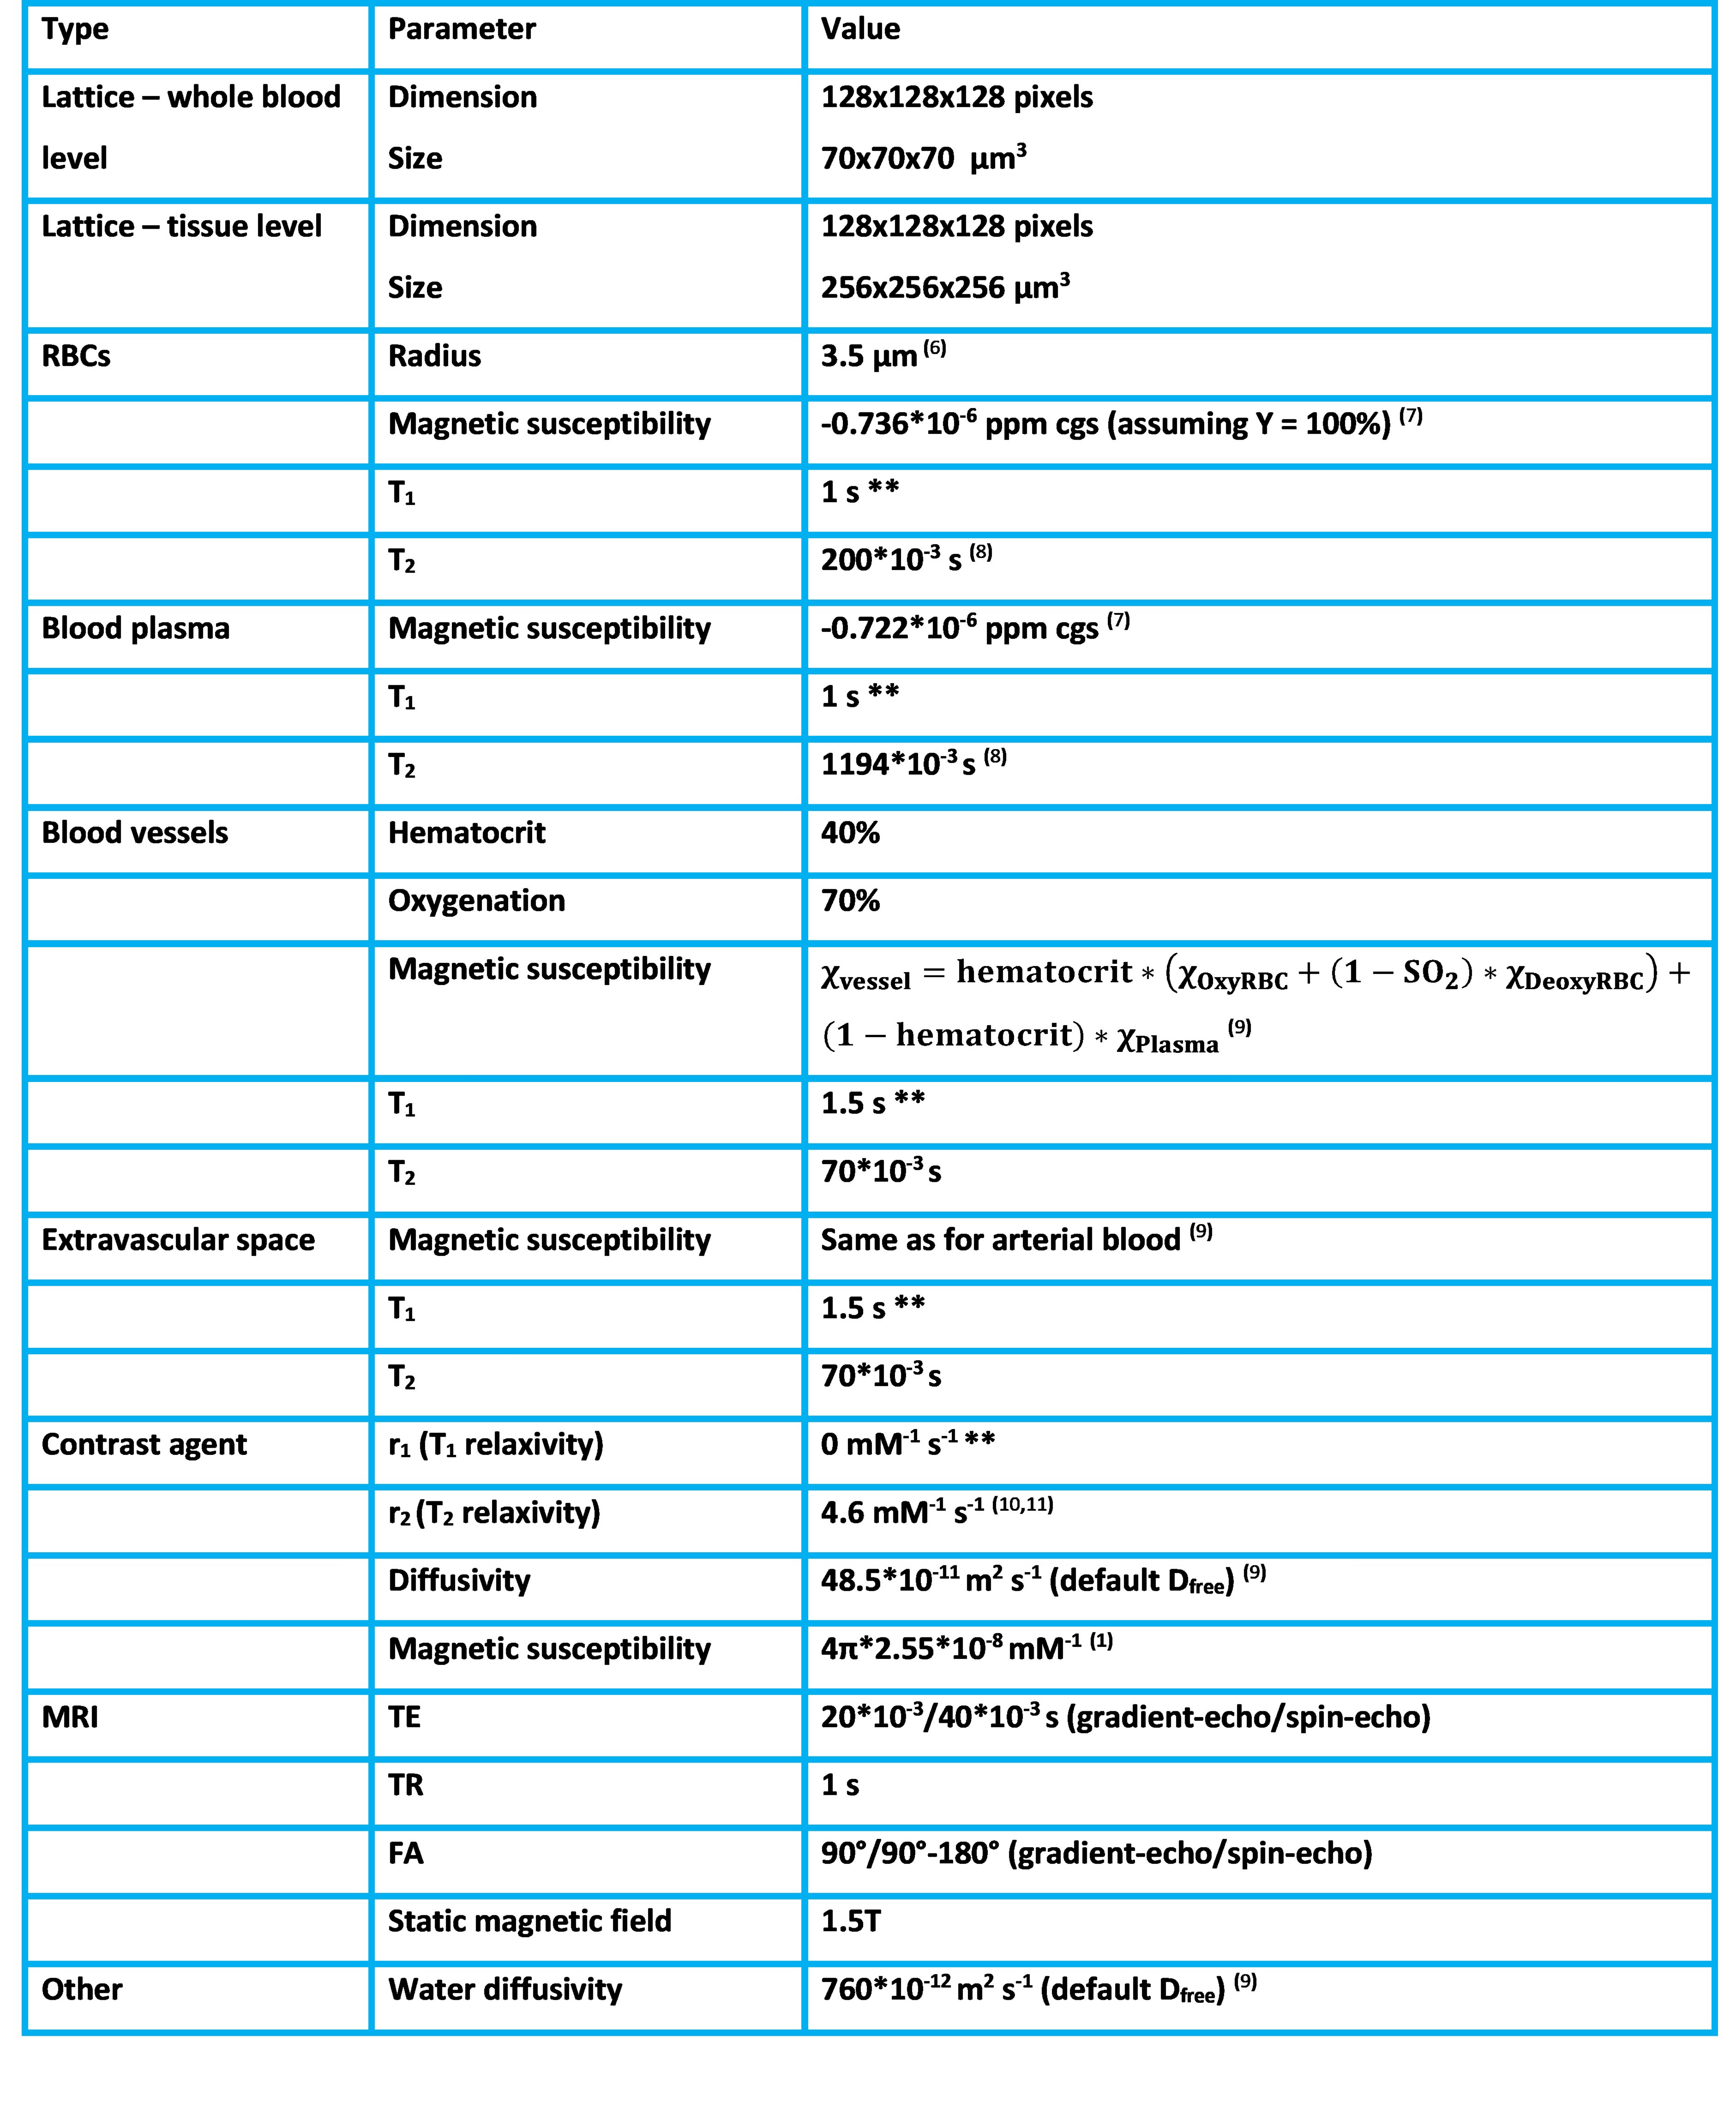
Table 1. Overview of simulation parameters. **: to minimize T1 effects to reflect complete refreshment of flowing blood.
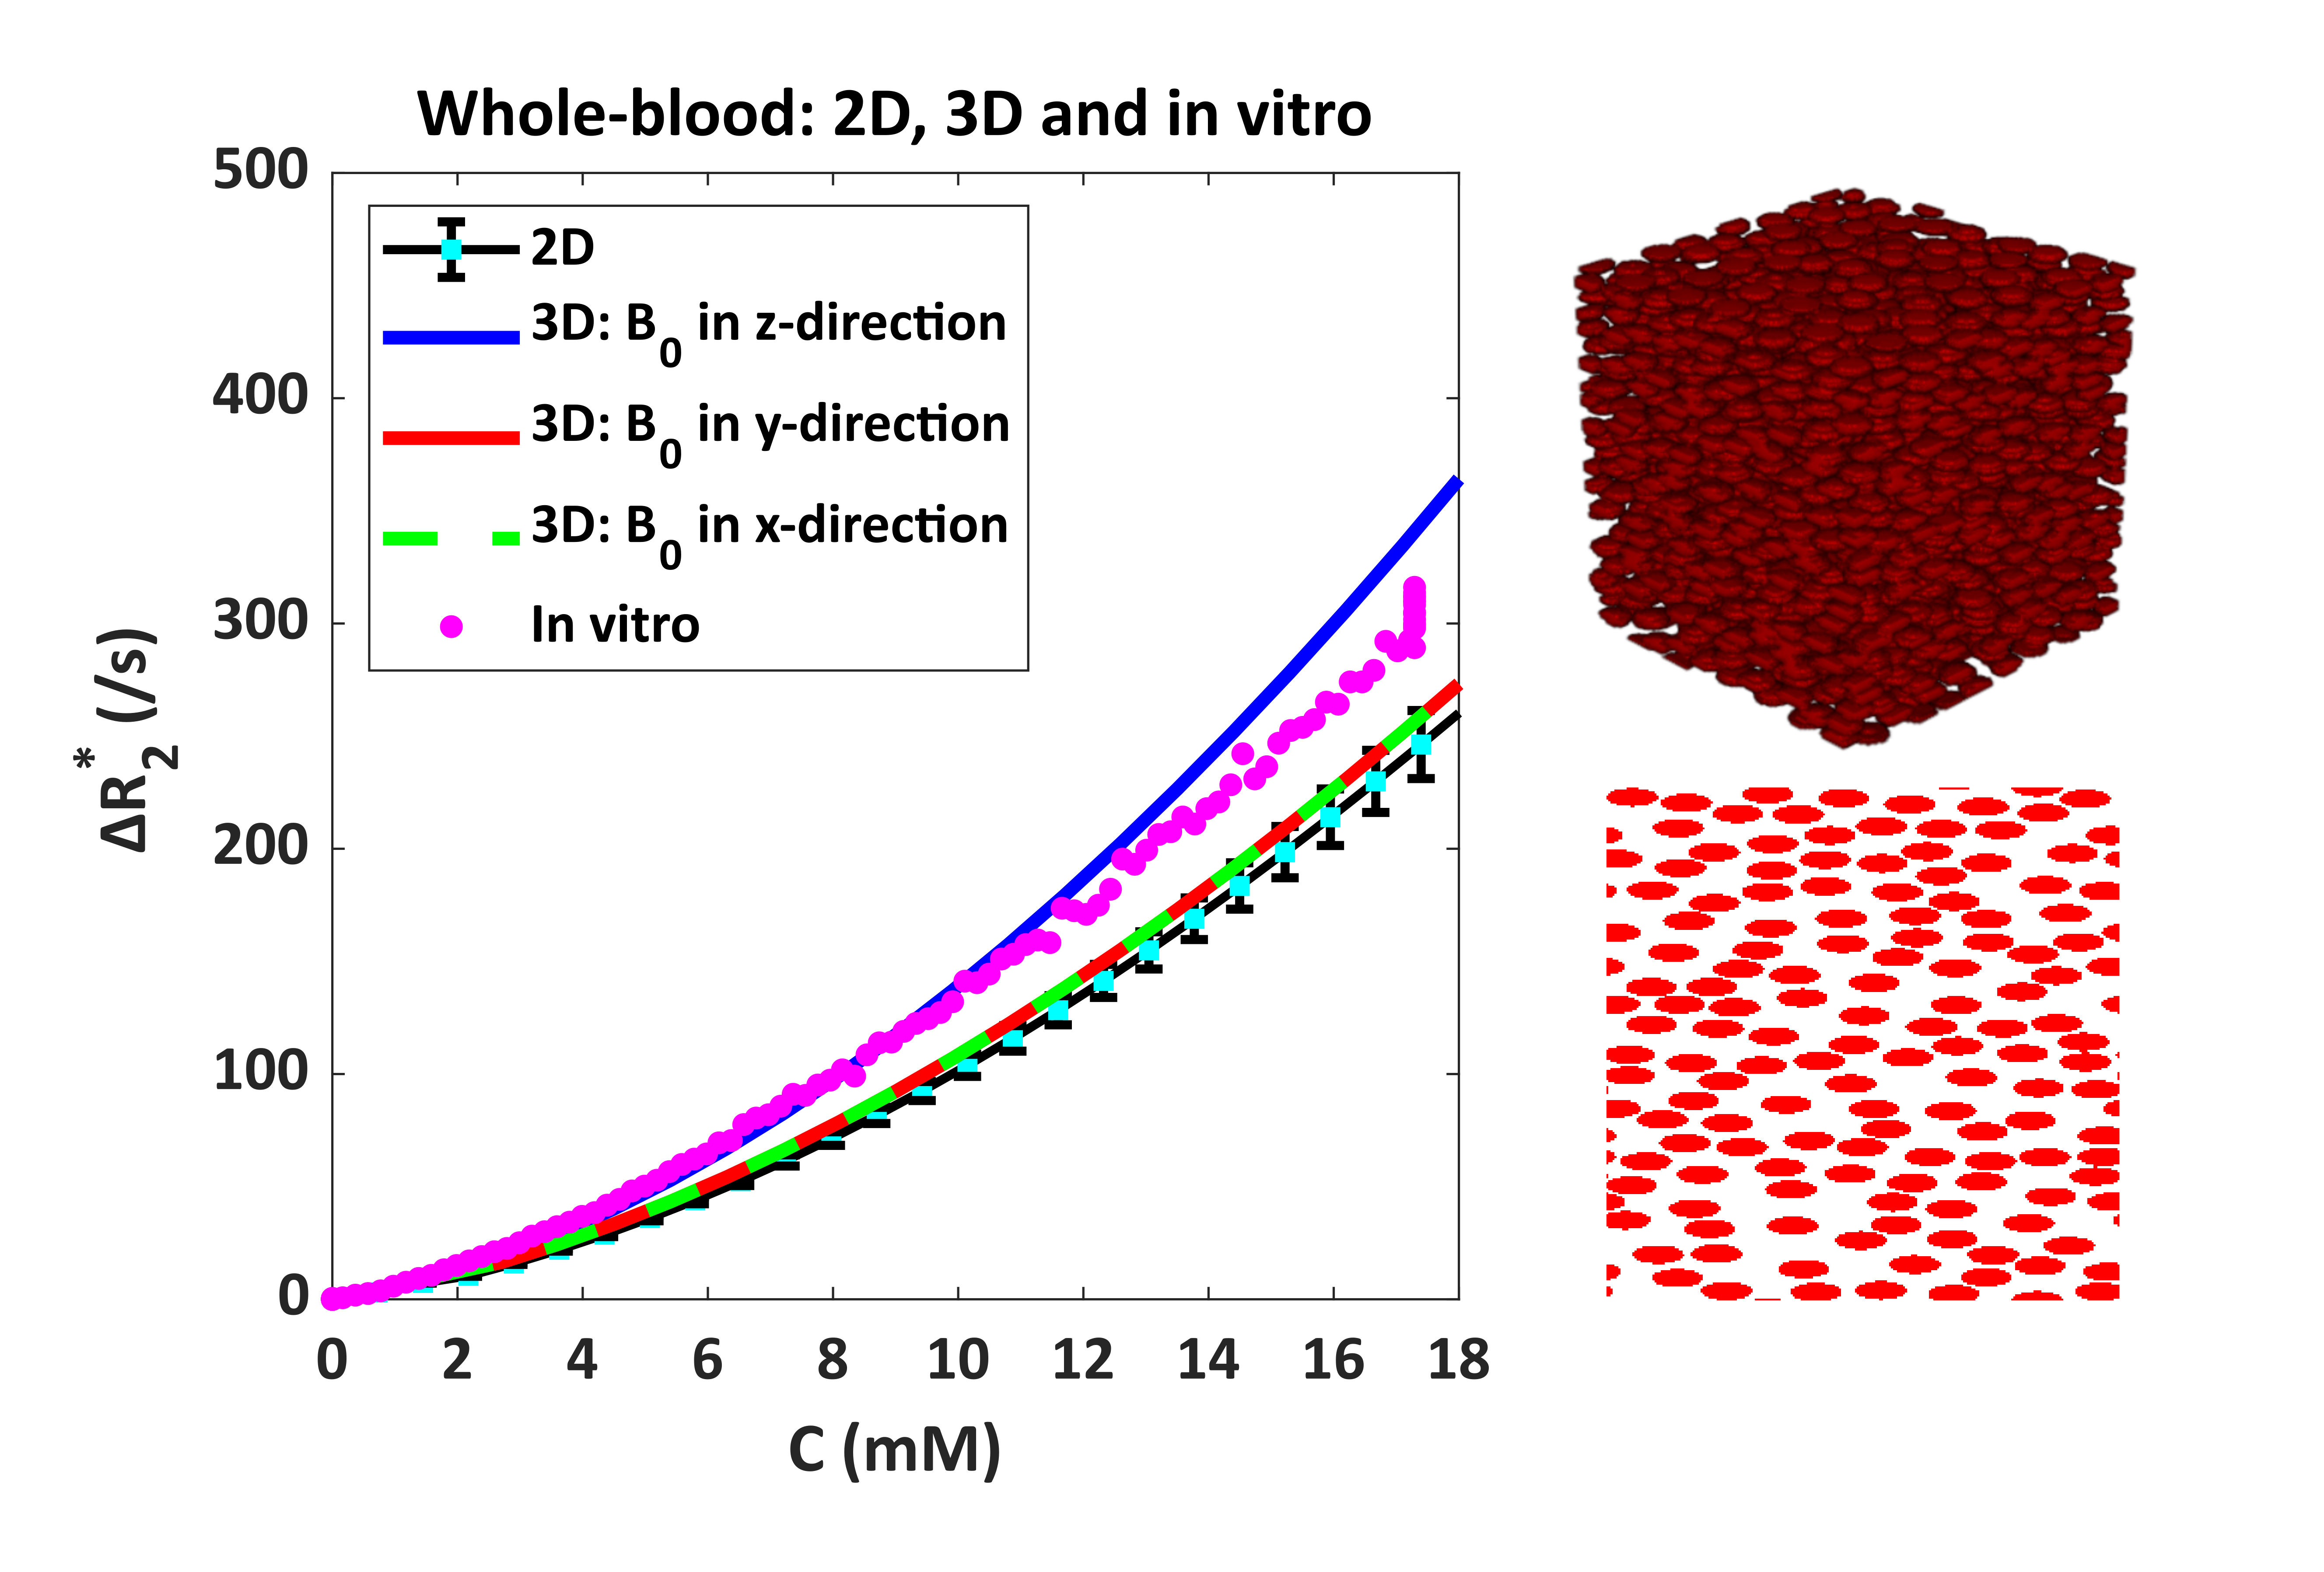
Figure 1. Relationship between ΔR2* and [Gd] in whole-blood, comparing 2D (bottom right) and 3D (top right) simulation models with the in vitro data. The 2D results include the mean and SD calculated over 5 different RBC configurations, while for the 3D simulations only a single configuration was used.
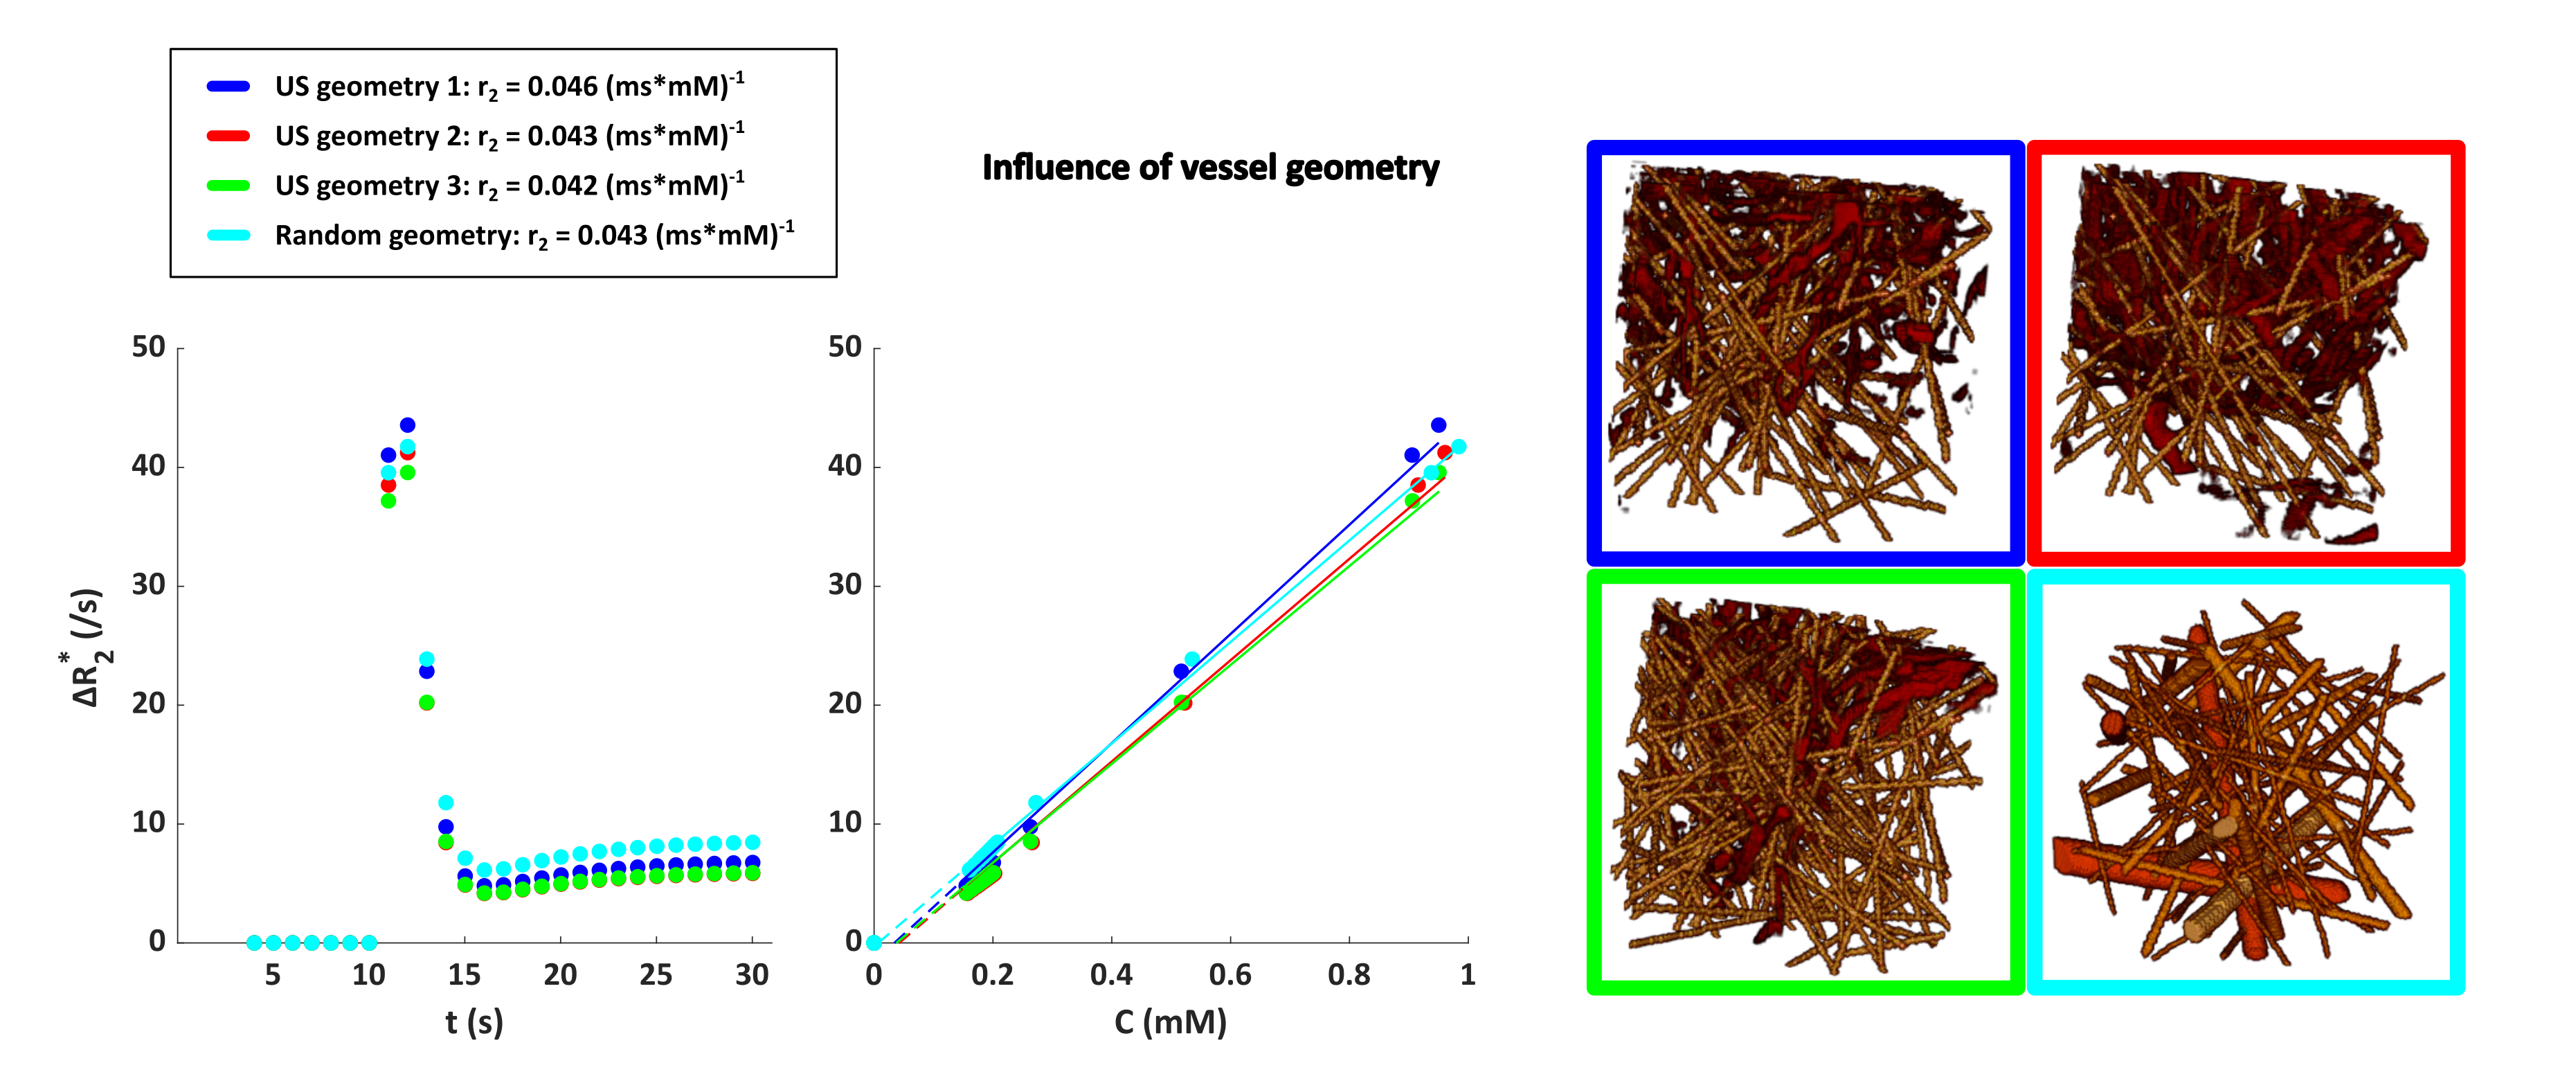
Figure 2. Influence of vessel geometry on the relationship between ΔR2* and [Gd]. The concentration on the x-axis is the tissue concentration following a double bolus injection. The vessels segmented from the intra-operative ultrasound images are depicted in red, while the capillaries are shown in yellow. The blood volume fraction is 6% for all geometries. The segmentations are obtained from patients with astrocytoma high-grade (blue), low-grade (red) and grade II (green).
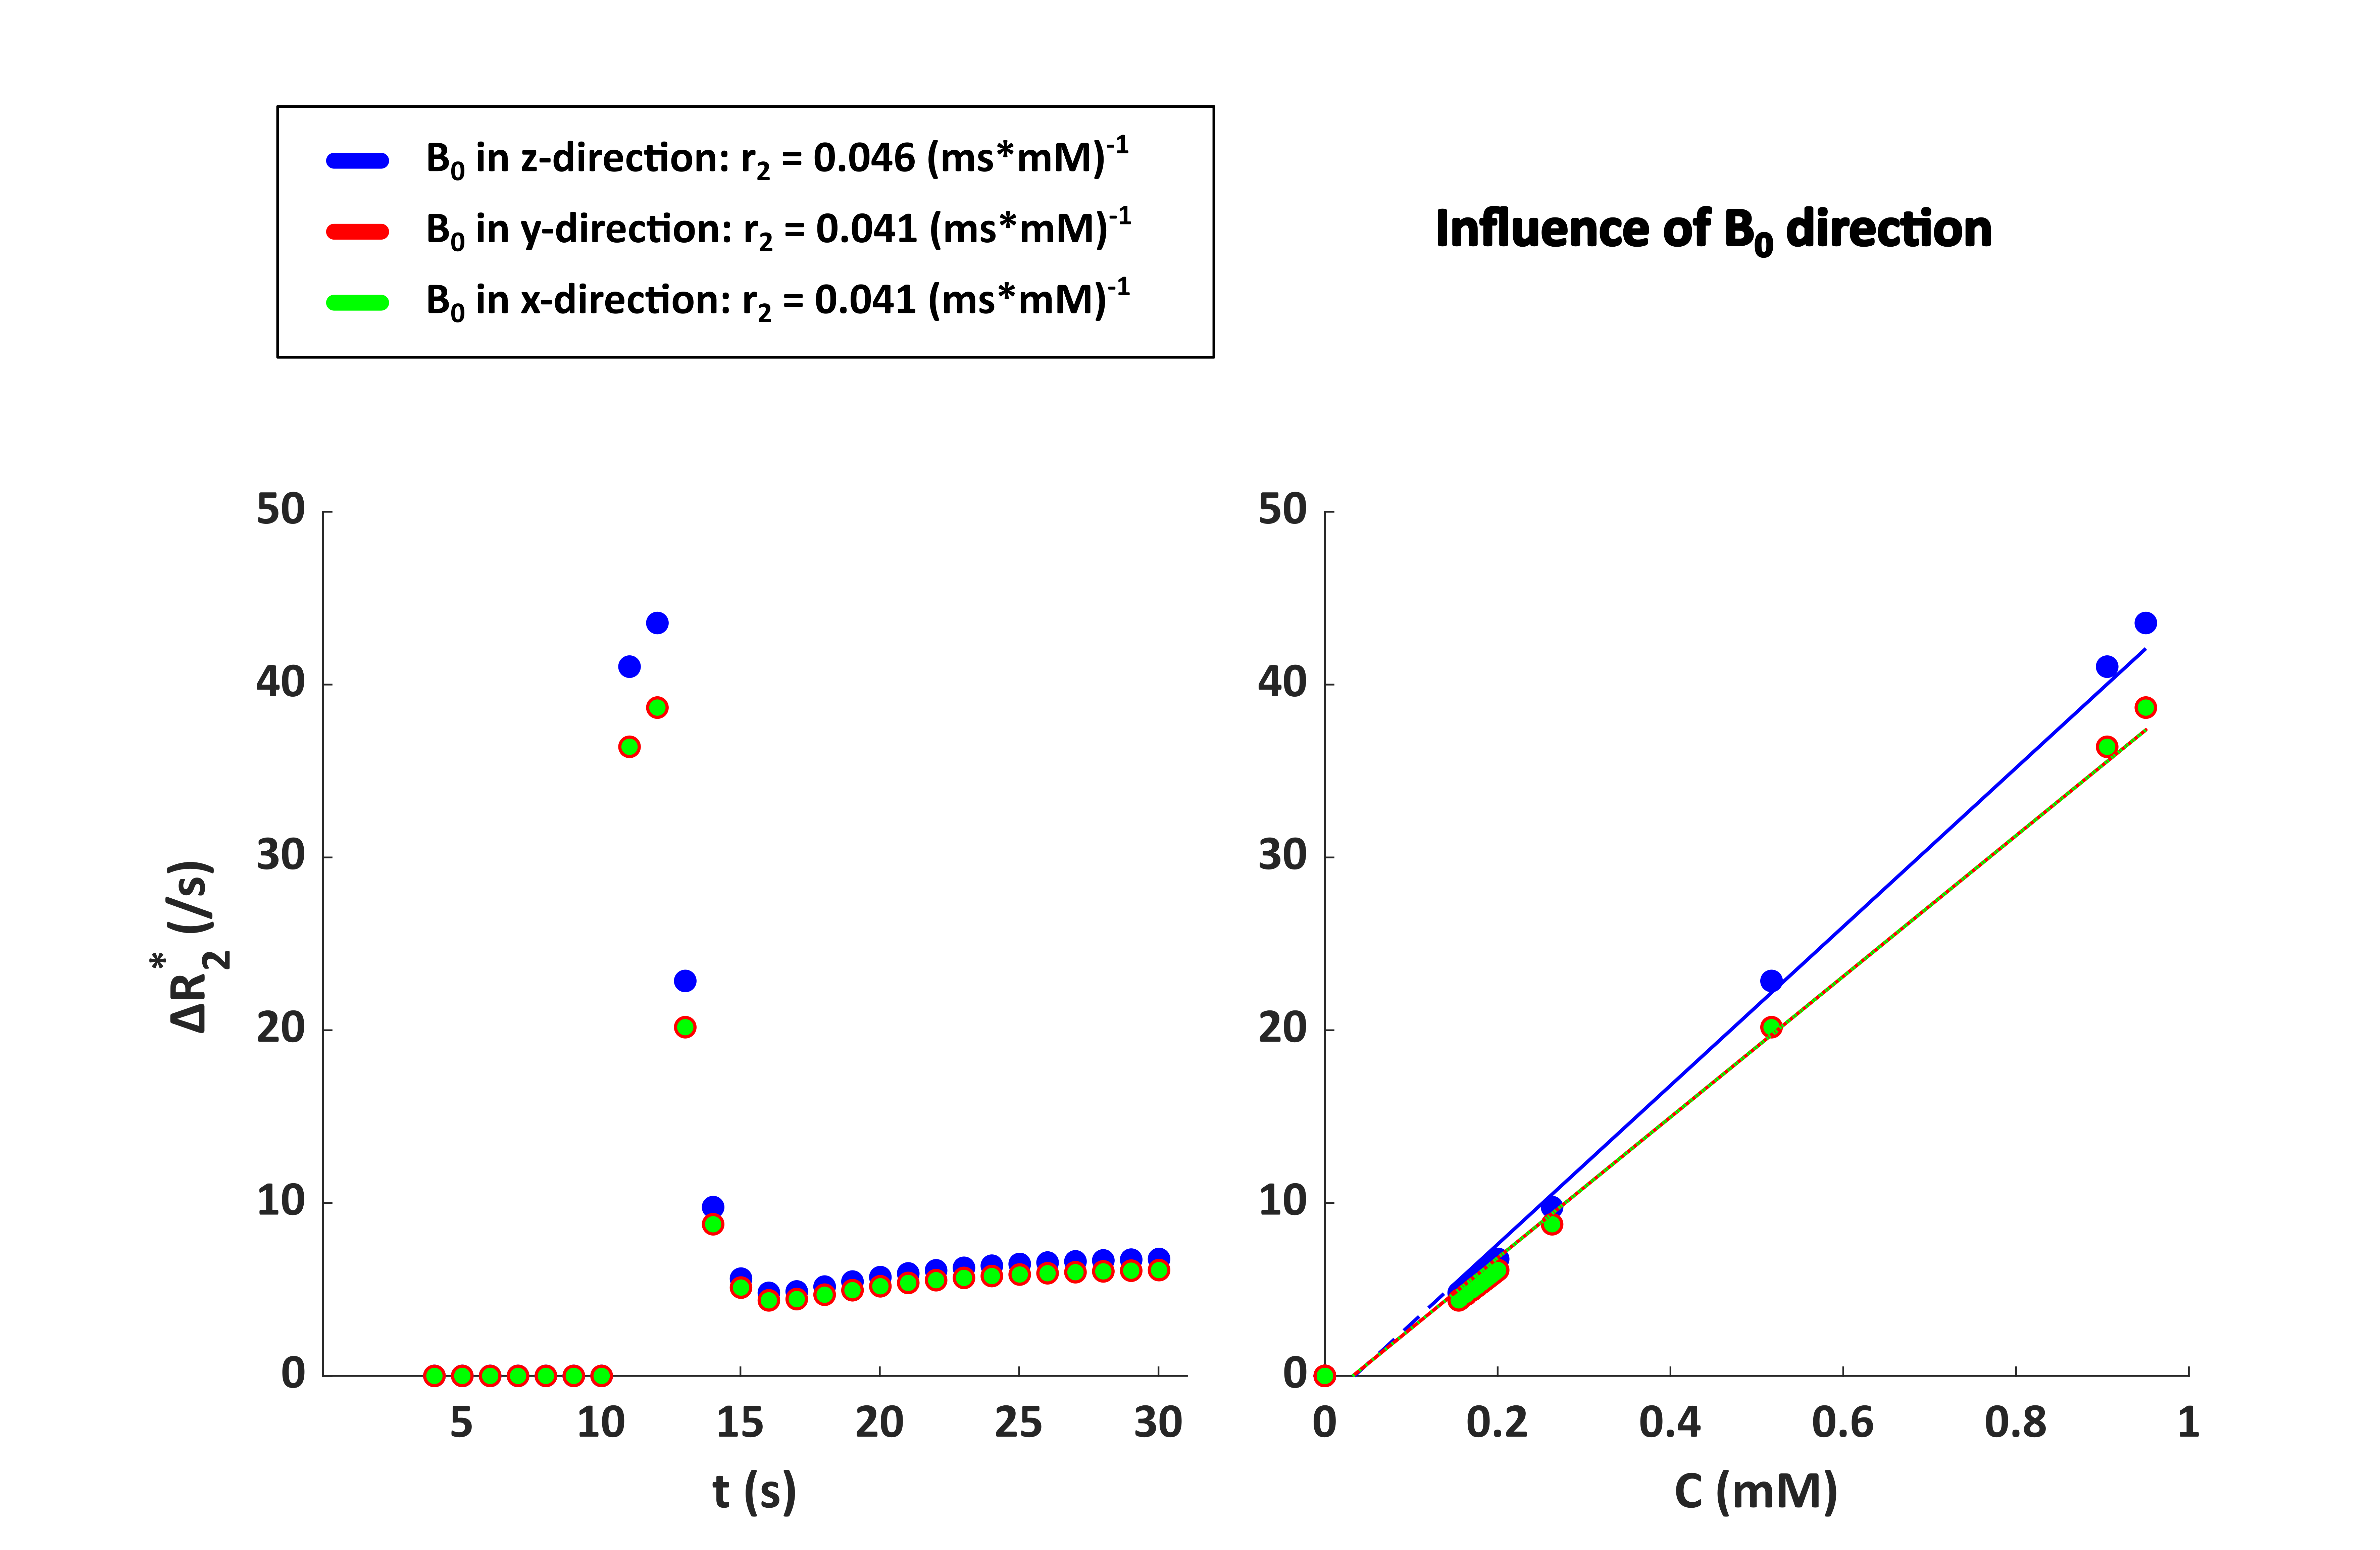
Figure 3. Influence of the vessel orientation in ultrasound geometry 1 (dark blue in Figure 2) with respect to B0 on the relationship between ΔR2* and [Gd] for a field strength of 1.5T and a hematocrit level of 40%. The concentration on the x-axis is the tissue concentration following a double bolus injection.
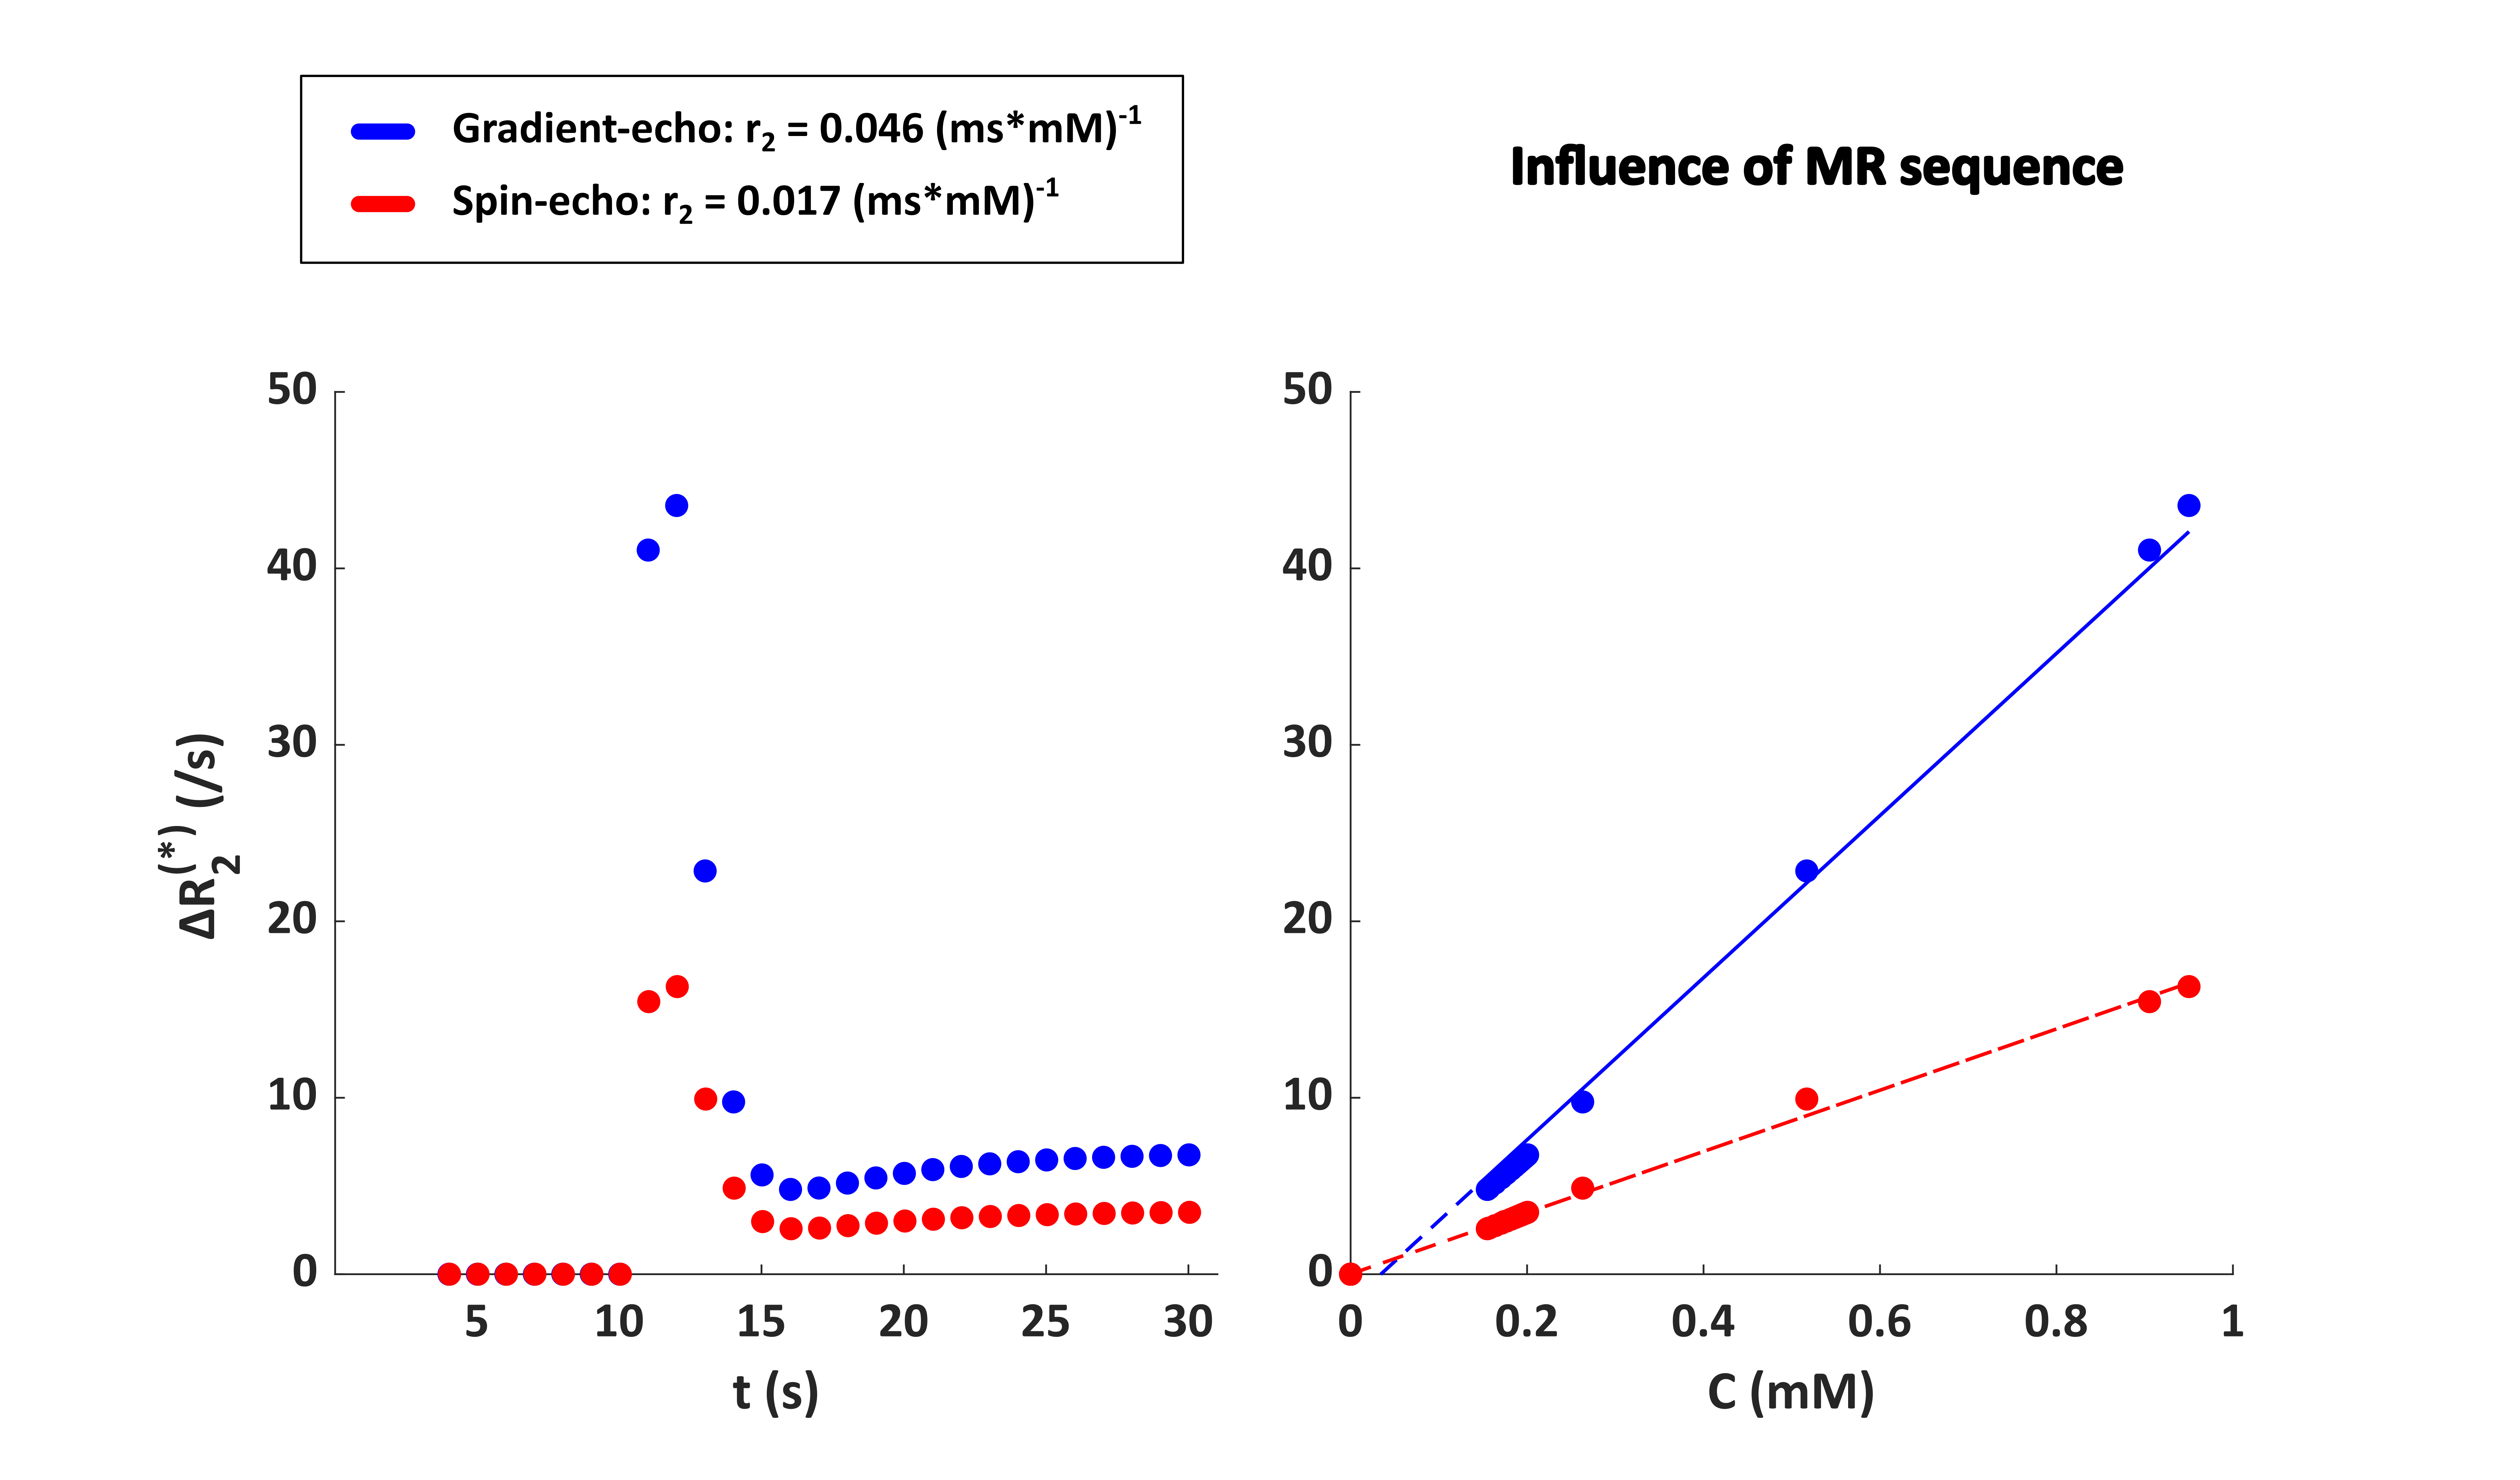
Figure 4. Influence of MR sequence in ultrasound geometry 1 (dark blue in Figure 2) on the relationship between ΔR2(*) and [Gd] for a field strength of 1.5T and a hematocrit level of 40%. The concentration on the x-axis is the tissue concentration following a double bolus injection.