4871
Imaging arterial and venous vessels using Iron Dextran enhanced multi-echo susceptibility weighted imaging (SWI) MRI at 7T1Biomedical Engineering, Johns Hopkins University School of Medicine, Baltimore, MD, United States, 2F.M. Kirby Research Center for Functional Brain Imaging, Kennedy Krieger Institute, Baltimore, MD, United States, 3Neurosection, Division of MRI Research, Russell H. Morgan Department of Radiology and Radiological Science, Johns Hopkins University School of Medicine, Baltimore, MD, United States, 4Division of Neuroradiology, Russell H. Morgan Department of Radiology and Radiological Science, Johns Hopkins University School of Medicine, Baltimore, MD, United States, 5Department of Neurology, Johns Hopkins University School of Medicine, Baltimtore, MD, United States, 6F.M. Kirby Research Center for Functional Brain Imaging, Kennedy Krieger Institute, Baltimtore, MD, United States, 7Department of Neurology, Johns Hopkins University School of Medicine, Baltimore, MD, United States
Synopsis
Keywords: Contrast Agent, Blood vessels
Iron Dextran is a widely used FDA-approved ultra-small-superparamagnetic-iron-oxides (USPIO) to treat iron deficiency anemia in patients. Here, we evaluate the feasibility of using Iron Dextran as an MRI contrast agent for imaging arterial and venous blood vessels using multi-echo susceptibility weighted imaging (SWI) MRI at 7T. Phantom experiments were performed to measure relaxivity values (r1 and r2) for Iron Dextran in blood. Pre- and post-infusion MRI images were acquired in human subjects from which maps of arteries and veins were extracted. The post-contrast SWI images showed enhanced susceptibility difference between blood and the surrounding tissue in both arteries and veins.INTRODUCTION
Ultra-small-superparamagnetic-iron-oxides (USPIO) have been widely used in MRI studies. Ferumoxytol (Feraheme) is currently the most commonly used USPIO in human studies, which was approved by the FDA to treat iron-deficiency-anemia (IDA) and has been used off-label as an MRI contrast agent. Compared to gadolinium(Gd)-based contrasts, USPIO contrasts can be used in patients with impaired renal function, and have a prolonged blood-pool-phase with a plasma half-life of 14-21 hours1. Iron-Dextran (Infed®) is another commonly used FDA-approved iron-oxide-nanoparticle compound to treat patients with IDA. Here, we aim to evaluate the feasibility of using Iron-Dextran as an MRI contrast agent for imaging arteries and veins using multi-echo susceptibility-weighted-imaging (SWI) MRI at 7T. Phantom experiments were performed to measure relaxivity values (r1 and r2) for Iron-Dextran in blood and simulations were conducted to estimate contrast enhancement with Dextran. Next, individuals who are currently treated for IDA using intravenous (IV) infusion of Iron-Dextran were recruited for this add-on MRI study. Pre- and post-infusion MRI images were acquired from which maps of blood vessels were extracted. The post-infusion MRI scans were performed on the same day of the infusion during the blood-pool phase (i.e. < 15 hours after infusion) when most of the iron-oxide-nanoparticles remain intravascular. The goal is to establish a protocol that can be employed for imaging arteries and veins using Iron-Dextran as an alternative USPIO contrast for MRI in human subjects.METHOD
All MRI scans were performed on a 7T Philips scanner.Phantom studies: The T1/T2 relaxivity values (r1/r2) of Iron-Dextran in blood are needed for simulations. They are not field dependent, but change with the medium (blood)2. Plastic tubes (length=10.9cm, diameter=16mm) were filled with solutions of bovine blood and Iron-Dextran of eleven different concentration levels from 0mg/mL to 1mg/mL with a 0.1mg/mL step. The phantoms were scanned with the following sequences: 1) inversion-recovery to determine T1: turbo-field-echo (TFE) readout, TR/TE=15/3.2ms, 19 TIs 200ms-20000ms; 2) a multi-echo gradient-echo sequence to determine T2* and susceptibility values: TR=42ms, TE = 5/10/15ms. The measured T1 and T2* values were used to estimated r1 and r2, respectively.
Simulations: Bloch simulations were performed to estimate the signal difference before and after Iron-Dextran infusion at 7T. The following parameters were used: tissue T1/T2*=1860ms/26.8ms3-6; blood T1/T2*=2290, 2190, 2090ms/13.04,10.73,7.75ms with Hct=0.44, SO2=95%,80%,65% for artery, venule, and vein, respectively7-10.
Human studies: Six participants (40±6yo, 3 females) with Restless-Legs-Syndrome (RLS) were recruited for this study. RLS is a condition that is associated with low iron in the brain11, and IV-infusion of Iron-Dextran is a common treatment for RLS to restore the body’s iron levels. Each participant paid two visits for this study. The pre-infusion scans were acquired at the first visit, during which the following scans were performed: MPRAGE (voxel=1x1x1mm3); and SWI (TR=42ms, TE1/TE2/TE3=5/10/15ms, voxel=0.4x0.4x1 , 96 slices, flip-angle= ). The IV-infusion (standard protocol: 1000mg, 2hours) was performed in a separate clinic. After that, the participants returned to the imaging center for the post-infusion scans within 15hours, during which the same scans were performed.
Data analysis was performed using Matlab and ITK-SNAP softwares. The SWI images were processed to generate a quantitative-susceptibility-map (QSM) using the JHU/KKI QSM-toolbox12. Preliminary vein maps were obtained using the maximum-intensity-projection (MIP) of QSM images based on the susceptibility difference between venous blood and tissue, and preliminary artery maps were generated by MIP of the short-TE(5ms) magnitude images13,14.
RESULTS & DISCUSSION
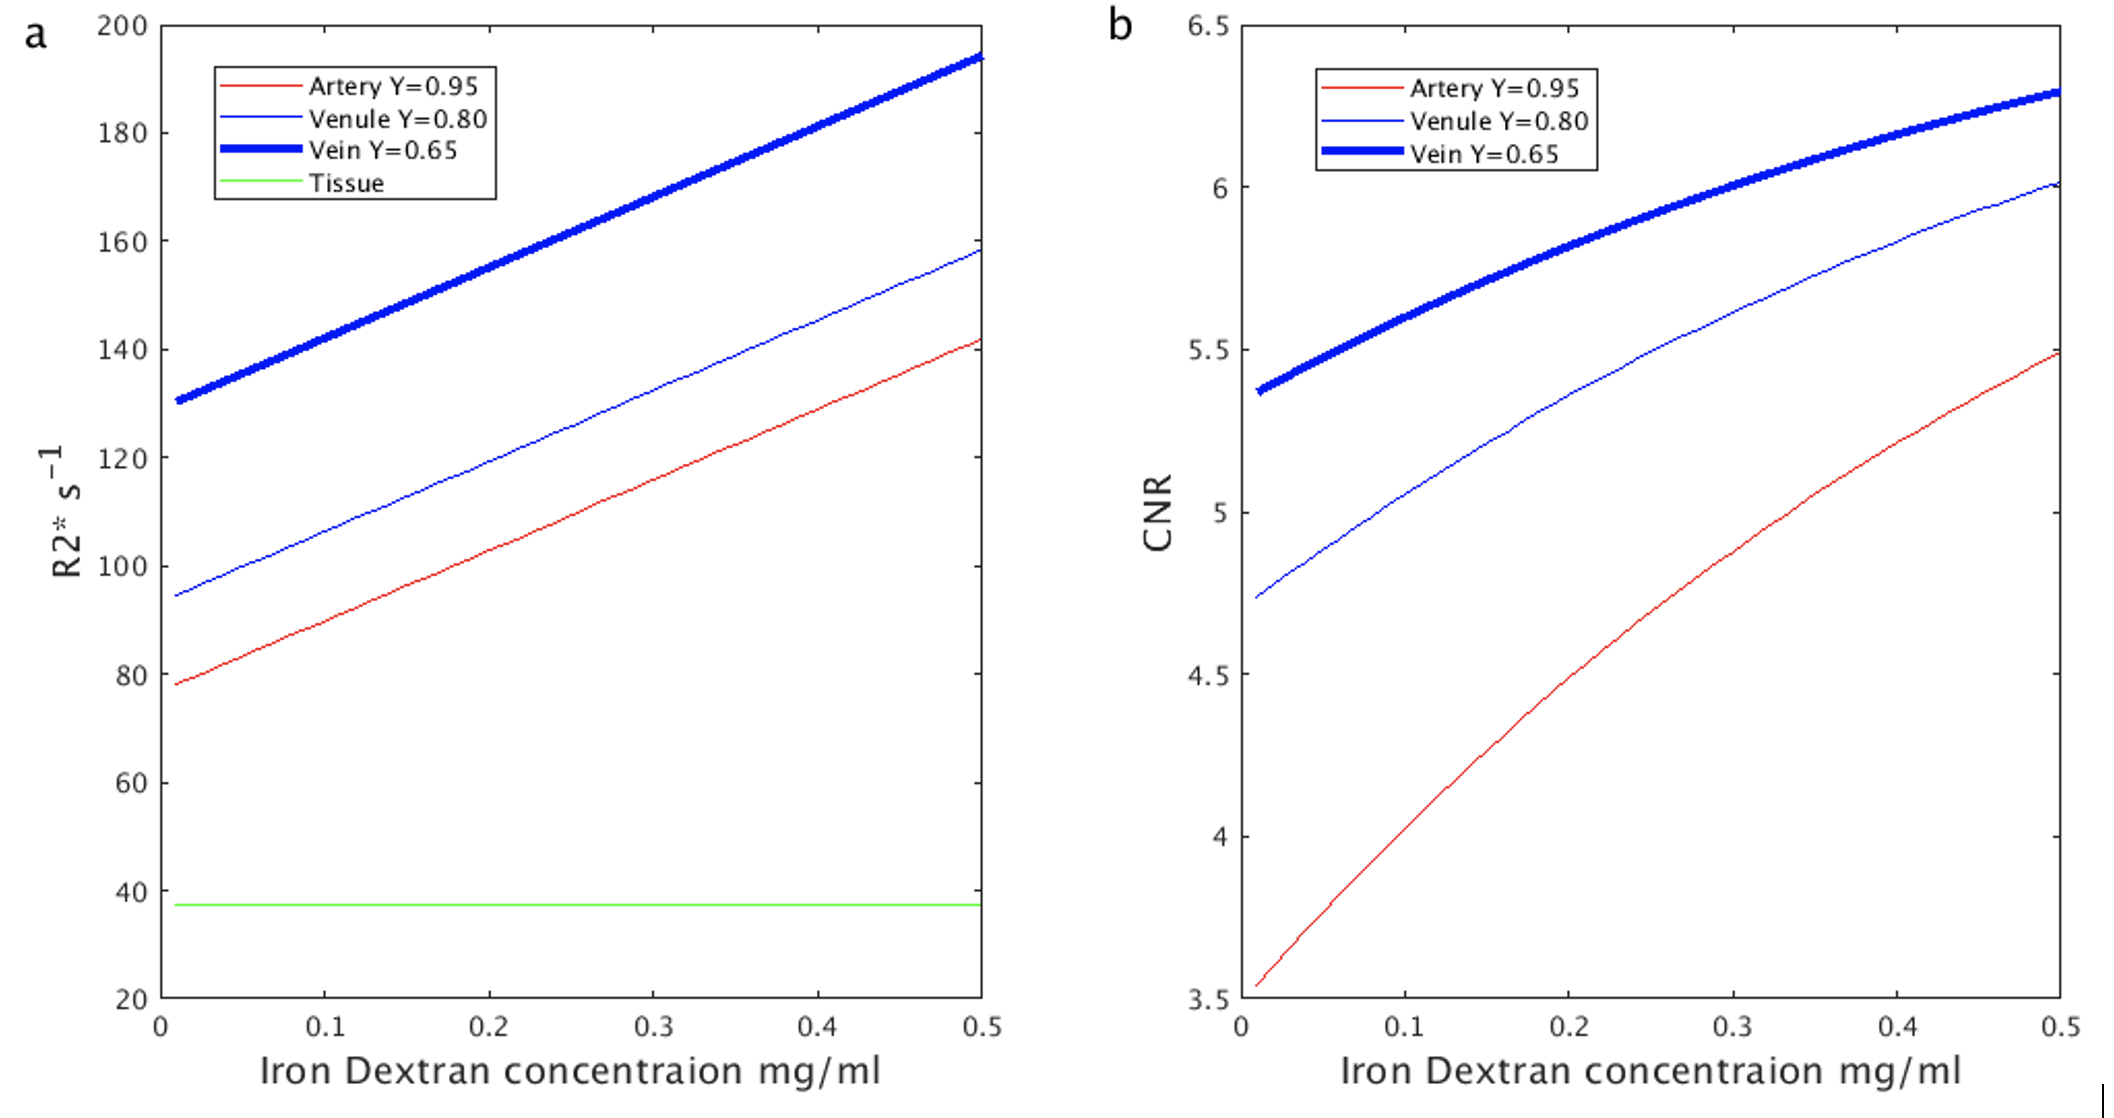
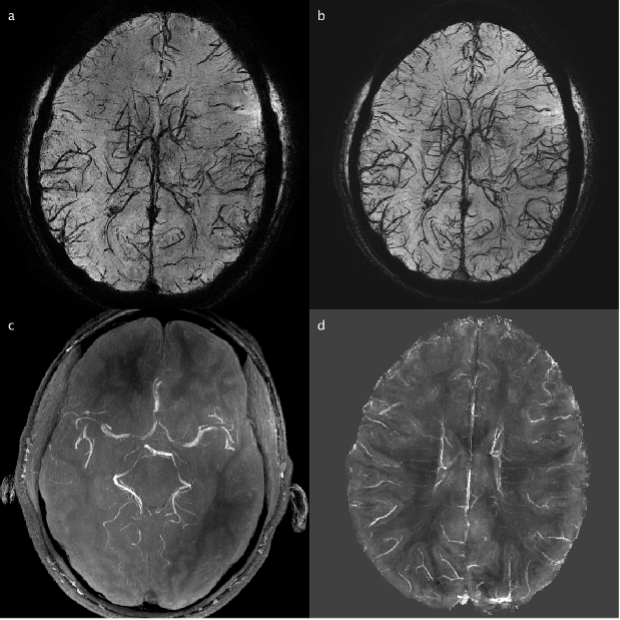
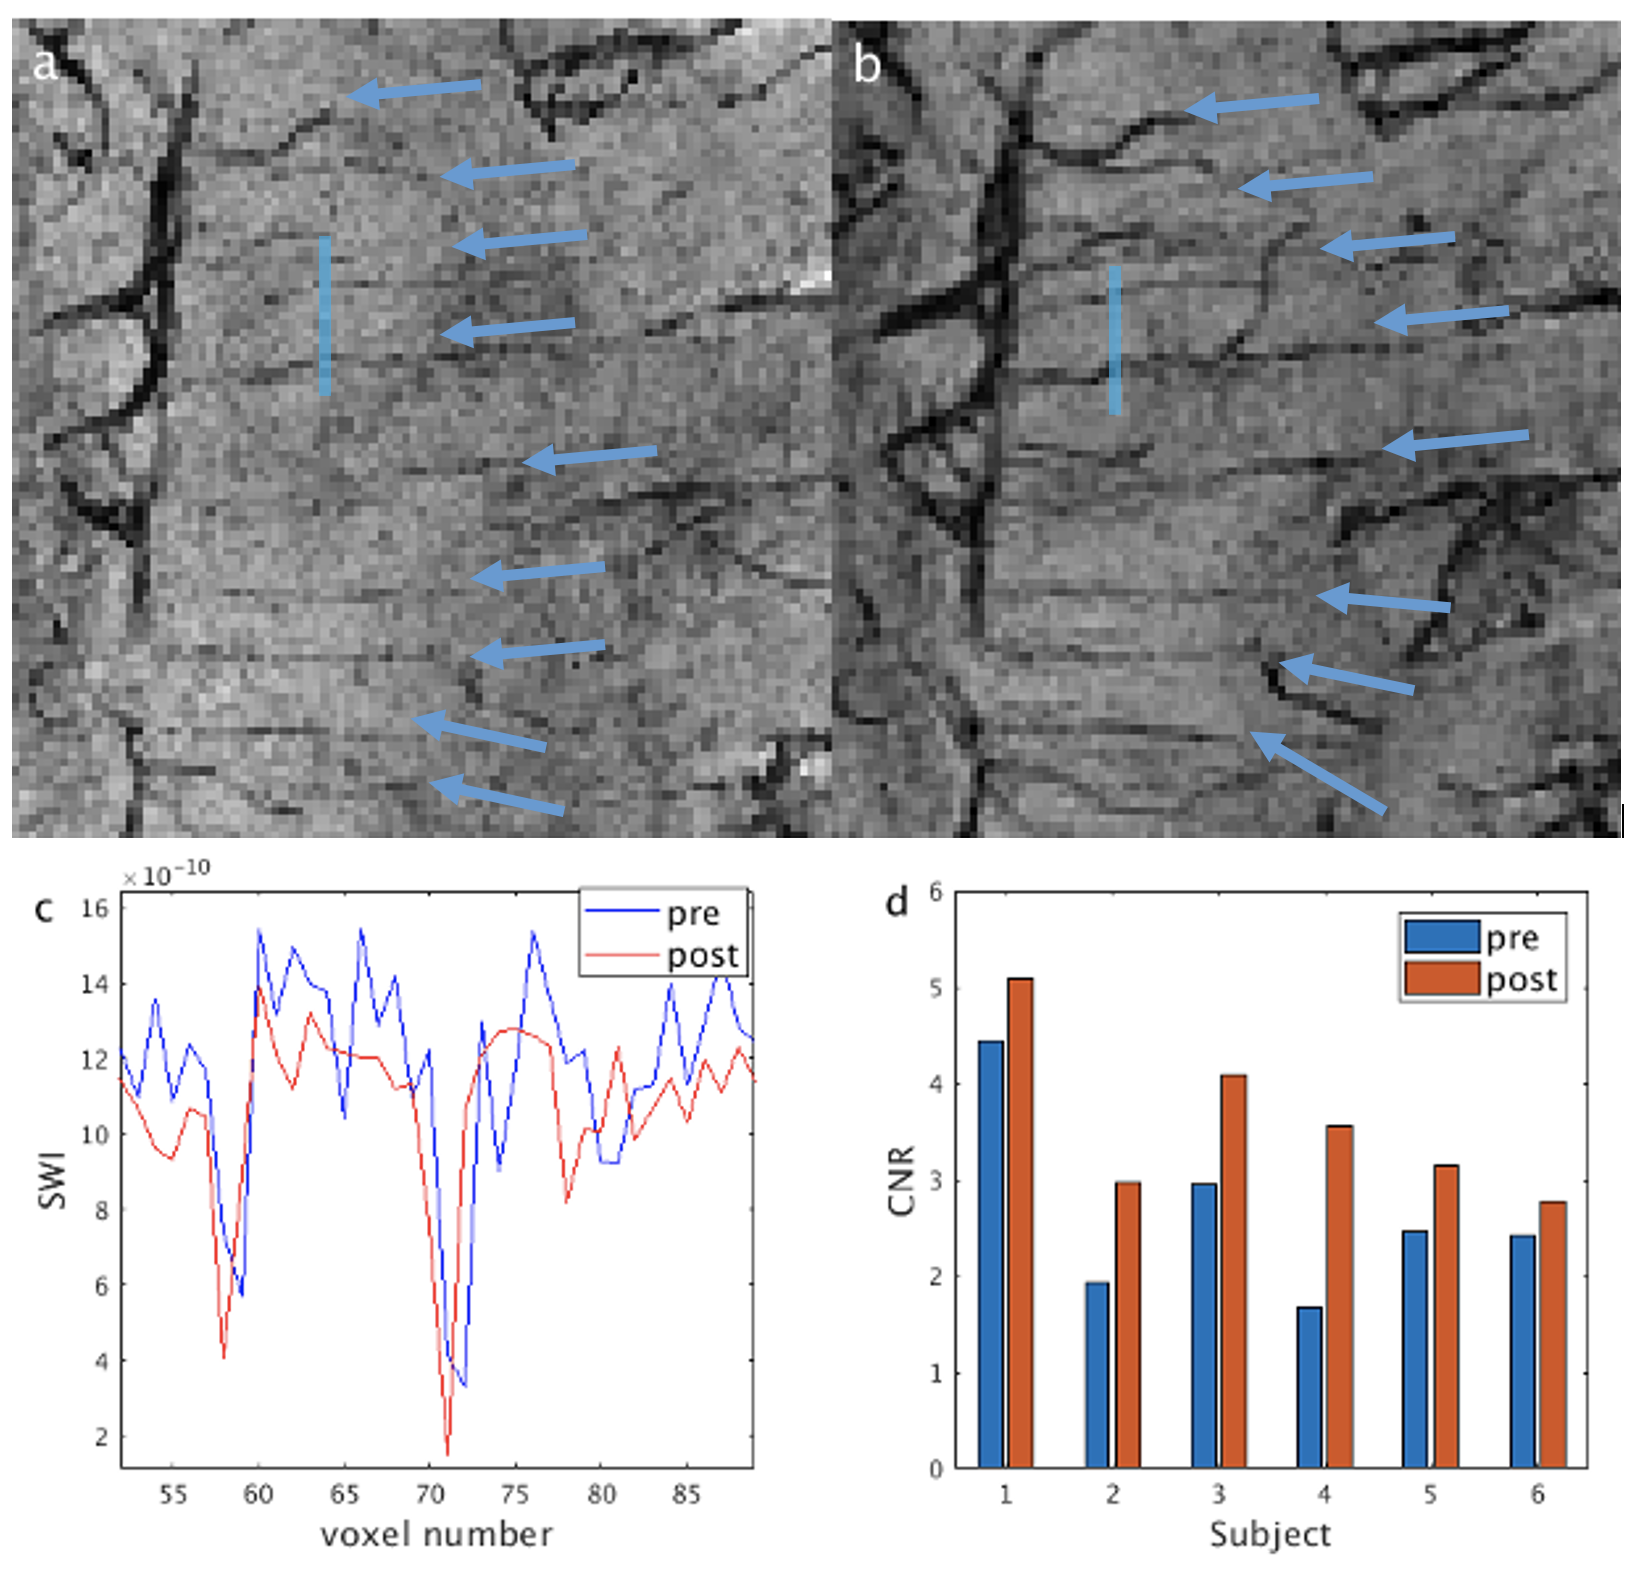
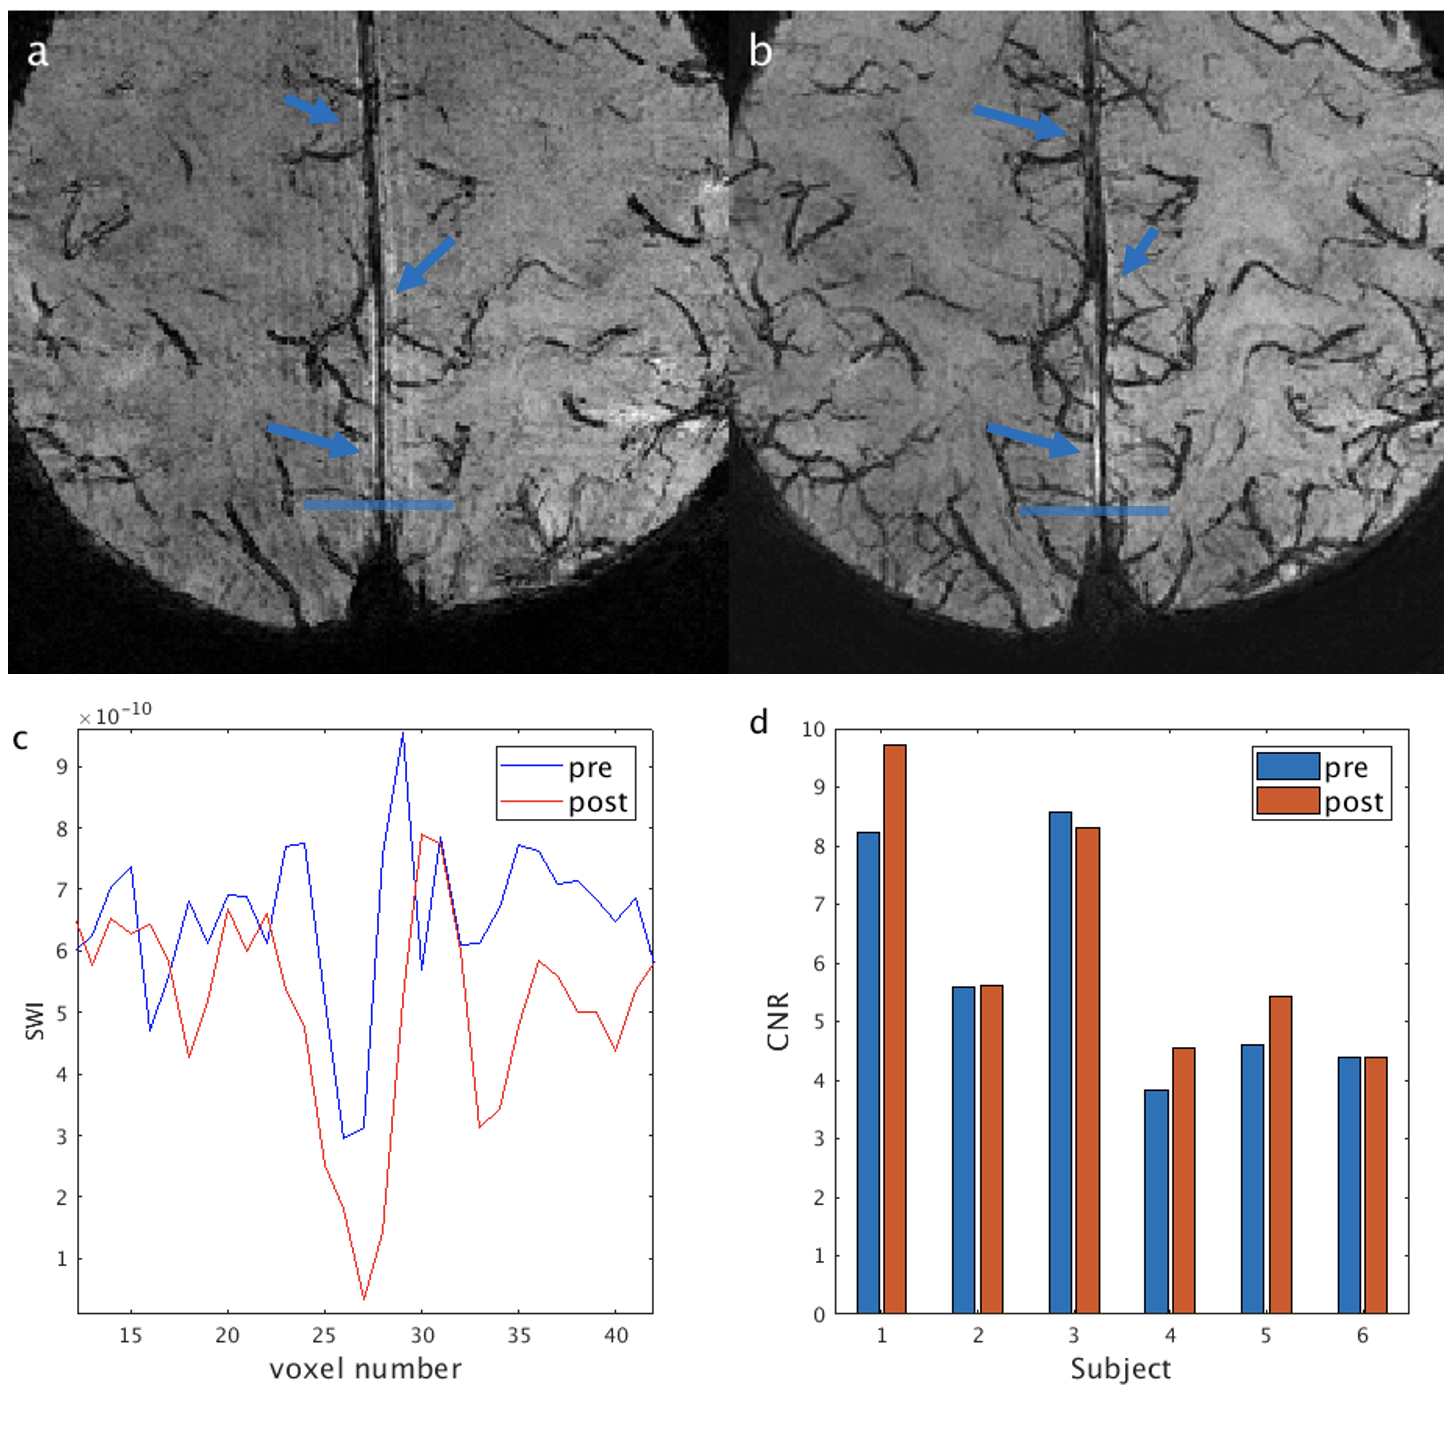
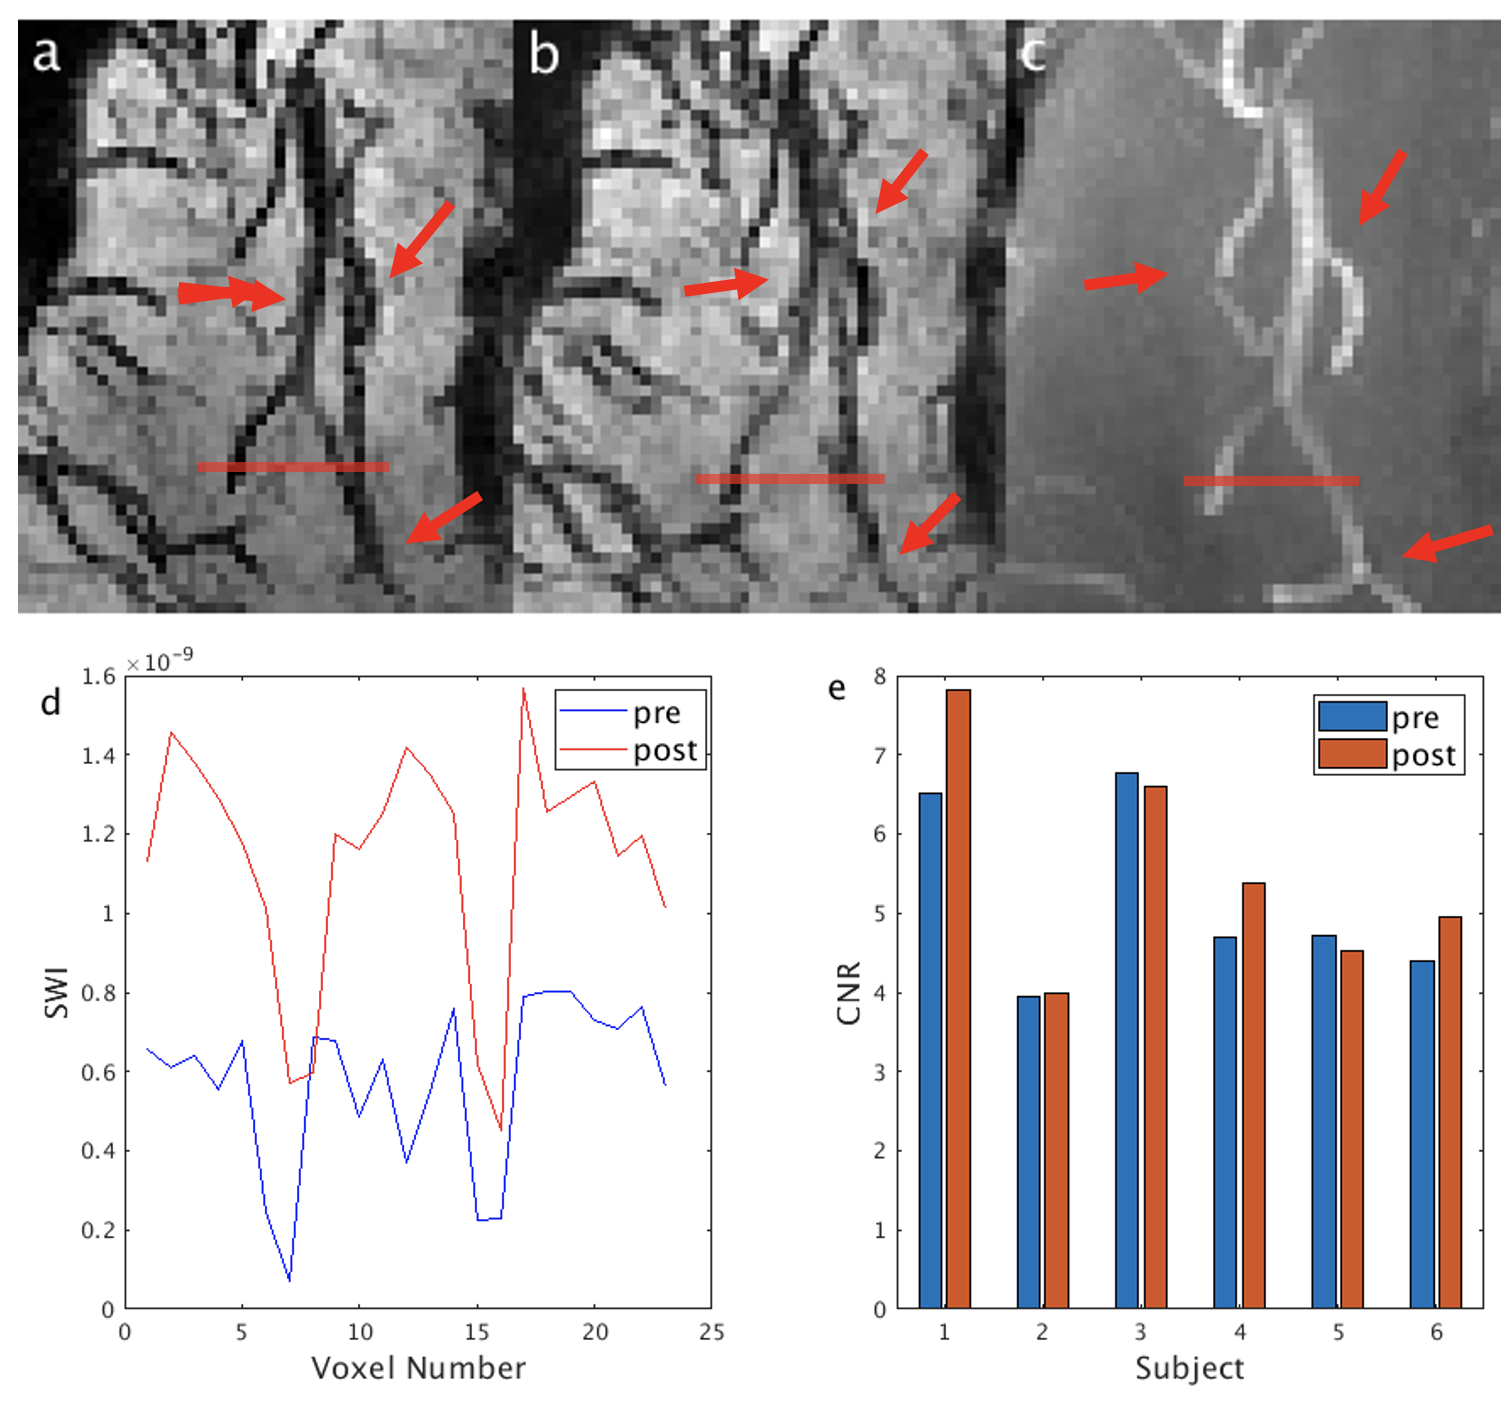
From the phantom studies, the r1 and r2 of Dextran in blood were measured as: 0.3229 s-1/(mg/mL) and 130.64 s-1/(mg/mL), respectively. Using these values, the R2* values and the contrast between blood and tissue in SWI images (simulated as the contrast-to-noise ratio (CNR)) in arteries, venules and veins were calculated as a function of Iron Dextran concentration (Figure 1). As expected, the contrast is the strongest in veins and is expected to increase with Dextran concentration. Figure 2 demonstrates typical pre- and post-contrast images and the preliminary artery and vein maps from one subject. Figures 3-5 show pre- and post-contrast images and blood-tissue CNR in a small vein (the medullary vein in Figure 3), a large vein (the sagittal sinus in Figure 4), and an artery (the lenticulostriate artery in Figure 5). The blood-tissue CNR increased for 0.96±0.24 in the medullary veins, 0.45±0.26 in the sagittal sinus, and 0.37±0.22 in the lenticulostriate artery. The CNR enhancement from Iron Dextran in the veins agreed with the simulations very well (0.78 for venules and 0.56 for veins). In arteries, the simulation showed an expected CNR enhancement of 1.19, which is much higher than the measured results. We attribute this mainly to the fact that the time-of-flight effects in the fast flowing arteries were not accounted for in the simulations.CONCLUSION
In this study, we demonstrated that Iron Dextran can be used as an alternative USPIO contrast agent for MRI (similar to Ferumoxytol) for imaging arterial and venous blood vessels in human subjects using multi-echo SWI MRI at 7T. The post-contrast SWI images showed enhanced susceptibility difference between blood and the surrounding tissue in both arteries and veins.Acknowledgements
No acknowledgement found.References
1.Toth, G.B., et al. Current and potential imaging applications of ferumoxytol for magnetic resonance imaging. Kidney international 92, 47-66 (2017).
2. Rohrer, Martin PhD*; Bauer, Hans PhD*; Mintorovitch, Jan PhD†; Requardt, Martin PhD‡; Weinmann, Hanns-Joachim PhD*. Comparison of Magnetic Properties of MRI Contrast Media Solutions at Different Magnetic Field Strengths. Investigative Radiology: November 2005 - Volume 40 - Issue 11 - p 715-724 doi: 10.1097/01.rli.0000184756.66360.d3
3. Dieringer MA, Deimling M, Santoro D, Wuerfel J, Madai VI, et al. (2014) Rapid Parametric Mapping of the Longitudinal Relaxation Time T1 Using Two-Dimensional Variable Flip Angle Magnetic Resonance Imaging at 1.5 Tesla, 3 Tesla, and 7 Tesla. PLOS ONE 9(3): e91318. https://doi.org/10.1371/journal.pone.0091318
4. Peters AM, Brookes MJ, Hoogenraad FG, Gowland PA, Francis ST, Morris PG, Bowtell R. T2* measurements in human brain at 1.5, 3 and 7 T. Magn Reson Imaging. 2007 Jul;25(6):748-53. doi: 10.1016/j.mri.2007.02.014. Epub 2007 Apr 25. PMID: 17459640.
5. Zhao F, Wang P, Kim SG. Cortical depth-dependent gradient-echo and spin-echo BOLD fMRI at 9.4T. Magn Reson Med. 2004 Mar;51(3):518-24. doi: 10.1002/mrm.10720. PMID: 15004793.
6. Blockley NP, Jiang L, Gardener AG, Ludman CN, Francis ST, Gowland PA. Field strength dependence of R1 and R2* relaxivities of human whole blood to ProHance, Vasovist, and deoxyhemoglobin. Magn Reson Med. 2008 Dec;60(6):1313-20. doi: 10.1002/mrm.21792. PMID: 19030165.
7. Rane SD, Gore JC. Measurement of T1 of human arterial and venous blood at 7T. Magn Reson Imaging. 2013 Apr;31(3):477-9. doi: 10.1016/j.mri.2012.08.008. Epub 2012 Oct 25. PMID: 23102945; PMCID: PMC3561475.
8. Dobre MC, Uğurbil K, Marjanska M. Determination of blood longitudinal relaxation time (T1) at high magnetic field strengths. Magn Reson Imaging. 2007 Jun;25(5):733-5. doi: 10.1016/j.mri.2006.10.020. Epub 2006 Dec 8. PMID: 17540286.
9. Uludağ K, Müller-Bierl B, Uğurbil K. An integrative model for neuronal activity-induced signal changes for gradient and spin echo functional imaging. Neuroimage. 2009 Oct 15;48(1):150-65. doi: 10.1016/j.neuroimage.2009.05.051. Epub 2009 May 27. PMID: 19481163.
10. Gati JS, Menon RS, Ugurbil K, Rutt BK. Experimental determination of the BOLD field strength dependence in vessels and tissue. Magn Reson Med. 1997 Aug;38(2):296-302. doi: 10.1002/mrm.1910380220. PMID: 9256111.
11. Connor JR, Patton SM, Oexle K, Allen RP. Iron and restless legs syndrome: treatment, genetics and pathophysiology. Sleep Med. 2017 Mar;31:61-70. doi: 10.1016/j.sleep.2016.07.028. Epub 2016 Nov 10. PMID: 28057495; PMCID: PMC5334282.
12. Haacke EM, Liu S, Buch S, Zheng W, Wu D, Ye Y. Quantitative susceptibility mapping: current status and future directions. Magn Reson Imaging. 2015 Jan;33(1):1-25. doi: 10.1016/j.mri.2014.09.004. Epub 2014 Oct 25. PMID: 25267705
13. Liu, S., Brisset, J.-C., Hu, J., Haacke, E.M. and Ge, Y. (2018), Susceptibility weighted imaging and quantitative susceptibility mapping of the cerebral vasculature using ferumoxytol. J. Magn. Reson. Imaging, 47: 621-633. https://doi.org/10.1002/jmri.25809
14. Buch S, Wang Y, Park MG, Jella PK, Hu J, Chen Y, Shah K, Ge Y, Haacke EM. Subvoxel vascular imaging of the midbrain using USPIO-Enhanced MRI. Neuroimage. 2020 Oct 15;220:117106. doi: 10.1016/j.neuroimage.2020.117106. Epub 2020 Jun 29. PMID: 32615253; PMCID: PMC9401191.
Figures