4868
Can Radiomics Identify Severe Right Ventricular Dilation in Patients with Repaired Tetralogy of Fallot by LV Cardiac Magnetic Resonance Images?1Department of Biomedical Engineering and Environmental Sciences, National Tsing Hua University, Hsinchu, Taiwan, 2Department of Radiology, Kaohsiung Veterans General Hospital, Kaohsiung, Taiwan, 3Department of Electrical Engineering, National Taiwan University of Science and Technology, Taipei, Taiwan, 4Department of Automatic Control Engineering, Feng Chia University, Taichung, Taiwan, 5Department of Pediatrics, Kaohsiung Veterans General Hospital, Kaohsiung, Taiwan, 6Dpartment of Pediatrics, National Yang Ming Chiao Tung University, Taipei, Taiwan
Synopsis
Keywords: Heart, Radiomics
Radiomics analysis of cardiac magnetic resonance (CMR) may provide new insights into the quantitative analysis of cardiac imaging by extracting many computational quantitative metrics. This study aimed to develop a radiomics-based classification model by left ventricular (LV) CMR images to identify repaired tetralogy of Fallot (rTOF) patients with severe right ventricular (RV) dilation. In our results, the AUC were 0.81 and 0.91 for LV radiomics and LV radiomics+LV indices models, respectively. The extracted features underlined the LV intracardiac flow alteration due to RV dilation and the potential LV remodeling in rTOF patients with severe RV dilation.Introduction
Surgical repaired of tetralogy of Fallot (rTOF) often results in hemodynamically significant pulmonary regurgitation (PR). This has been associated with right ventricular (RV) dilatation and dysfunction1. Because of the ventricular interaction, RV filling characteristics may influence left ventricular (LV) filling2-4. The identification of global and regional abnormalities on cardiac magnetic resonance (CMR) images for assessing cardiac structure and function is labor-intensive and reader-dependent5-7. Radiomics and machine learning-based imaging biomarker discovery brought new horizons for more accurate detection, diagnosis, prediction, and prognostication in various diseases8-10. Previous works have shown the potential of radiomics for identification and classification in different cardiac diseases11-14.This study aimed to develop a radiomics-based classification model by LV CMR images to identify patients with severe RV dilation.
Methods
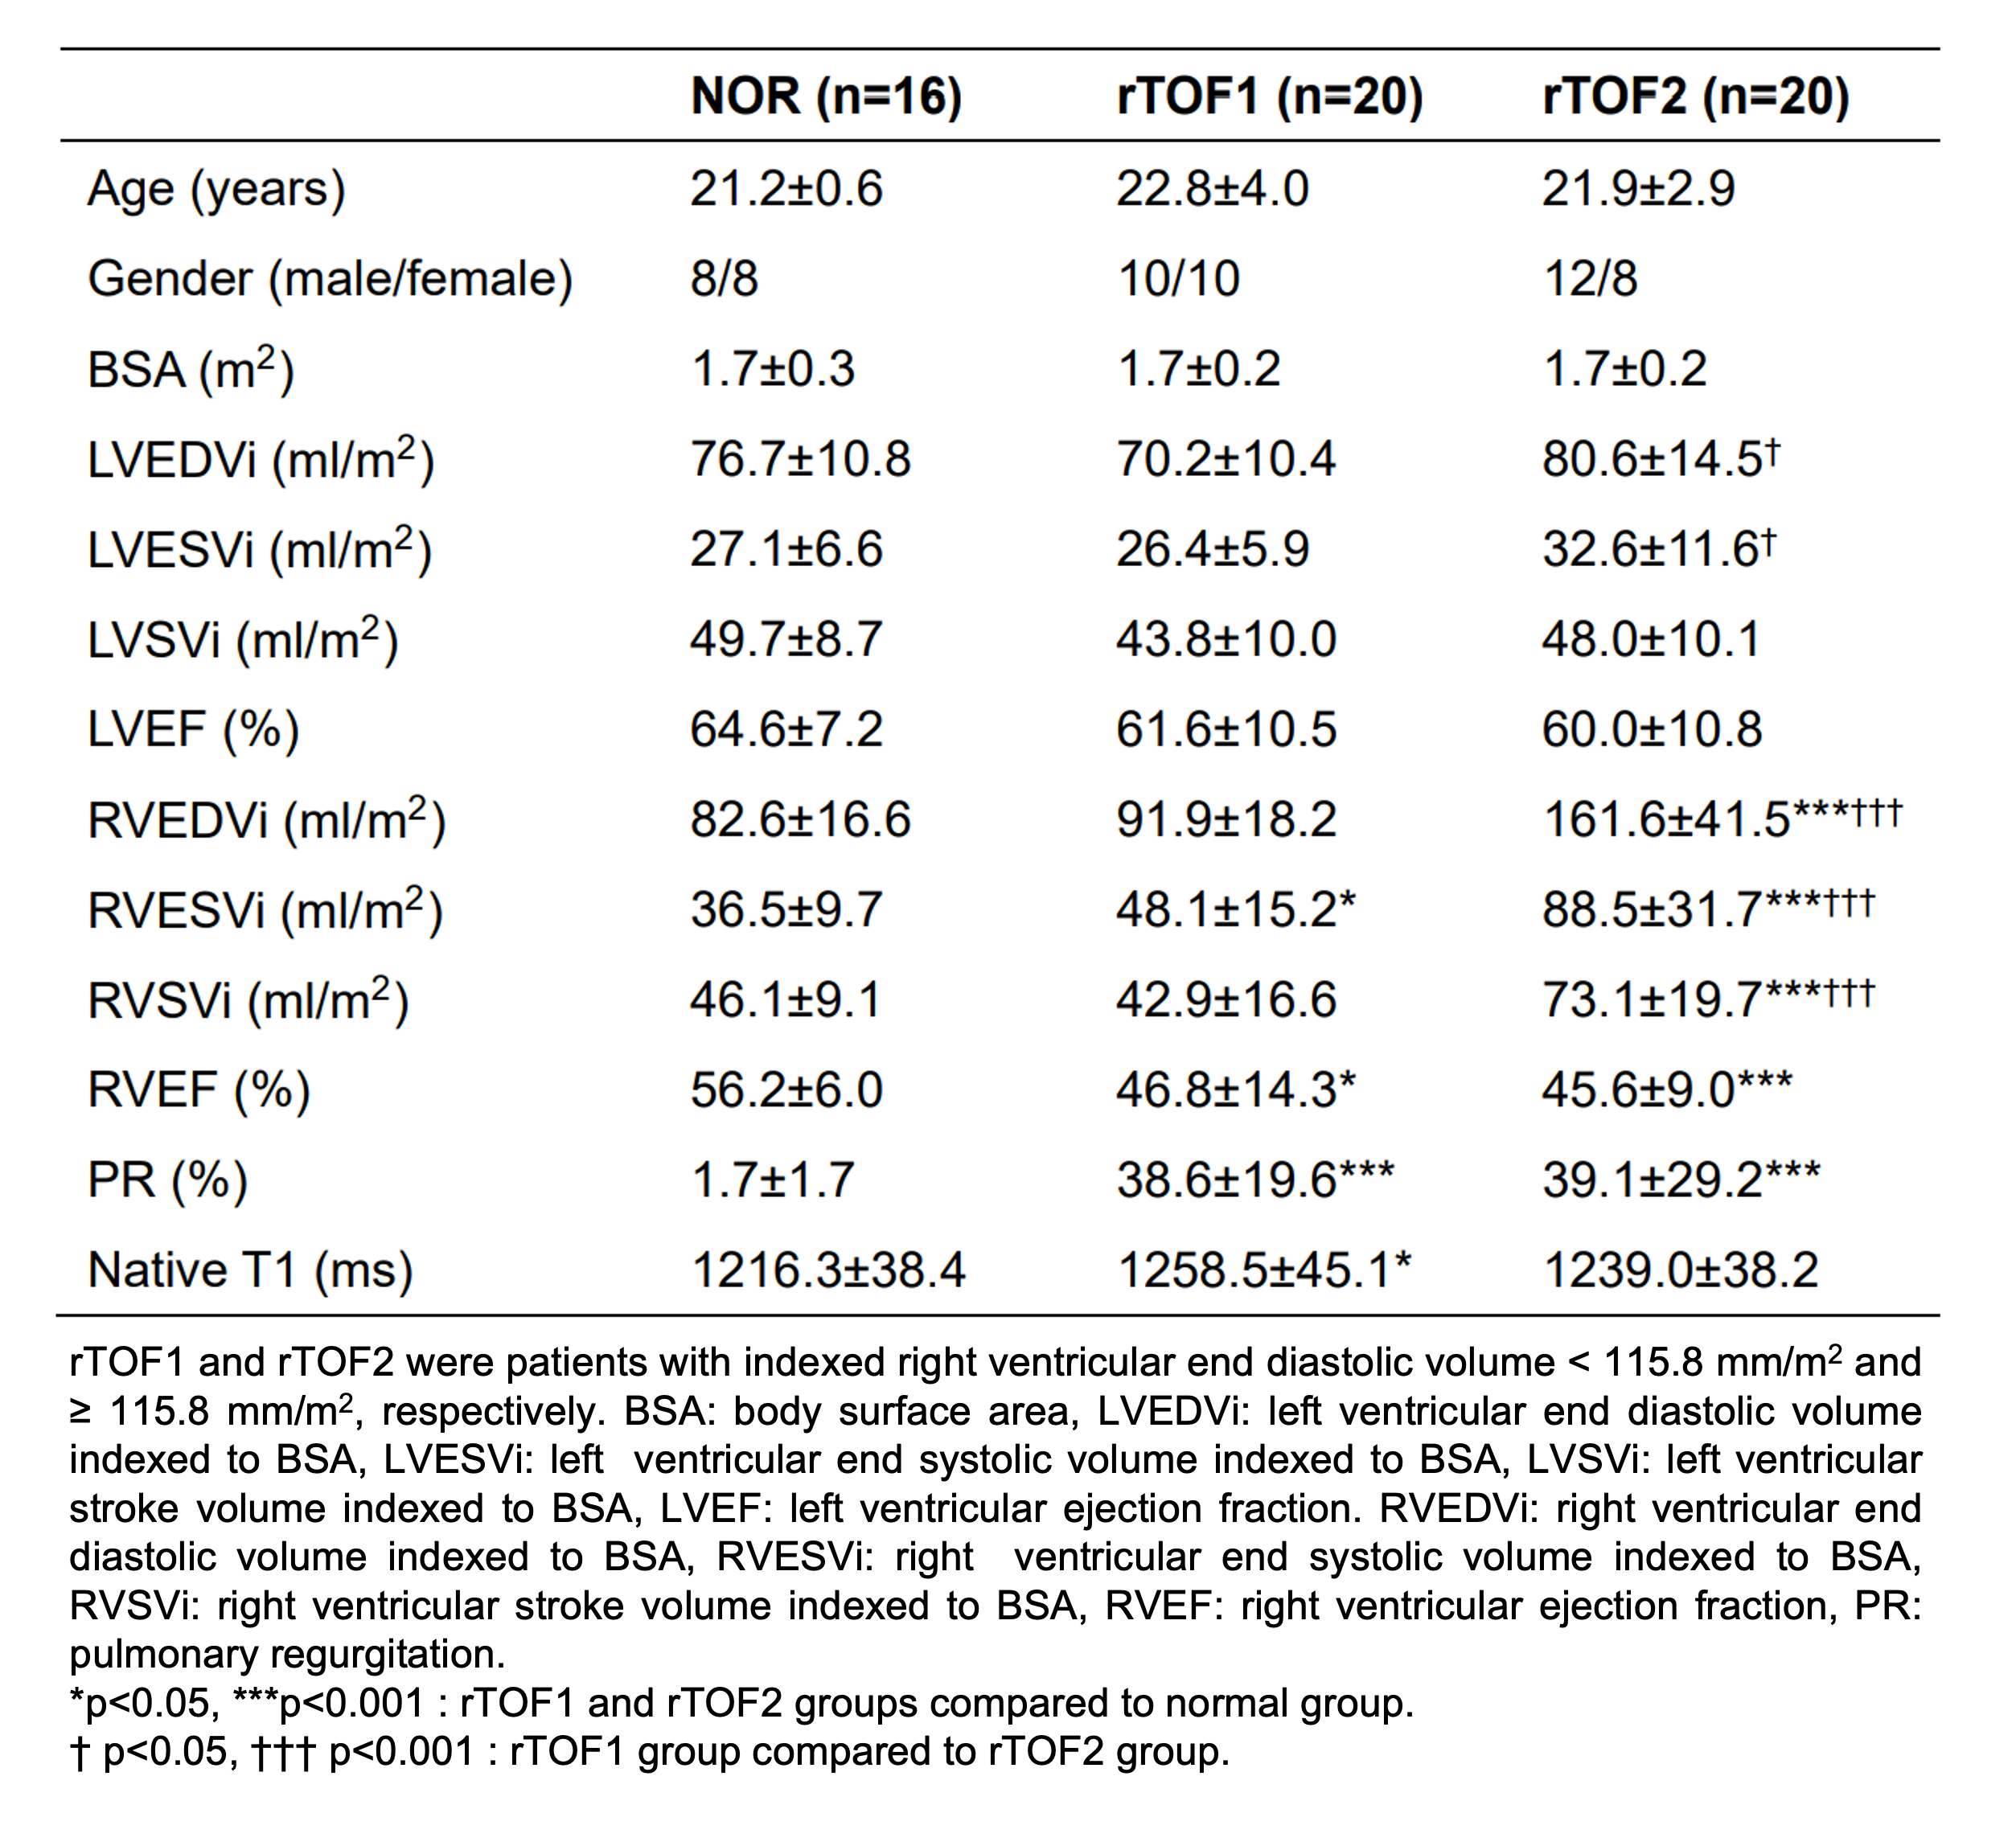
The study population comprised 40 patients with rTOF (age 22.5±3.6 years, 18 females). A cut-off value of indexed RV end-diastolic volume (RVEDVi), which was the mean+2×standard deviation of RVEDVi in the normal group, was used to divide rTOF patients into two subgroups. The rTOF1 group (n=20) and rTOF2 group (n=20) were patients with RVEDVi < 115.8 ml/mm2 and ≥ 115.8 ml/mm2, respectively.MR images were acquired in a 3T scanner (Skyra, Siemens). The scanning parameters of cine balanced steady-state free procession were TR/TE=3.2/1.7 ms, flip angle=50°, voxel size=1.25×1.25×8 mm3, temporal resolution=46.8 ms (interpolated to 25 phases/cardiac cycle), a short-axis stack with 10-12 slices covering LV and RV from base to apex with breath-hold and retrospective ECG-gating techniques. The endocardial and epicardial contours were delineated automatically at end-diastolic (ED) and end-systolic (ES) phases using an institute-developed tool. These contours were used to define two regions of interest (ROIs) for radiomics analysis: LV blood pool and LV myocardium (LVMYO).
Conventional CMR indices of cardiac structure and function were assessed in the LV and RV, including indexed end-diastolic volume (LVEDVi, RVEDVi), indexed end-systolic volume (LVESVi, RVESVi), indexed stroke volume (LVSVi, RVSVi), and ejection fraction (LVEF, RVEF).
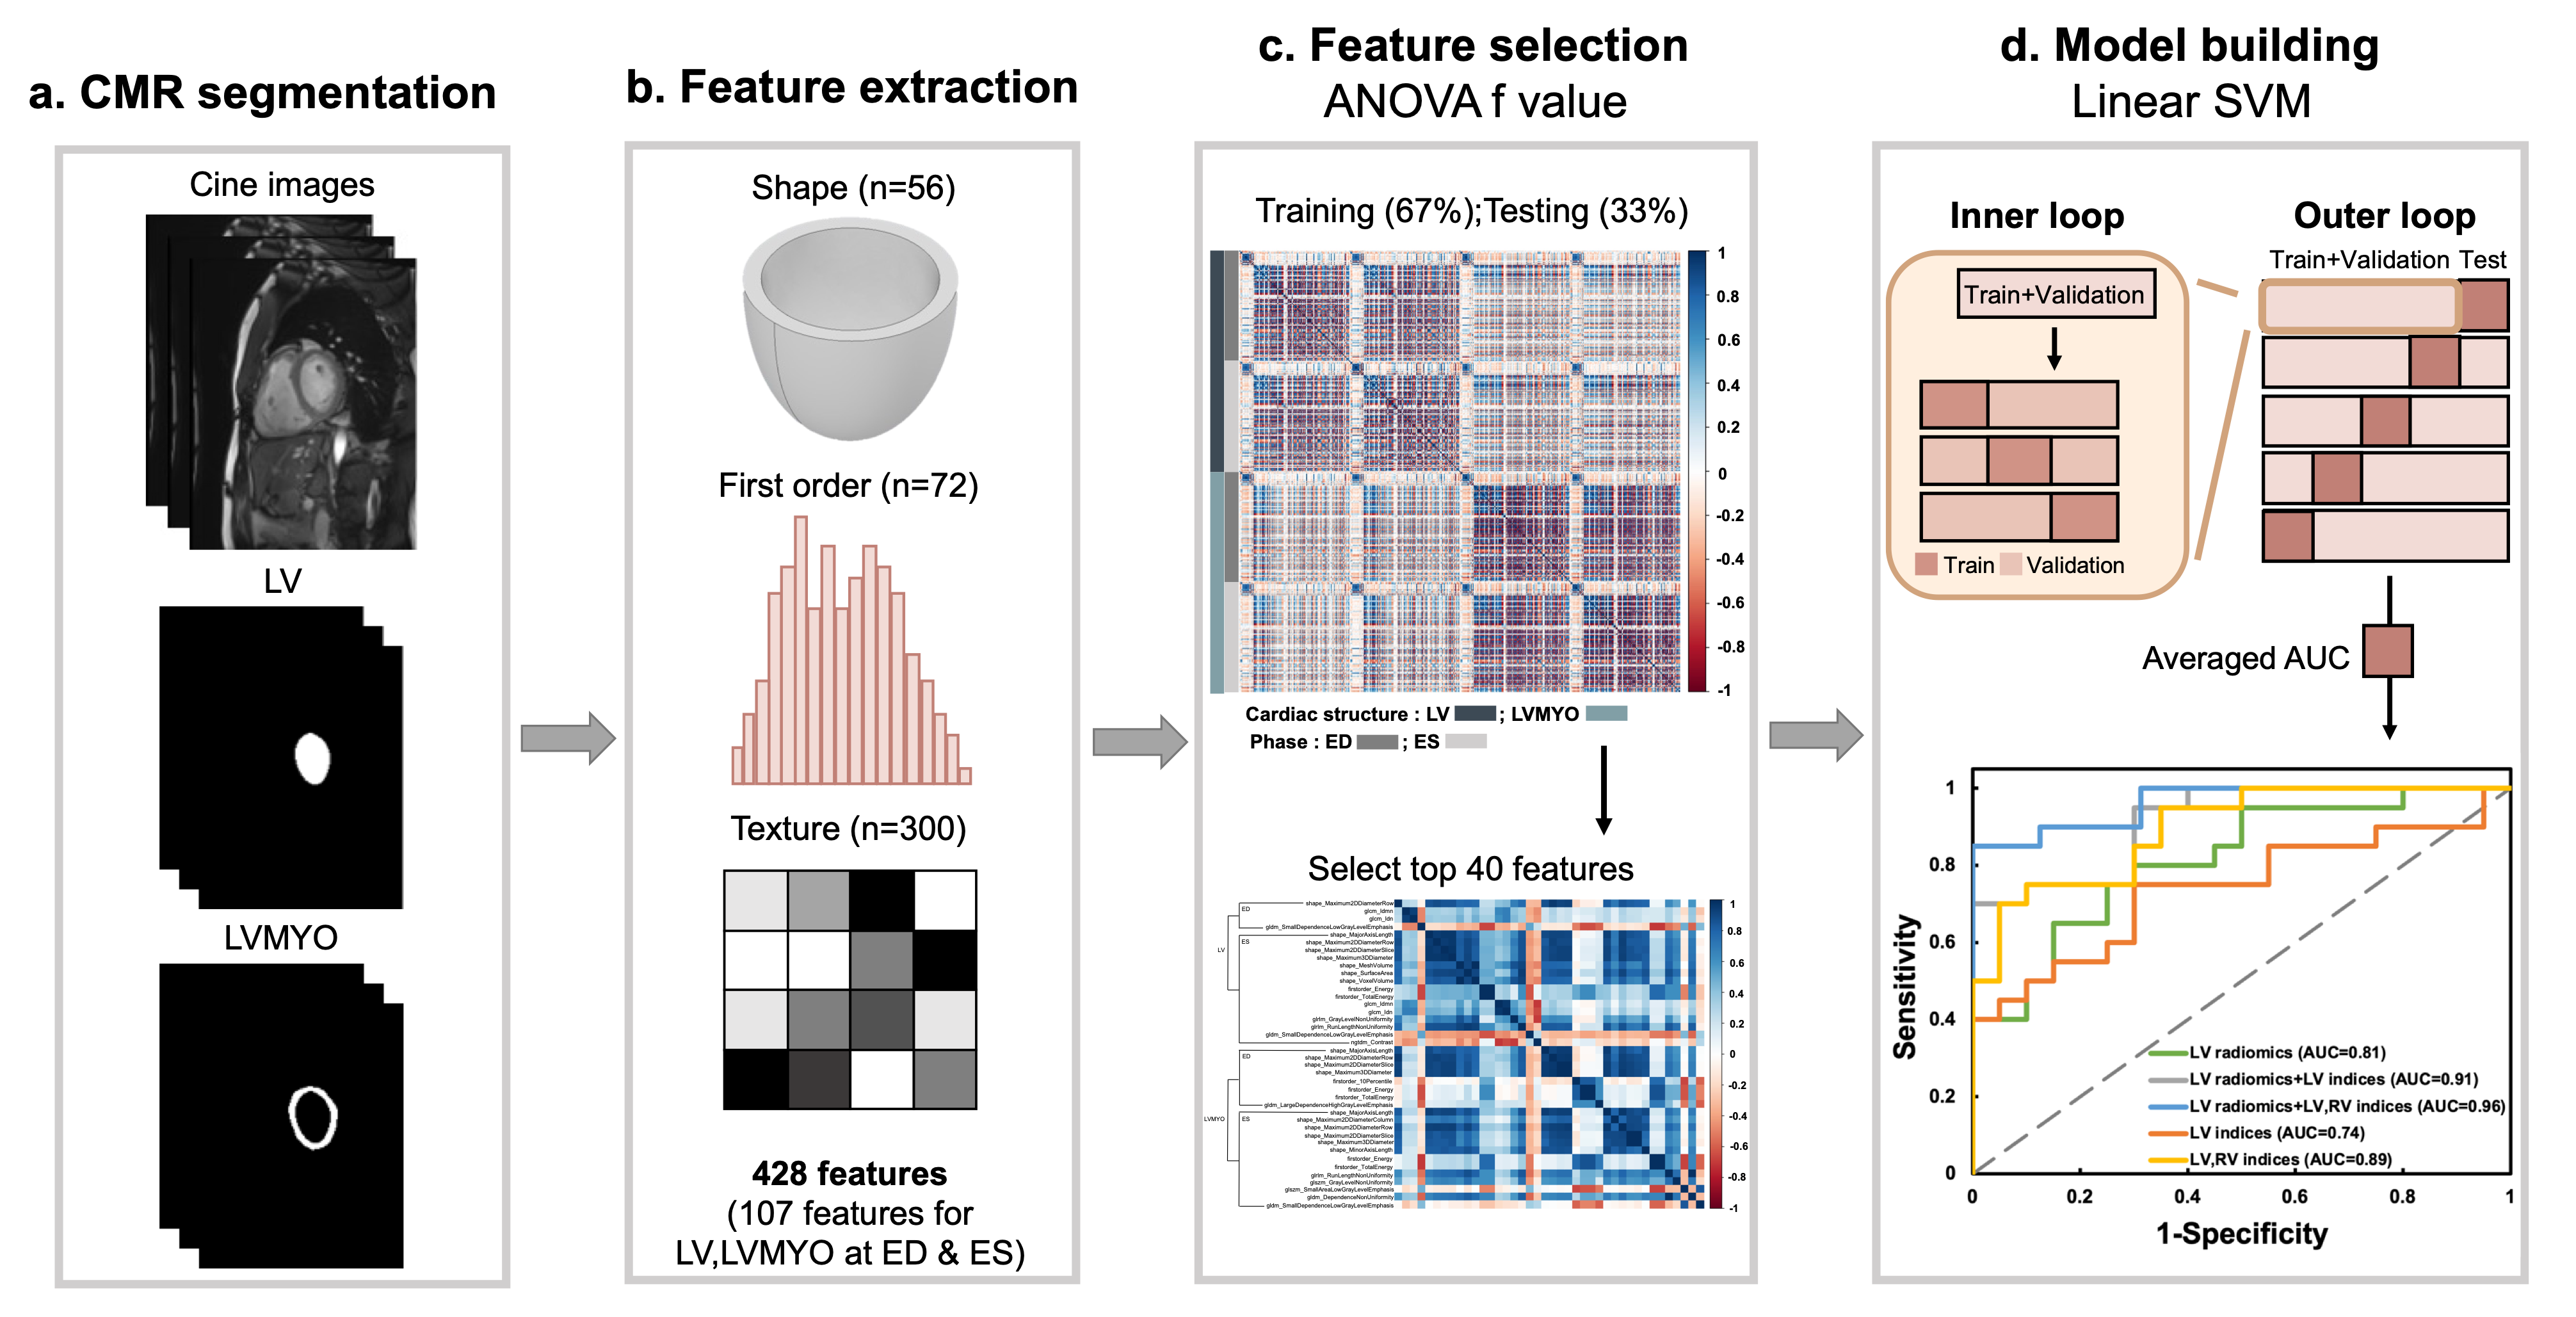
Figure 1 illustrates the radiomics workflow. Pyradiomics (version 1.3.0)15 was used to automatically extract radiomic features. 428 radiomic features were extracted, consisting of 107 radiomic features in LV and LVMYO at ED and ES. The features in shape and first order categories quantified morphological characteristics and histogram-based signal intensity characteristics, respectively. The features in texture analysis enable the detection of spatial inter-pixel interactions by using advanced matrix analysis.
The ANOVA f-value was used to select the top 40 features for the establishment of classification model16. A linear support vector machine (SVM) model was used for classification17,18. We performed a five-fold outer loop and a three-fold inner loop in the SVM model. In the outer loop, 80% and 20% of the data were set as training+validation and testing datasets, respectively. In the inner loop, the datasets were divided into 67% and 33% for training and validation, respectively. The CMR indices or radiomics-based features or a combination of CMR indices and radiomics-based features were employed to establish 5 classification models for differentiation rTOF2 from rTOF1 patients. Student t test and Pearson correlation were performed when appropriate. A p value <0.05 was considered statistically significant.
Results
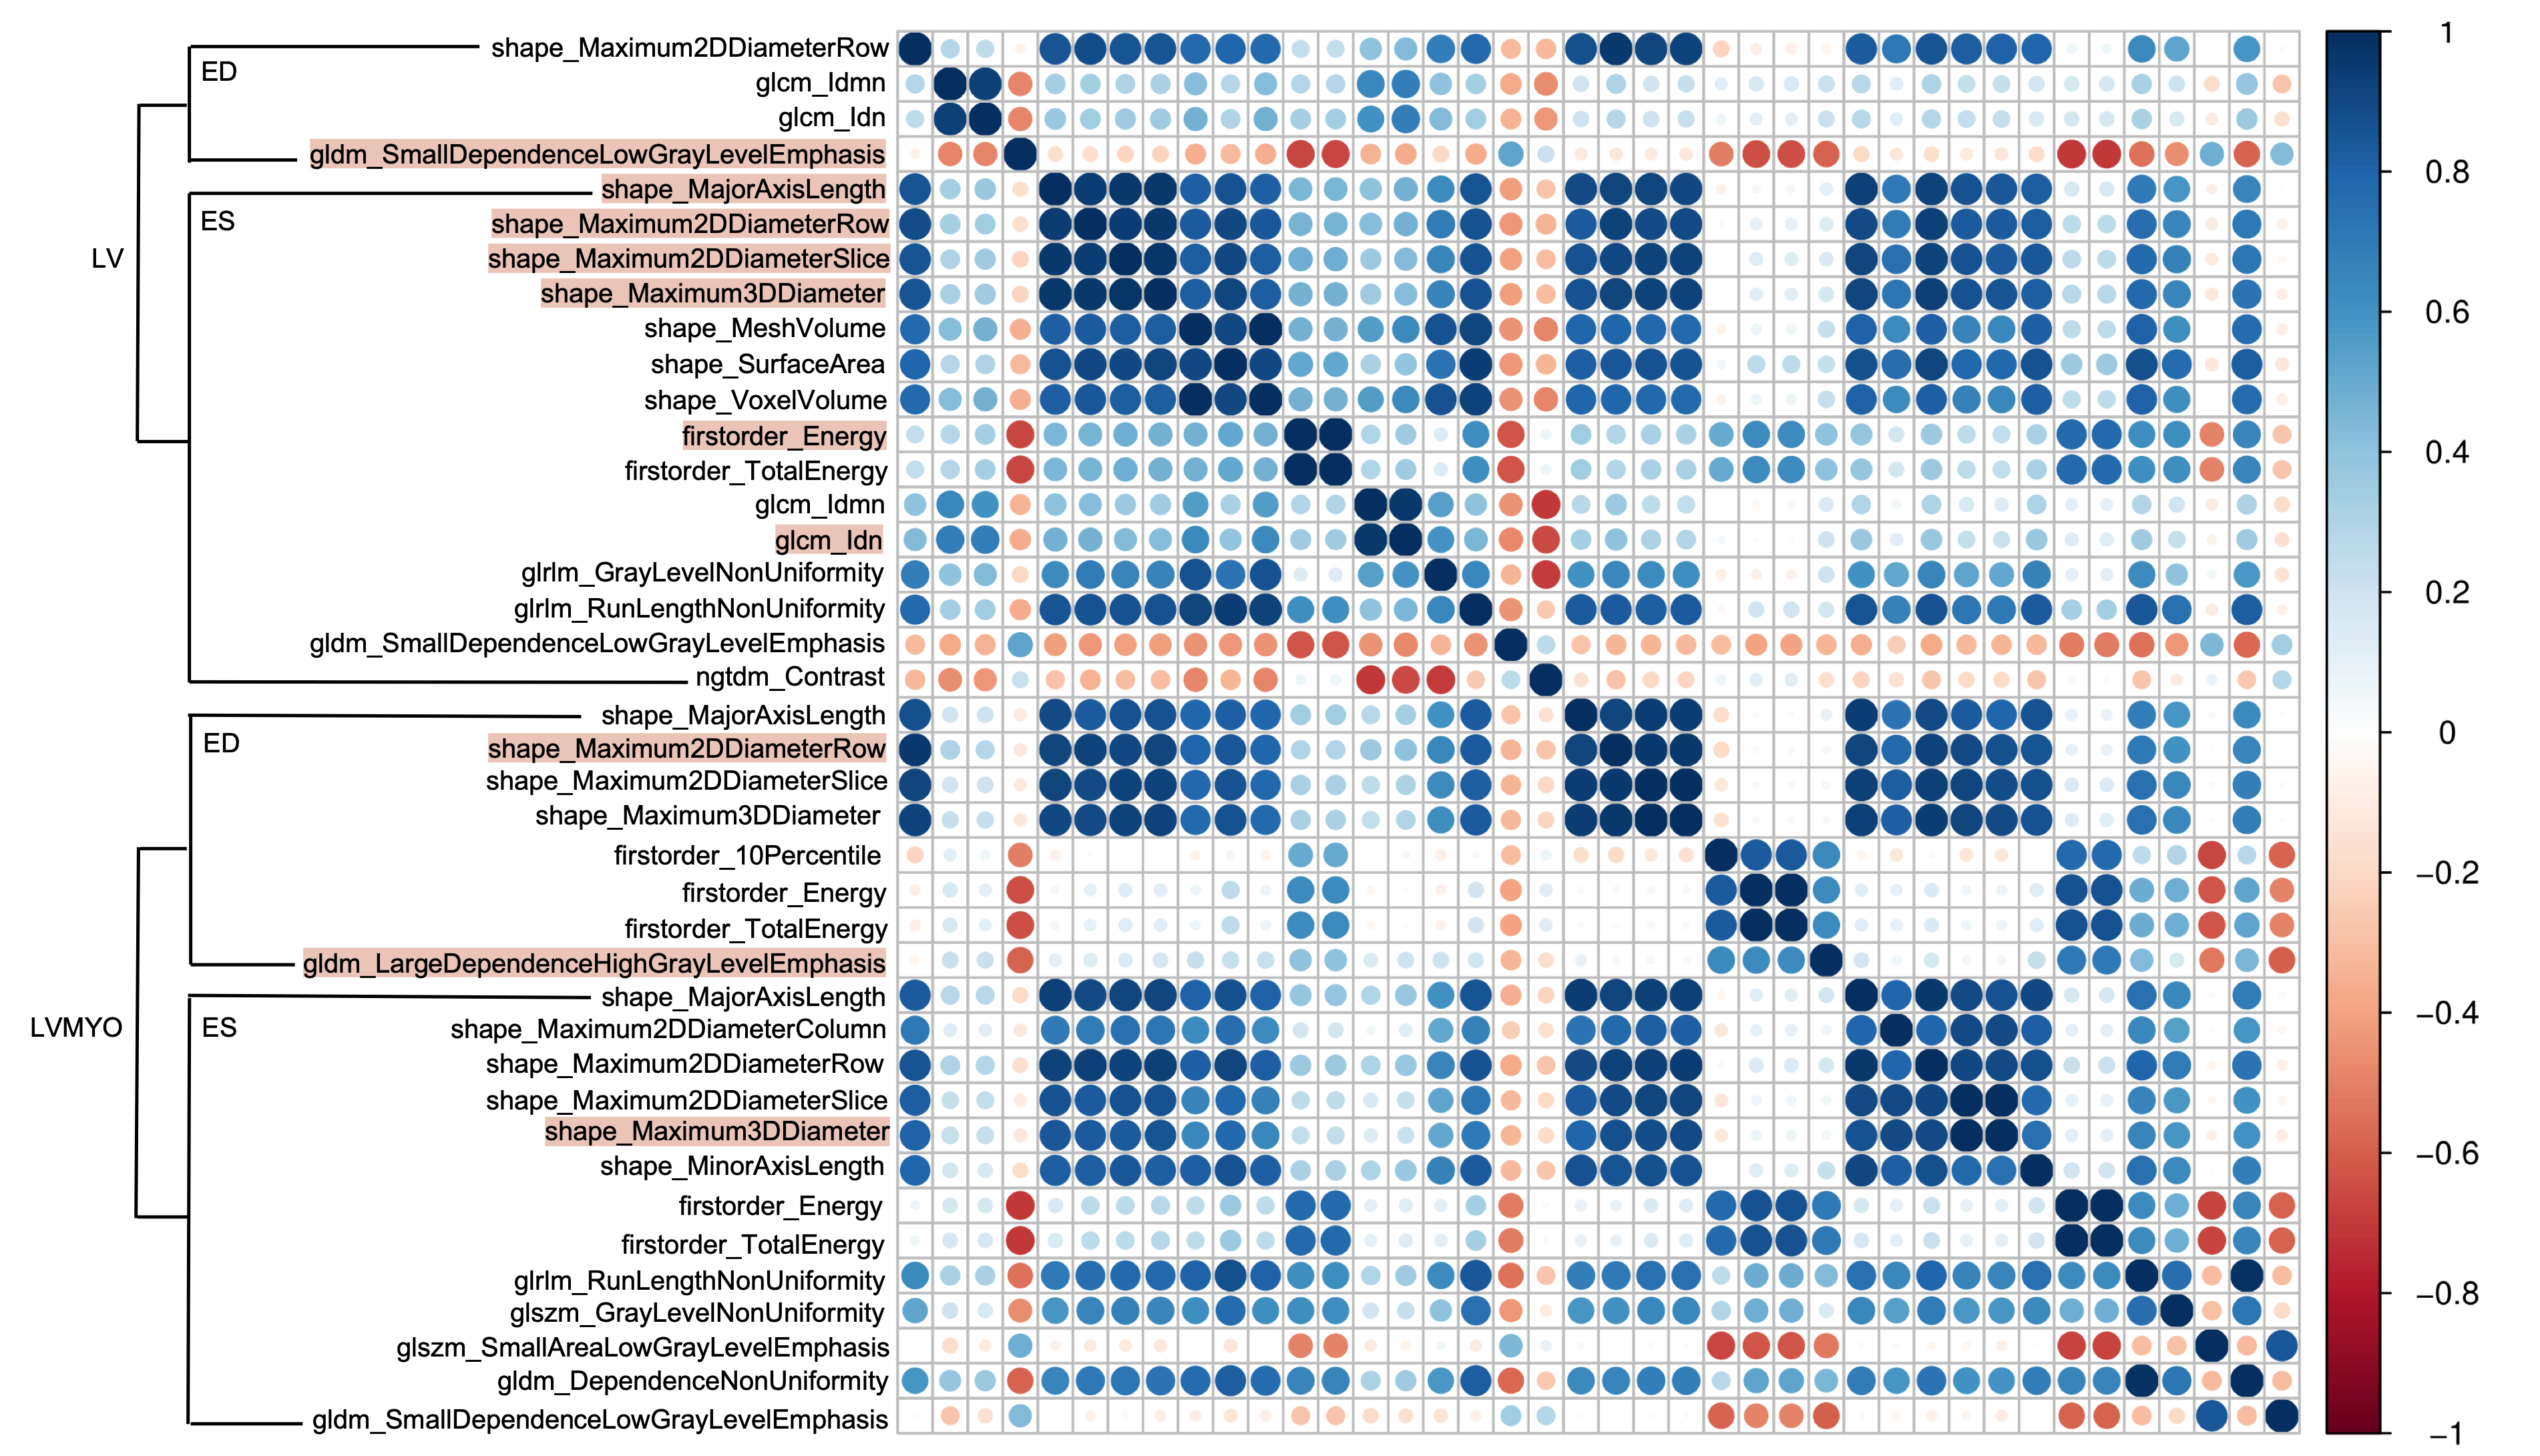
Table 1 summarizes the demographics and hemodynamic characteristics in rTOF1 and rTOF2 groups. The rTOF2 group exhibited more dilated LVEDVi, LVESVi, RVEDVi, RVESVi, and RVSVi (all p<0.05) than rTOF1 group.In Figure 2, 21 of 40 and 19 of 40 of the selected features belonged to the LVMYO and LV, respectively. The shape features of LV and LVMYO were strongly correlated with each other.
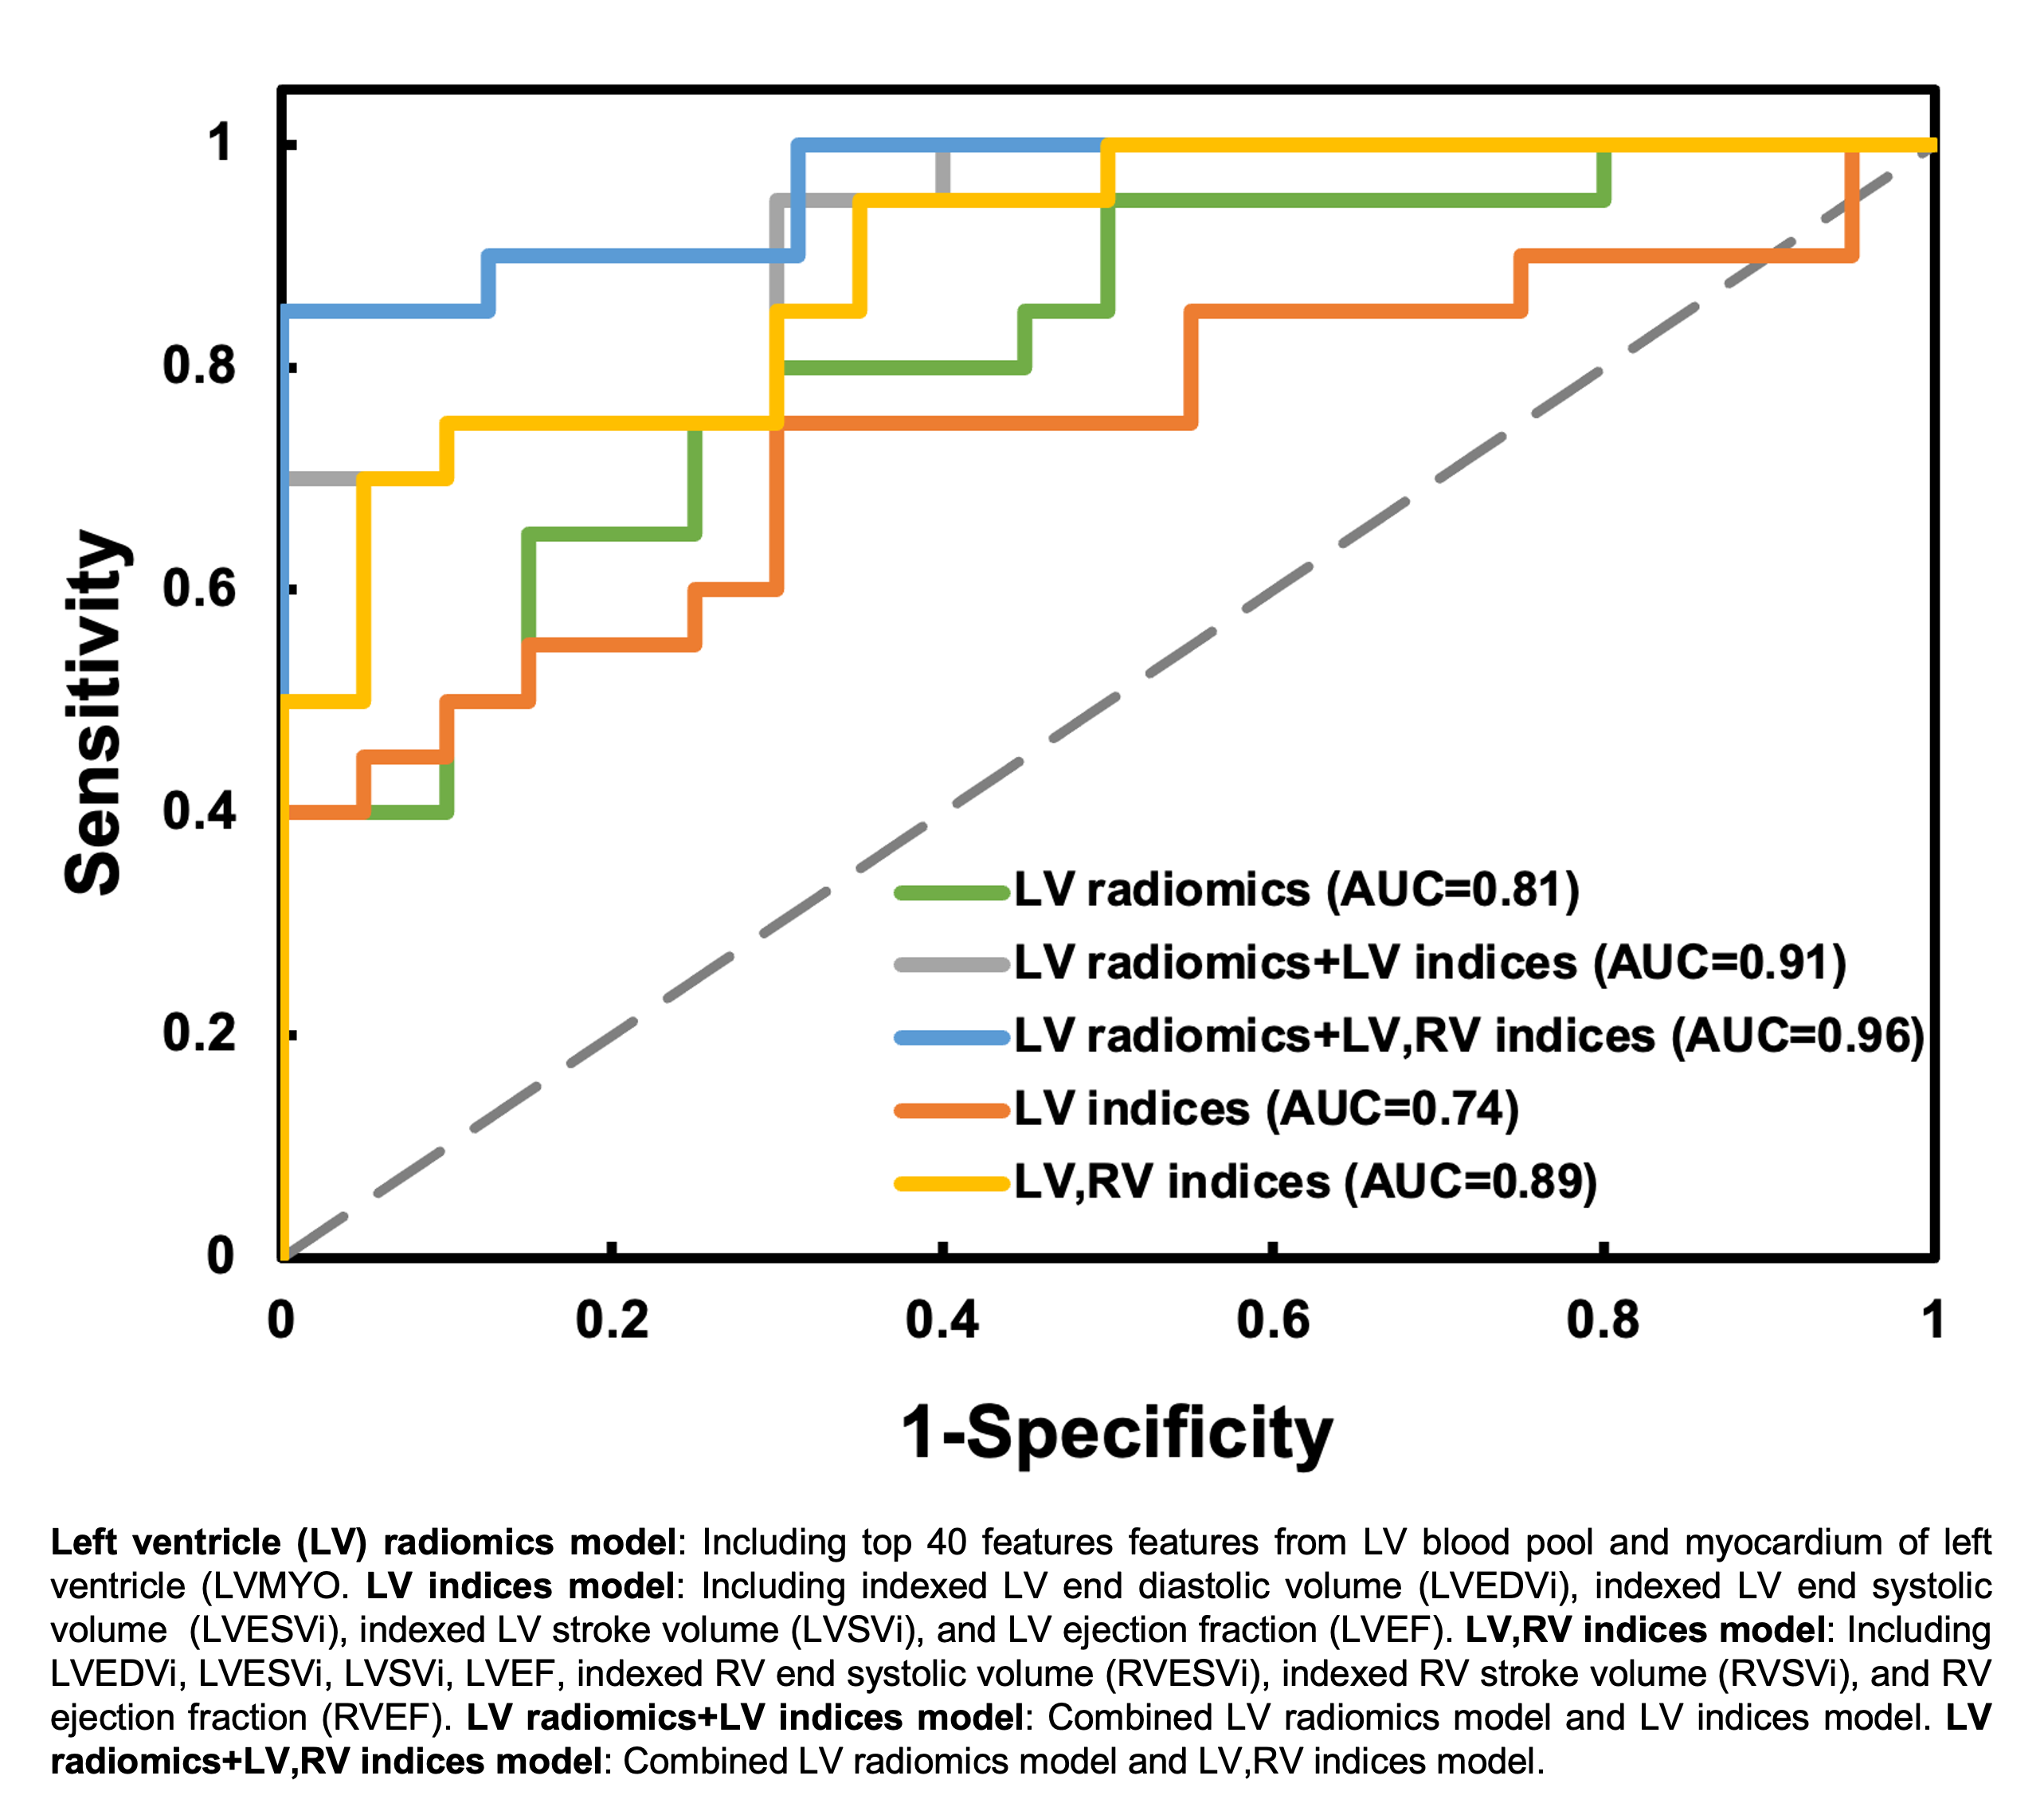
Figure 3 illustrates the receiver operation characteristic (ROC) curves to differentiate rTOF2 patients from rTOF1 patients by 5 different models. The area under curve (AUC) of 5 models were 0.81, 0.91, 0.96, 0.74, and 0.89 for LV radiomics, LV radiomics+LV indices, LV radiomics+LV,RV indices, LV indices, and LV,RV indices, respectively.
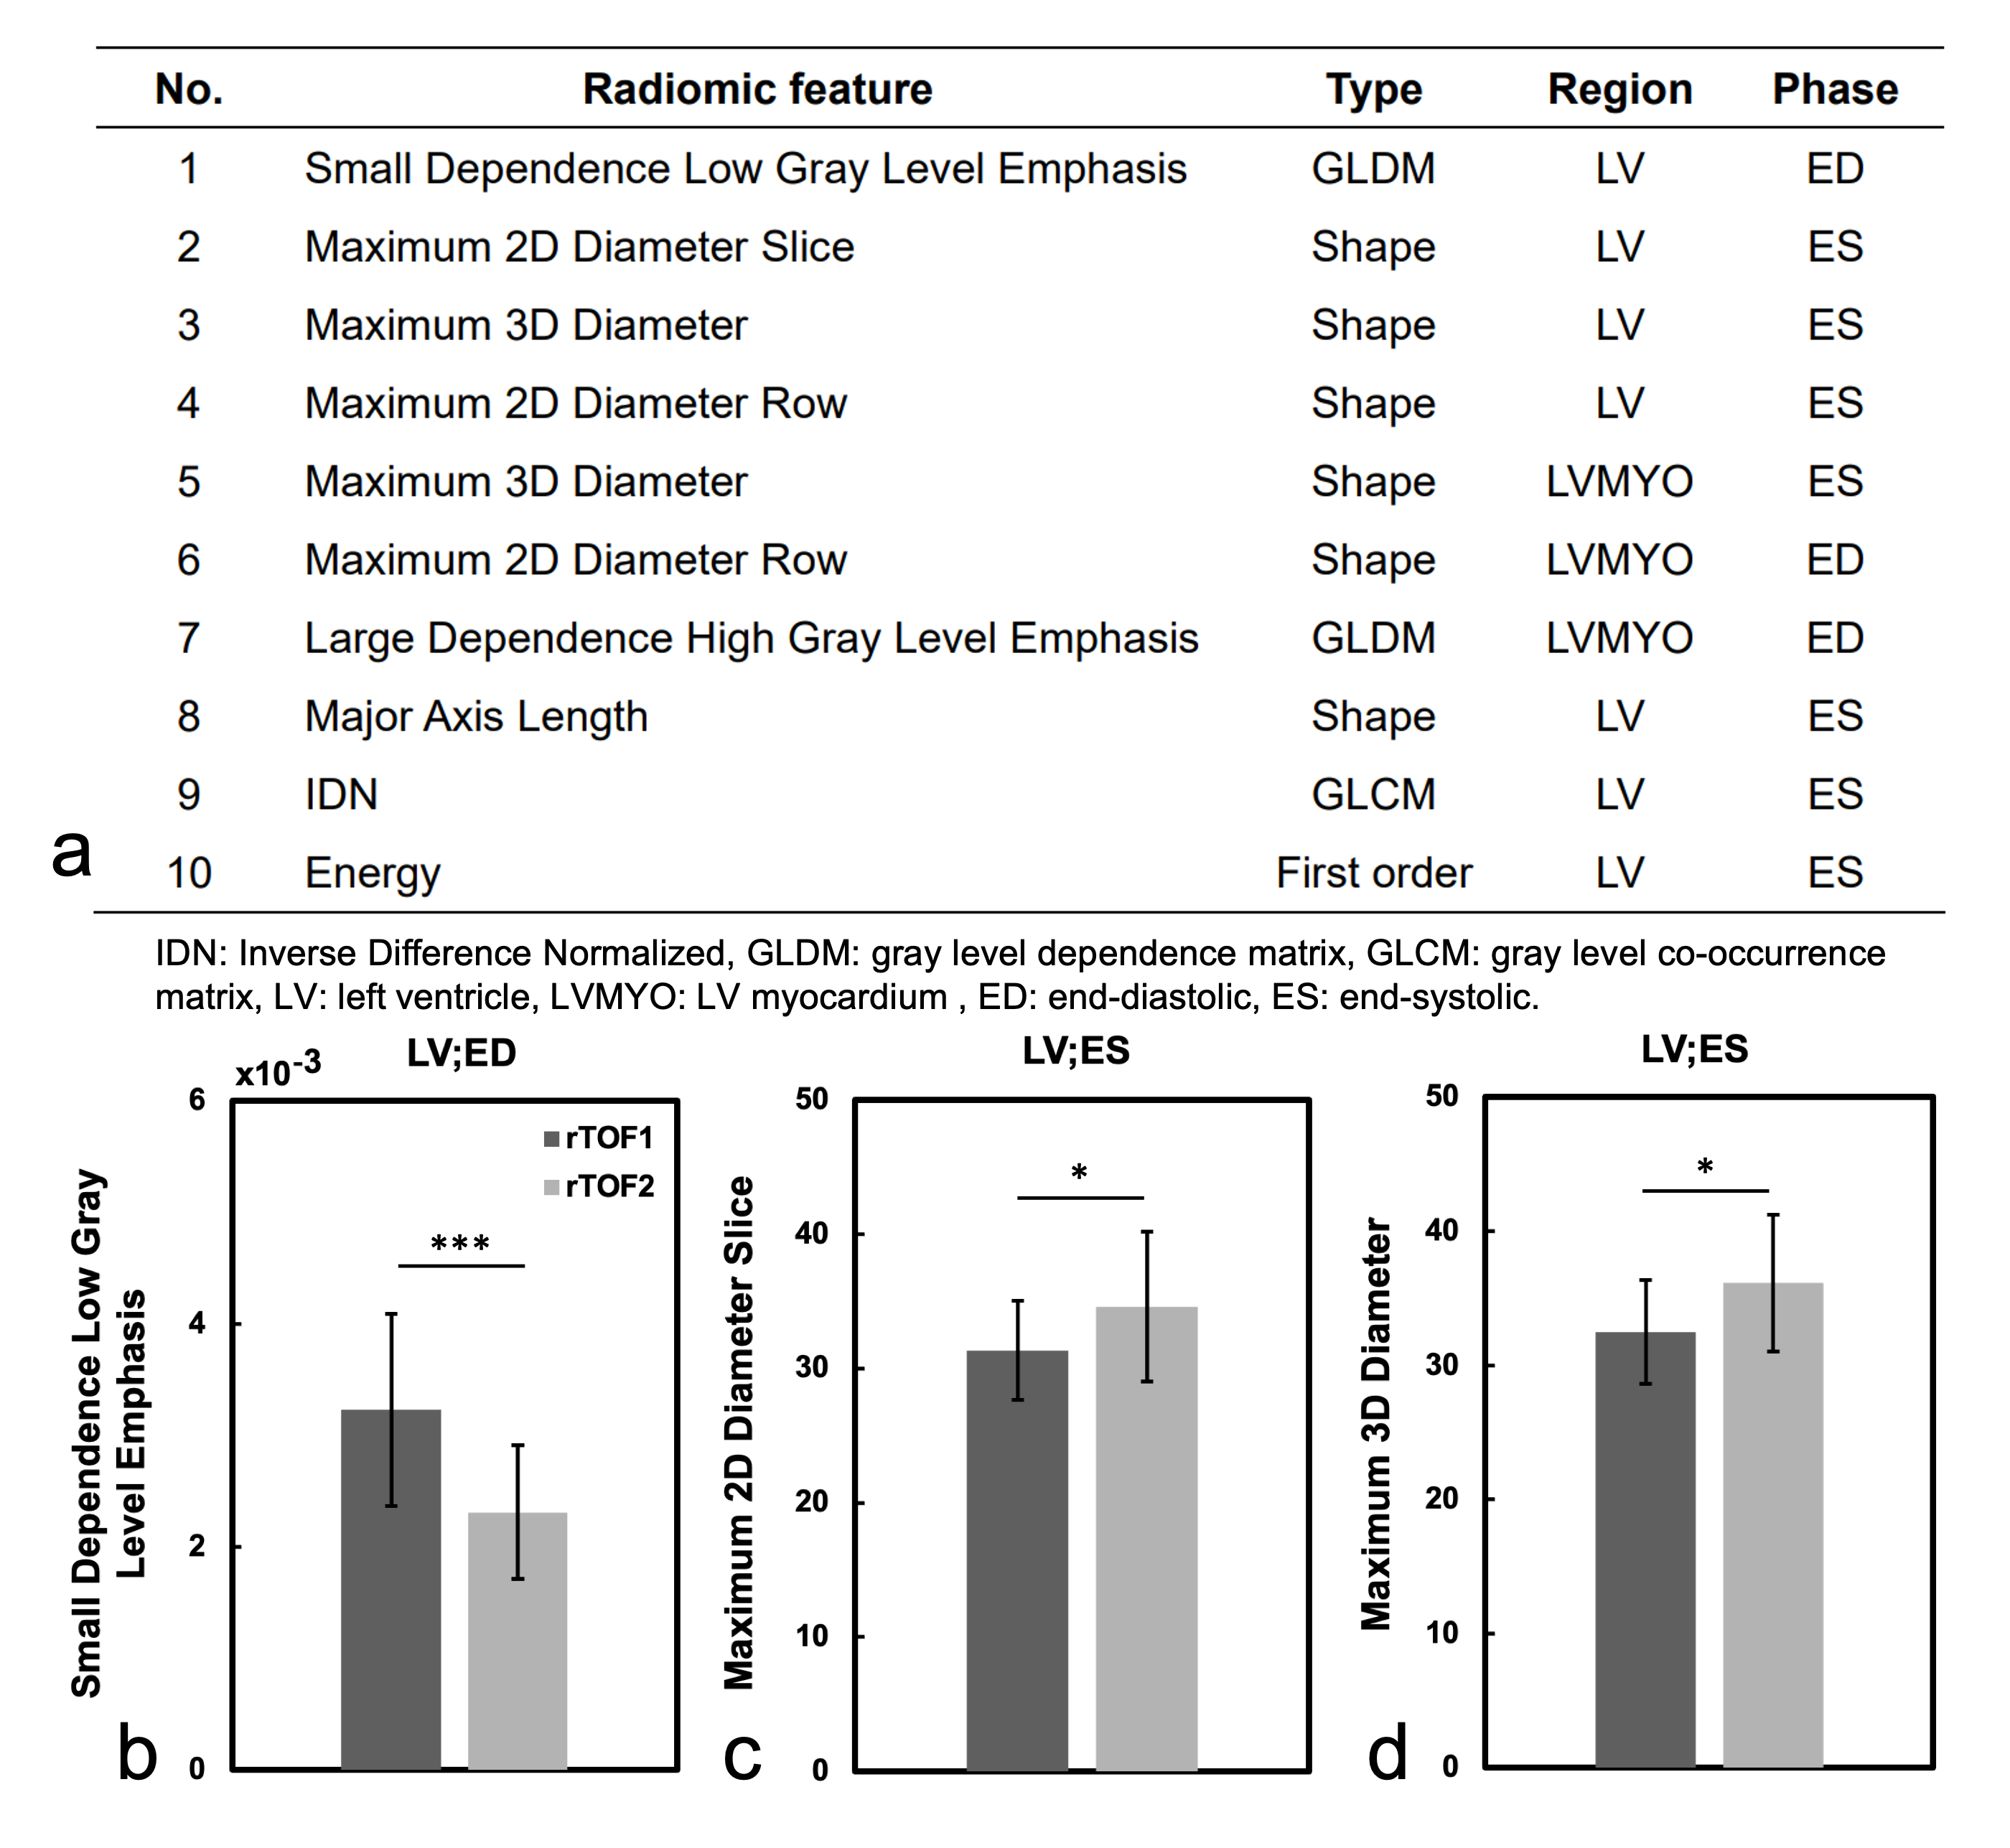
Figure 4a lists the 10 best-performing radiomic features, sorted by ANOVA f-value, for identification of the severity of RV dilation in rTOF patients. Figures 4(b-d) show the values of the top three radiomic features in rTOF1 and rTOF2 groups. Compared to rTOF1 group, the rTOF2 group presented lower small dependence low gray level emphasis (SDLGLE) in LV at ED (p<0.001). The rTOF2 group exhibited higher maximum 2D diameter slice (p=0.017) and maximum 3D diameter (p=0.021) than rTOF1 group in LV at ES.
Discussion and Conclusion
In this study, the LV radiomics+LV indices model, which utilized only LV images as information, presented comparable AUC with conventional LV,RV indices model to differentiate rTOF2 patients from rTOF1 patients.The decreased SDLGLE feature in LV at ED in rTOF2 group might describe severe RV dilation associated with increased preload and reduced diastolic vorticity in the LV19,20. The maximum 2D diameter slice and maximum 3D diameter, belonging to shape category, in LV at ES might suggest the potential of this model for identification of perceptible LV remodeling in rTOF2 group21 before substantial LV dysfunction.
In conclusion, the radiomics-based classification model can successfully identify the severity of RV dilation in rTOF patients by LV CMR images. The extracted features underlined the LV intracardiac flow alteration due to RV dilation and the potential LV remodeling in rTOF patients with severe RV dilation.
Acknowledgements
No acknowledgement found.References
1. Redington AN, et al. Determinants and Assessment of Pulmonary Regurgitation in Tetralogy of Fallot: Practice and Pitfalls. Cardiol Clin. 2006.
2. Ahmad N, et al. Influence of RV restrictive physiology on LV diastolic function in children after tetralogy of Fallot repair. J Am Soc Echocardiogr. 2012.
3. Friedberg MK, et al. Impaired right and left ventricular diastolic myocardial mechanics and filling in asymptomatic children and adolescents after repair of tetralogy of Fallot. Eur Heart J Cardiovasc Imaging. 2012.
4. Fernandes FP, et al. Impaired left ventricular myocardial mechanics and their relation to pulmonary regurgitation, right ventricular enlargement and exercise capacity in asymptomatic children after repair of tetralogy of Fallot. J Am Soc Echocardiogr. 2012.
5. Zhao F, et al. Congenital aortic disease: 4D magnetic resonance segmentation and quantitative analysis. Med Image Anal. 2009.
6. Suinesiaputra A, et al. Automated detection of regional wall motion abnormalities based on a statistical model applied to multislice short-axis cardiac MR images. IEEE Trans Med Imaging. 2009.
7. Suinesiaputra A, et al. Statistical shape modeling of the left ventricle: myocardial infarct classification challenge. IEEE J Biomed Health Inform. 2018.
8. Amini M,et al. Multi-level multi-modality (PET and CT) fusion radiomics: prognostic modeling for non-small cell lung carcinoma. Phys Med Biol. 2021.
9. Khodabakhshi Z,et al. Non-small cell lung carcinoma histopathological subtype phenotyping using high-dimensional multinomial multiclass CT radiomics signature. Comput Biol Med. 2021.
10. Khodabakhshi Z, et al. Overall Survival Prediction in Renal Cell Carcinoma Patients Using Computed Tomography Radiomic and Clinical Information. J Digit Imaging. 2021.
11. Baessler B, et al. Subacute and Chronic Left Ventricular Myocardial Scar: Accuracy of Texture Analysis on Nonenhanced Cine MR Images. Radiology. 2018.
12. Schofield R, et al. Texture analysis of cardiovascular magnetic resonance cine images differentiates aetiologies of left ventricular hypertrophy. Clin Radiol. 2019.
13. Di Noto T, et al. Radiomics for Distinguishing Myocardial Infarction from Myocarditis at Late Gadolinium Enhancement at MRI: Comparison with Subjective Visual Analysis. Radiol Cardiothorac Imaging. 2019.
14. Andrés Larroza, et al. Texture analysis for infarcted myocardium detection on delayed enhancement MRI. IEEE. 2017.
15. van Griethuysen JJM, et al. Computational radiomics system to decode the radiographic phenotype. Cancer Res. 2017.
16. Izquierdo C, et al. Radiomics-Based Classification of Left Ventricular Non-compaction, Hypertrophic Cardiomyopathy, and Dilated Cardiomyopathy in Cardiovascular Magnetic Resonance. Front Cardiovasc Med. 2021.
17. Martin-Isla C, et al. Image-based cardiac diagnosis with machine learning: a review. Front Cardiovasc Med. 2020.
18. Parmar C, et al. Machine Learning methods for Quantitative Radiomic Biomarkers. Sci Rep. 2015.
19. Gnanappa GK,et al. Severe right ventricular dilatation after repair of Tetralogy of Fallot is associated with increased left ventricular preload and stroke volume. Eur Heart J Cardiovasc Imaging. 2019.
20. Gnanappa GK,et al. Increased left ventricular stroke volume in children and adults with repaired Tetralogy of Fallot (rTOF) and moderate-severe right ventricular dilatation. Heart, Lung and Circulation. 2015.
21. He F, et al. Pulmonary Valve Replacement in Repaired Tetralogy of Fallot: Midterm Impact on Biventricular Response and Adverse Clinical Outcomes. Front Pediatr. 2022.
Figures