4864
Radiomics-Based Classification of Patients with Repaired Tetralogy of Fallot by Cardiac Magnetic Resonance1Department of Biomedical Engineering and Environmental Sciences, National Tsing Hua University, Hsinchu, Taiwan, 2Department of Radiology, Kaohsiung Veterans General Hospital, Kaohsiung, Taiwan, 3Department of Electrical Engineering, National Taiwan University of Science and Technology, Taipei, Taiwan, 4Department of Automatic Control Engineering, Feng Chia University, Taichung, Taiwan, 5Department of Pediatrics, Kaohsiung Veterans General Hospital, Kaohsiung, Taiwan, 6Dpartment of Pediatrics, National Yang Ming Chiao Tung University, Taipei, Taiwan
Synopsis
Keywords: Heart, Radiomics
Radiomics is a novel technique of advanced cardiac magnetic resonance (CMR) phenotyping by analyzing a couple of variables of cardiac shape and tissue texture. This study aimed to develop the radiomics-based classification model to differentiate rTOF patients from normal controls and evaluate the representative features of ventricular and myocardial abnormalities in rTOF patients. In conclusion, the radiomics-based classification model can successfully differentiate rTOF patients from normal controls with routine CMR cine images. The selected features underlined the right ventricular remodeling and left ventricular myocardium fibrosis in rTOF patients.Introduction
Tetralogy of Fallot (TOF) is a congenital heart defect that is characterized by four abnormalities, including ventricular septal defect, pulmonic stenosis, overriding aorta, and right ventricular hypertrophy. TOF patients with repaired operation (rTOF) appear abnormally myocardial fibrosis burden in both ventricles1. Cardiac magnetic resonance (CMR) is the reference standard for assessing cardiac structure and function. The identification of global and local abnormalities on CMR images is labor-intensive and reader-dependent2-4. Furthermore, the global indices, such as ejection fraction and chamber volumes, are overly simplistic and cannot capture subtle and complex myocardial alterations in an early disease stage5. Therefore, there is a need for automatically quantification of cardiac function with CMR images. CMR radiomics is a novel pixelwise quantification technique to derive several quantifiers for differentiation of ischemic heart disease with respects of ventricular and myocardial tissue shape and texture6. Previous works have shown its potential for identifying new imaging signatures in patients with hypertrophic cardiomyopathy and cardiovascular risk factors, illustrating the usefulness of CMR radiomics for improving the understanding of cardiac diseases7,8. This study aimed to develop the radiomic model to differentiate rTOF patients from normal controls and evaluate the representative features of ventricular and myocardial abnormalities in rTOF patients.Methods
Dataset: The study cohort contains 66 participants, including 50 rTOF patients (age 21.7±3 years, 23 females) and 16 normal controls (age 21.2±0.6 years, 8 females).CMR Imaging Protocol and Segmentation: MR images were acquired in a 3T scanner (Skyra, Siemens). The scanning parameters of cine balanced steady-state free procession (bSSFP) were TR/TE = 3.2/1.7 ms, flip angle=50°, voxel size=1.25x1.25x8 mm3, temporal resolution=46.8 ms (interpolated to 25 phases/cardiac cycle), a short-axis stack with 10-12 slices covering left and right ventricles (LV, RV) from base to apex with breath-hold and retrospective ECG-gating techniques. The LV and RV endocardial contours in LV and RV and the epicardial contours in LV were delineated automatically at end-diastolic (ED) and end-systolic (ES) phases using an institute-developed tool. These contours were used to define three regions of interest (ROIs) for radiomics analysis: RV blood pool, LV blood pool, and LV myocardium (LVMYO).
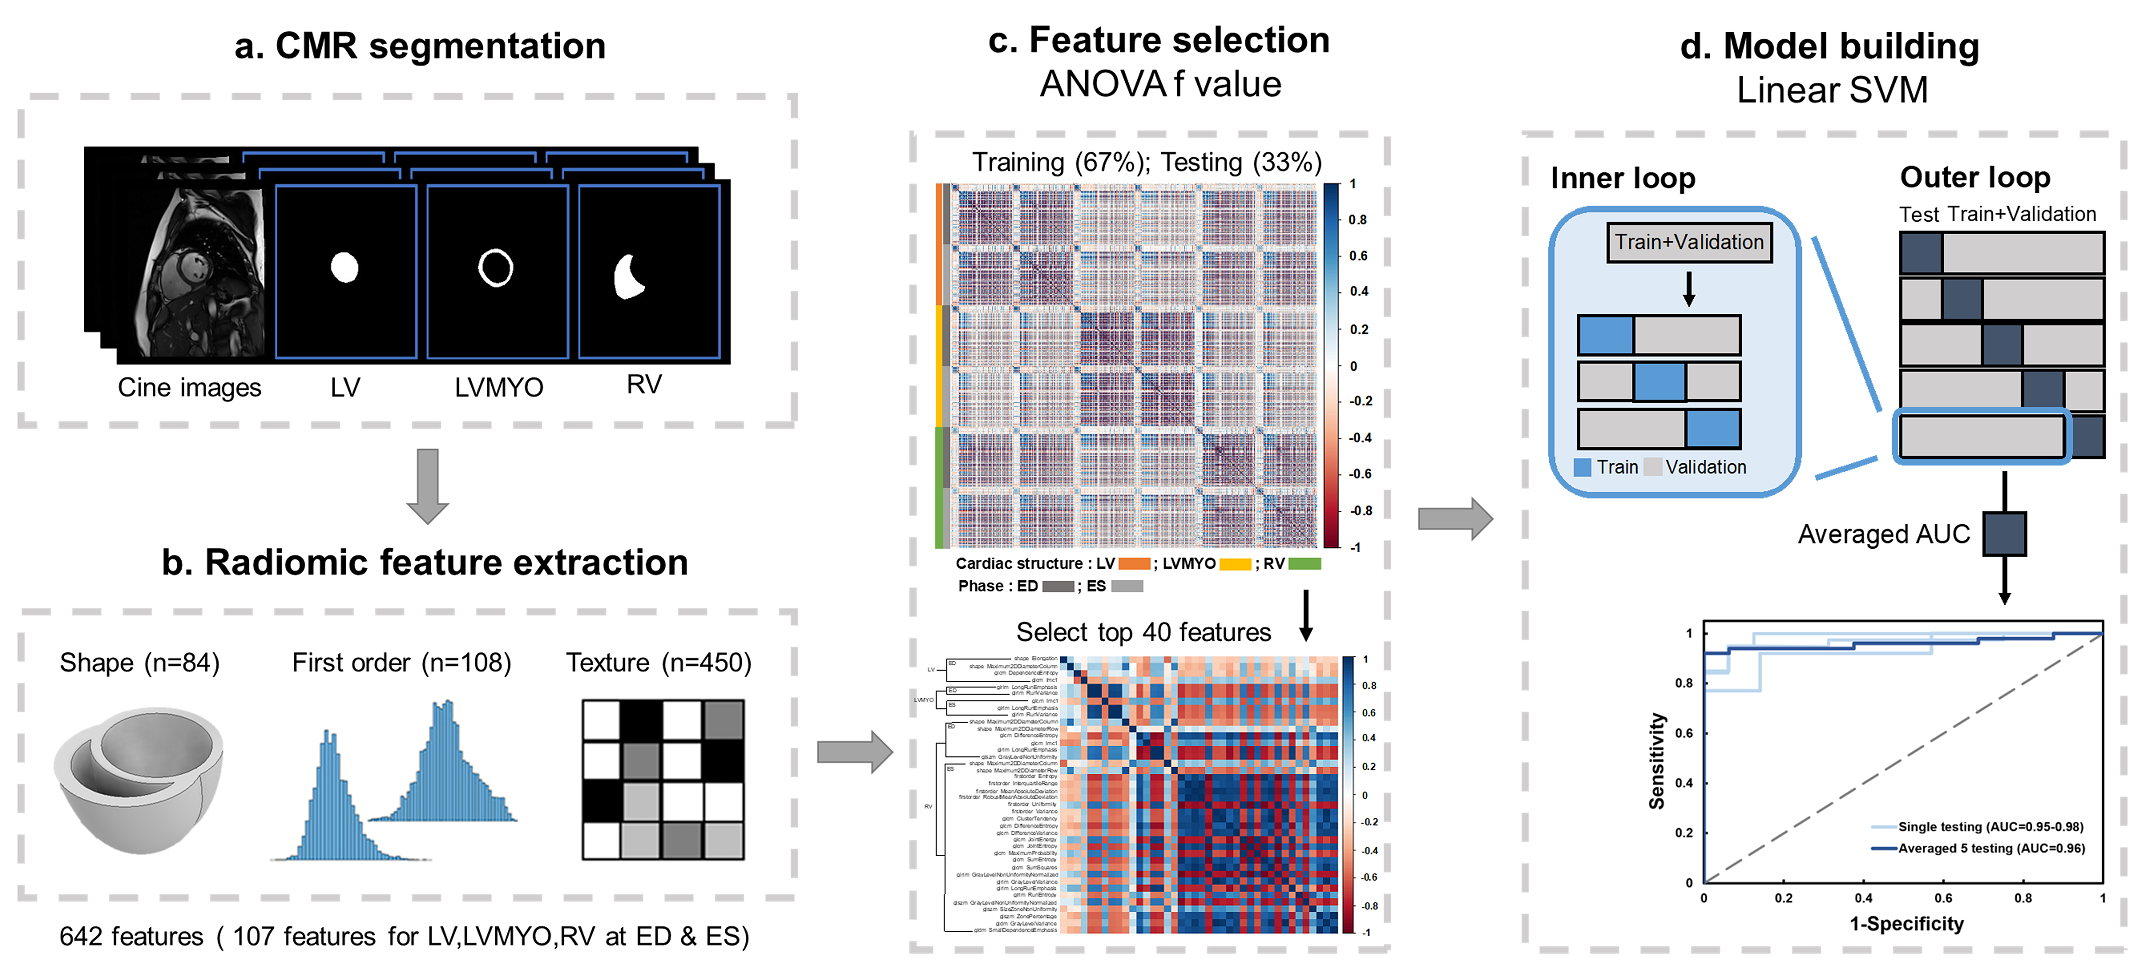
Radiomic feature extraction: Figure 1 illustrates the radiomics workflow. Pyradiomics (version 1.3.0)9 was used to automatically extract radiomic features. The features in shape and first order categories quantified morphological characteristics and histogram-based signal intensity characteristics, respectively. The features in texture analysis enable the detection of spatial inter-pixel interactions by using advanced matrix analysis.
Machine Learning Scheme: The ANOVA f-value was used to select the top 40 features for the establishment of classification model10. Because of its reliability in dealing with radiomics, we used the linear support vector machine (SVM) model for classification11,12. We performed a five-fold outer loop and a three-fold inner loop in the SVM model. The outer loop, 80% and 20% of the data sets were for training+validation and testing, respectively. The datasets in training+validation were divided into 67% and 33% for training and validation, respectively.
Statistics: Student t test was performed when appropriate. p<0.05 was considered statistically significant.
Results
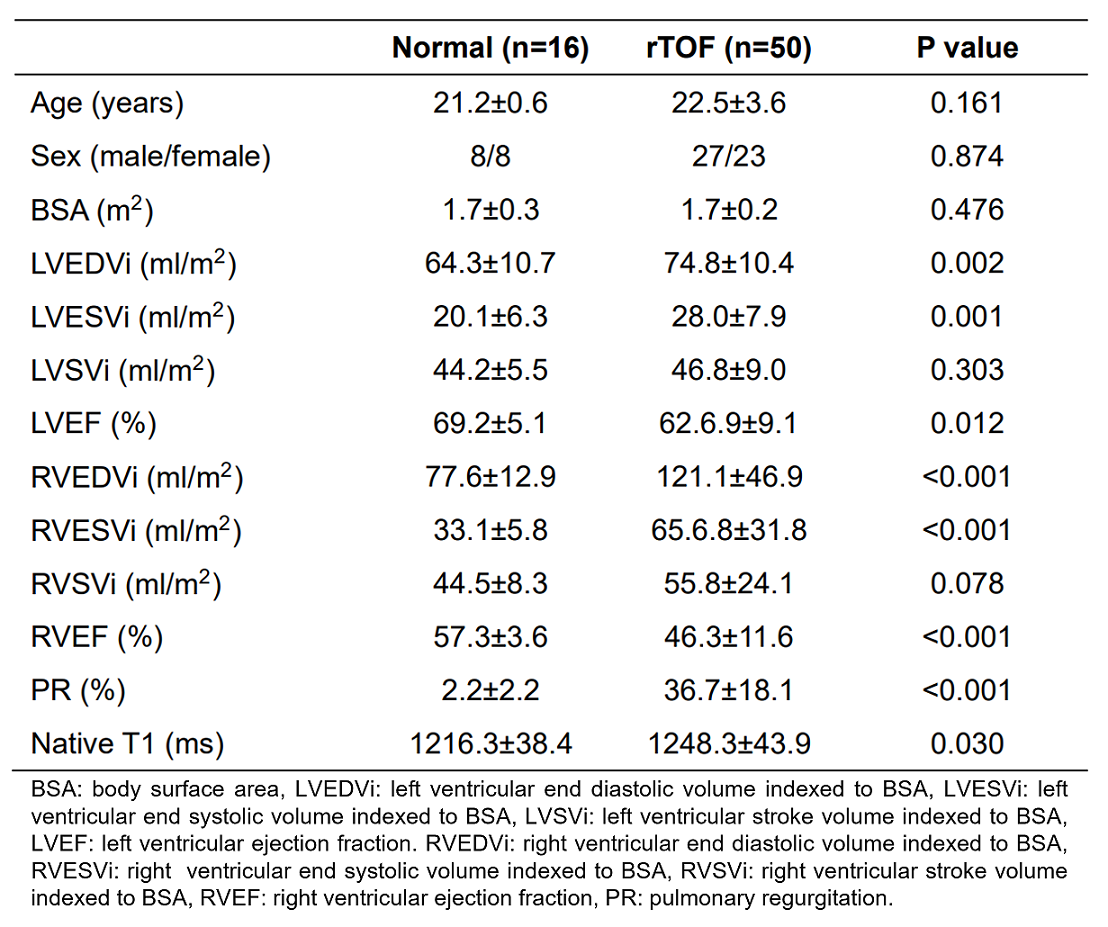
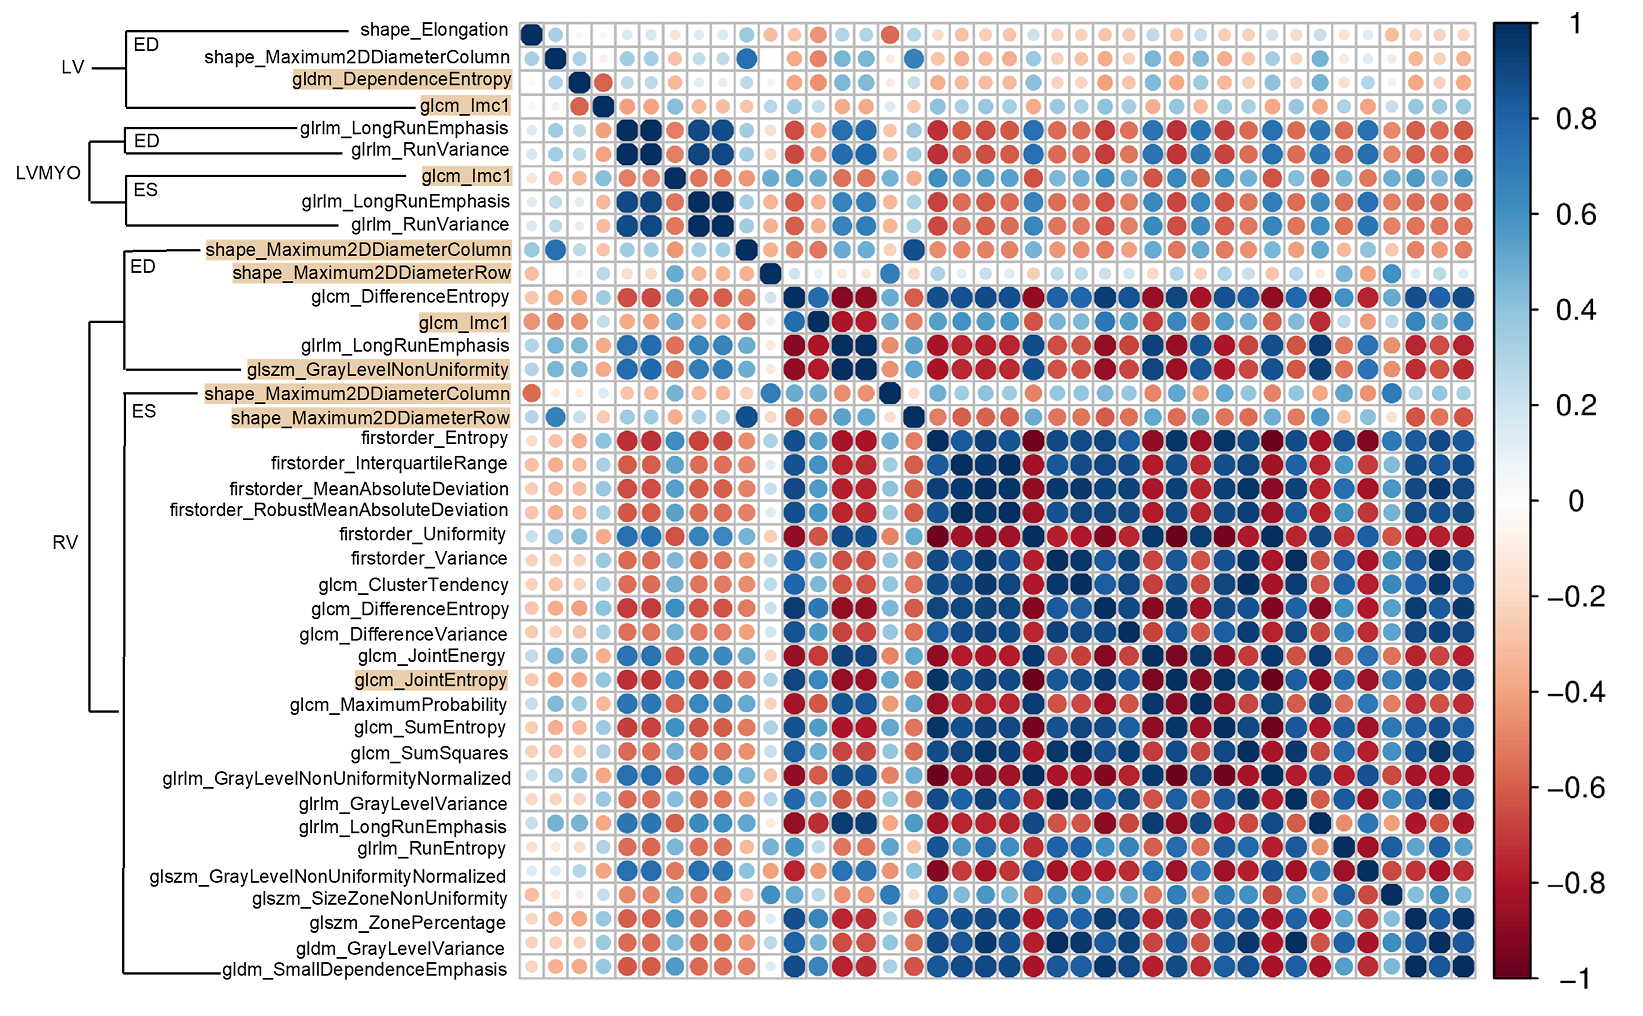
The demographics and hemodynamic characteristics in normal and rTOF groups were summarized in Table 1. The rTOF group exhibited increased indexed right ventricular end diastolic and systolic volumes (both p < 0.001) and reduced right ventricular ejection fraction (p<0.001).In the correlogram (Figure 2), 25 of 40 (62.5%) features for the identification of rTOF patients belonged to the RV at the ES phase and were strongly correlated with each other. 78% of the selected features belonged to RV while only 22% belonged to LV and LVMYO.
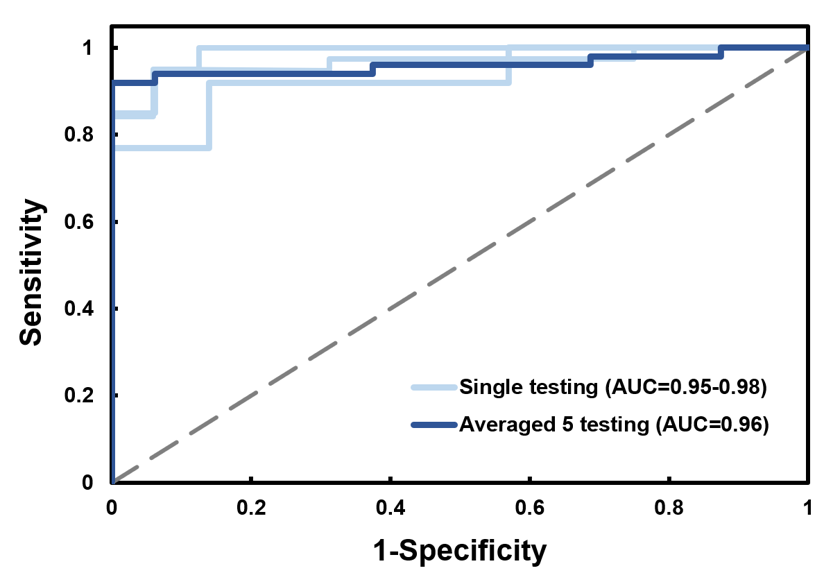
The area under curve (AUC) of the CMR radiomics model for differentiation of rTOF patients from normal controls was 0.96 (0.95-0.98), as shown in Figure 3.
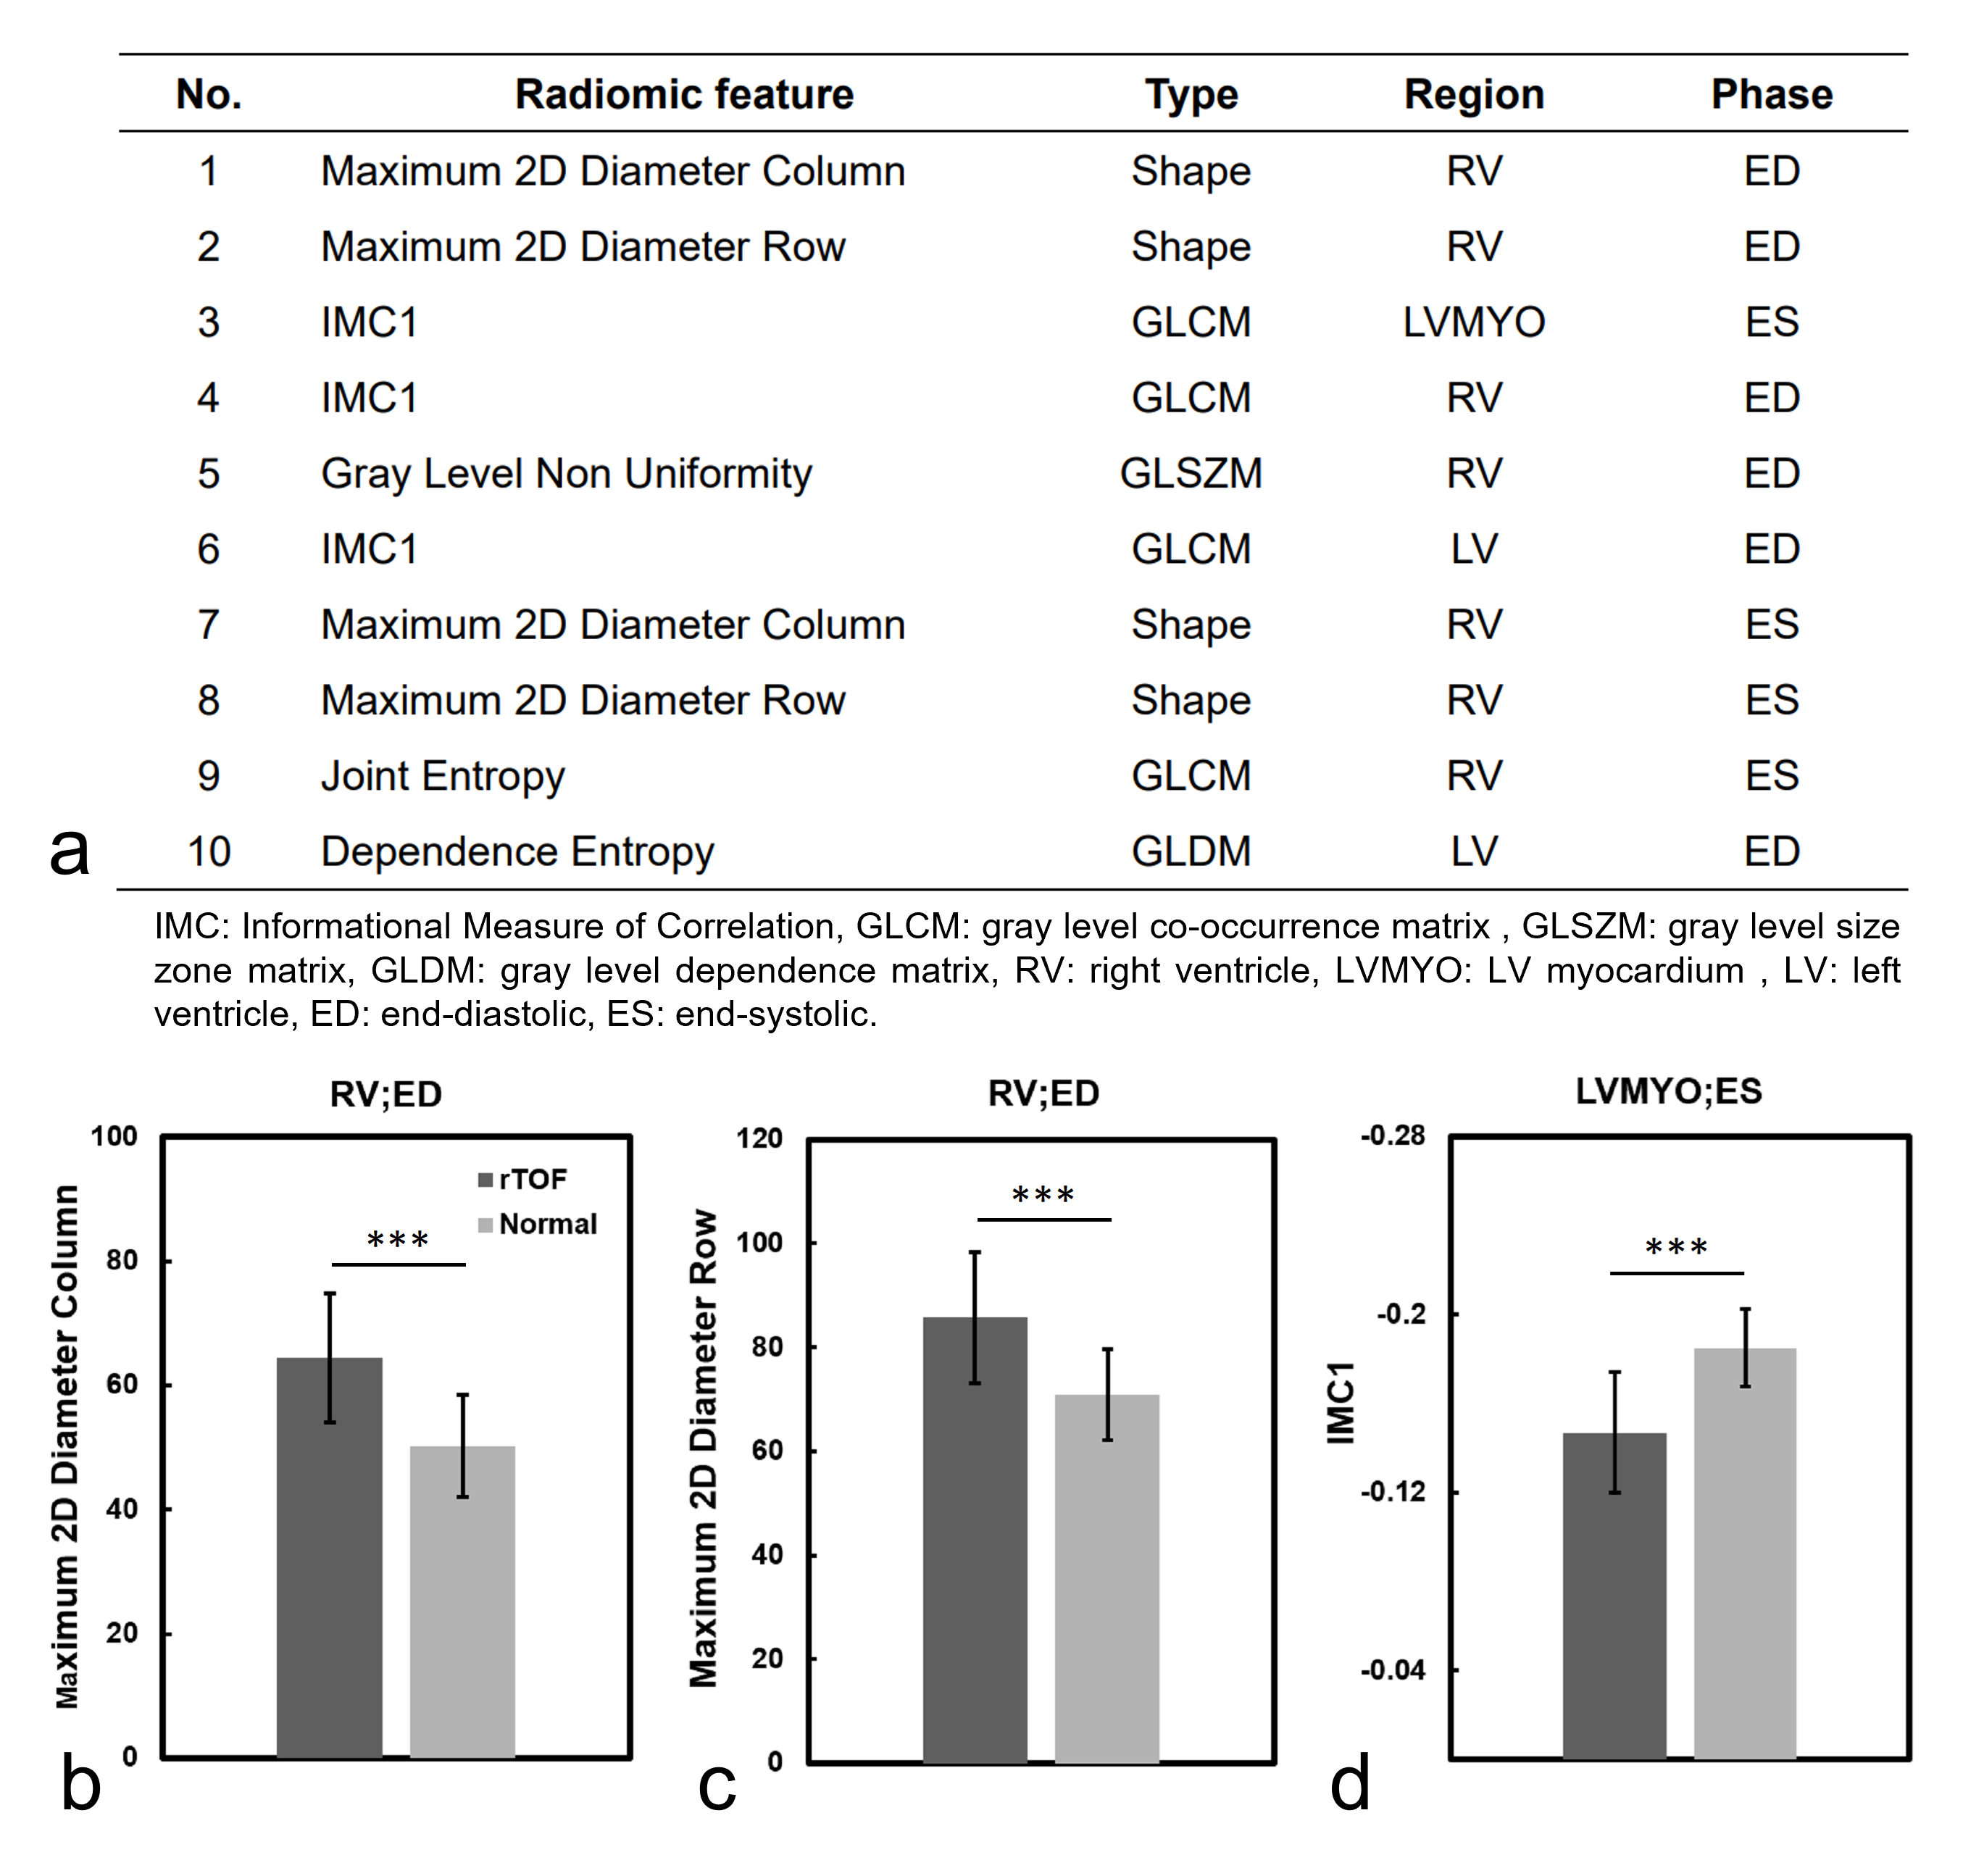
Figure 4a lists the 10 best-performing radiomic features, sorted by ANOVA f-value, for identification of rTOF patients. Figures 4(b-d) show the values of the top three radiomic features in rTOF and normal groups. In rTOF group, the maximum 2D diameter in column and row in RV at ED were higher than normal group (64.4±10.4 vs. 50.2±8.2 and 85.7±12.6 vs. 70.9±8.8, both p < 0.001). The third feature, informational measure of correlation 1 (IMC1), in rTOF group was higher than normal group (-0.15±0.03 vs. -0.18±0.02, p < 0.001) in LVMYO at ES.
Discussion and Conclusion
In this study, the proposed radiomics-based classification model demonstrated high AUC to differentiate rTOF patients from normal controls by CMR cine images. The first two selected features, belonged to the shape features in RV at ED, were significantly higher in rTOF group than normal group, reflecting the potential RV remodeling in rTOF patients. The third feature, IMC1, was significantly higher in rTOF group than normal group. This finding indicated the more heterogeneous LVMYO in cine images13 and a possible pattern of myocardial fibrosis in LVMYO in rTOF patients. These findings are in line with the existing clinical knowledge1,14.In conclusion, the radiomics-based classification model can successfully differentiate rTOF patients from normal controls with routine CMR cine images. The selected features underlined the RV remodeling and LVMYO fibrosis in rTOF patients.
Acknowledgements
No acknowledgement found.References
1. Kozak MF, et al. Diffuse myocardial fibrosis following tetralogy of Fallot repair: a T1 mapping cardiac magnetic resonance study. Pediatr Radiol. 2014.
2. Zhao F, et al. Congenital aortic disease: 4D magnetic resonance segmentation and quantitative analysis. Med Image Anal. 2009.
3. Suinesiaputra A, et al. Automated detection of regional wall motion abnormalities based on a statistical model applied to multislice short-axis cardiac MR images. IEEE Trans Med Imaging. 2009.
4. Suinesiaputra A, et al. Statistical shape modeling of the left ventricle: myocardial infarct classification challenge. IEEE J Biomed Health Inform. 2018.
5. Petersen SE, et al. The impact of cardiovascular risk factors on cardiac structure and function: Insights from the UK Biobank imaging enhancement study. PLoS ONE. 2017.
6. Raisi-Estabragh Z, et al. Cardiac magnetic resonance radiomics: basic principles and clinical perspectives. Eur Heart J Cardiovasc Imaging. 2020.
7. Cetin I, et al. Radiomics signatures of cardiovascular risk factors in cardiac MRI: results from the UK biobank. Front Cardiovasc Med. 2020.
8. Amano Y, et al. Relationship between extension or texture features of late gadolinium enhancement and ventricular tachyarrhythmias in hypertrophic cardiomyopathy. Biomed Res Int. 2018.
9. van Griethuysen JJM, et al. Computational radiomics system to decode the radiographic phenotype. Cancer Res. 2017.
10. Izquierdo C, et al. Radiomics-Based Classification of Left Ventricular Non-compaction, Hypertrophic Cardiomyopathy, and Dilated Cardiomyopathy in Cardiovascular Magnetic Resonance. Front Cardiovasc Med. 2021.
11. Martin-Isla C, et al. Image-based cardiac diagnosis with machine learning: a review. Front Cardiovasc Med. 2020.
12. Rauseo E, et al. New imaging signatures of cardiac alterations in ischemic heart disease and cerebrovascular disease using CMR radiomics. Front Cardiovasc Med. 2021.
13. Parekh V, et al. Radiomics: a new application from established techniques. Expert Rev Precis Med Drug Dev. 2016.
14. Hoelscher M, et al. Right ventricular dilatation in patients with pulmonary regurgitation after repair of tetralogy of Fallot: How fast does it progress? Ann Pediatr Cardiol. 2020.
Figures