4859
Characterization of left atrial remodelling and atrial fibrillation subtype using fractal analysis of late gadolinium enhanced MRI1Medical Imaging, The Ottawa Hospital, Ottawa, ON, Canada, 2Radiology, Radiation Oncology, and Medical Physics, University of Ottawa, Ottawa, ON, Canada, 3University of Ottawa Heart Institute, Ottawa, ON, Canada, 4Medicine, University of Ottawa, Ottawa, ON, Canada
Synopsis
Keywords: Arrhythmia, Heart
Atrial Fibrillation (AF) is a heart rhythm disorder of the left atrium (LA) that is associated with an increased risk of stroke and death. AF has been known to induce morphological changes of the LA that may be detectable with fractal analysis. The purpose of this study was to assess whether there are differences in fractal dimension of the LA based on AF severity or subtype. The paroxysmal AF groups demonstrated increased fractal dimension compared to persistent or permanent groups. LA dilatation associated with persistent or permanent AF may explain this result, but this requires validation in a larger cohort.
Introduction
Atrial Fibrillation (AF) is a heart rhythm disorder of the left atrium (LA) that is associated with an increased risk of stroke and death [1,2]. AF can be classified as paroxysmal, persistent, or long-standing persistent (permanent) AF [3]. While catheter ablation is highly successful for most patients with paroxysmal AF, it is much less effective for patients with persistent and permanent AF [4]. Clinical factors, such as symptom severity, AF duration and LA size have a limited role in predicting treatment outcomes, as the extent of atrial disease is often underestimated. While atrial imaging with late gadolinium enhanced MRI (LGE) has identified independent predictors of ablation outcomes, there is no uniform method of measuring the extent of atrial remodelling [5,6].AF has been known to induce morphological changes of the LA that may be detectable with advanced imaging assessment of the LA morphology [7,8]. Fractal analysis may offer a quantitative imaging approach for shape characterization. For example, the fractal dimension has been used to quantify the extent of shape complexity of the left ventricle on cine MRI in patients with hypertrophic cardiomyopathy and left ventricular non-compaction [9]. With respect to AF, fractal measurements of the LA on cardiac computed tomography scans have been shown to be associated with likelihood of post-ablation AF recurrence, independent of other clinical variables [10]. The objective of this study is to assess whether there are structural differences in the atria of patients with different subtypes of AF on LGE MRI, by investigating differences in fractal dimension of the LA wall.
Methods
A total of 38 patients with AF participated in this prospective study, including 16 with non-athletic paroxysmal AF, 6 endurance athletes with paroxysmal AF, 7 with persistent AF, and 9 with permanent AF. All patients underwent cardiac MR imaging on a 1.5T clinical scanner. Functional LA parameters were assessed using cine MR and included LA ejection fraction (LA EF), LA stroke volume (LA SV), as well as the minimum and maximum LA volumes. LGE imaging was performed approximately 20-25 min after injection of 0.2 mmol/kg Gadobutrol using a 3D inversion recovery prepared gradient echo sequence. The 3D images were acquired axially with a voxel size of 1.25×1.25×2.5 mm3, which was subsequently subsampled to 0.625×0.625×1.25 mm3. All MR images were ECG gated and acquired during the end-diastolic phase of the respiratory cycle, i.e., LA diastole phase. Participants were instructed to breathe freely during image acquisition and respiratory navigator gating was used to ensure consistent data collection during the end-expiration phase of the respiratory cycle. Images were acquired with an inversion time selected to null the signal from normal ventricular myocardium (340-360 ms).The image analysis workflow is depicted in Figure 1. A trained cardiothoracic radiologist manually segmented the left atrial wall on LGE images using the Cardiac MRI Toolkit extension (CARMA Center, University of Utah, UT, USA https://github.com/carma-center/carma_slicer_extension/) in 3D Slicer [11]. LA wall contours were exported as binary masks for use in subsequent fractal analysis. Fractal analysis was performed using a modified box-counting method in FracLac (ImageJ plug-in, Karperien, A https://imagej.nih.gov/ij/plugins/fraclac/fraclac.html) and the median fractal dimension was computed for each stack of LA wall contours (‘Global median Db’). Differences in the Global median Db among the four groups were initially assessed using Kruskal Wallis tests, with post hoc Mann-Whitney U testing. The difference in Global median Db between paroxysmal AF groups (non-athletic and athletic) and persistent + permanent AF groups was also assessed using a Mann-Whitney U test. Relationships between Global median Db, functional LA parameters, and were investigated using Spearman’s correlation coefficients. Significance was assessed at the p<0.05 level.
Results
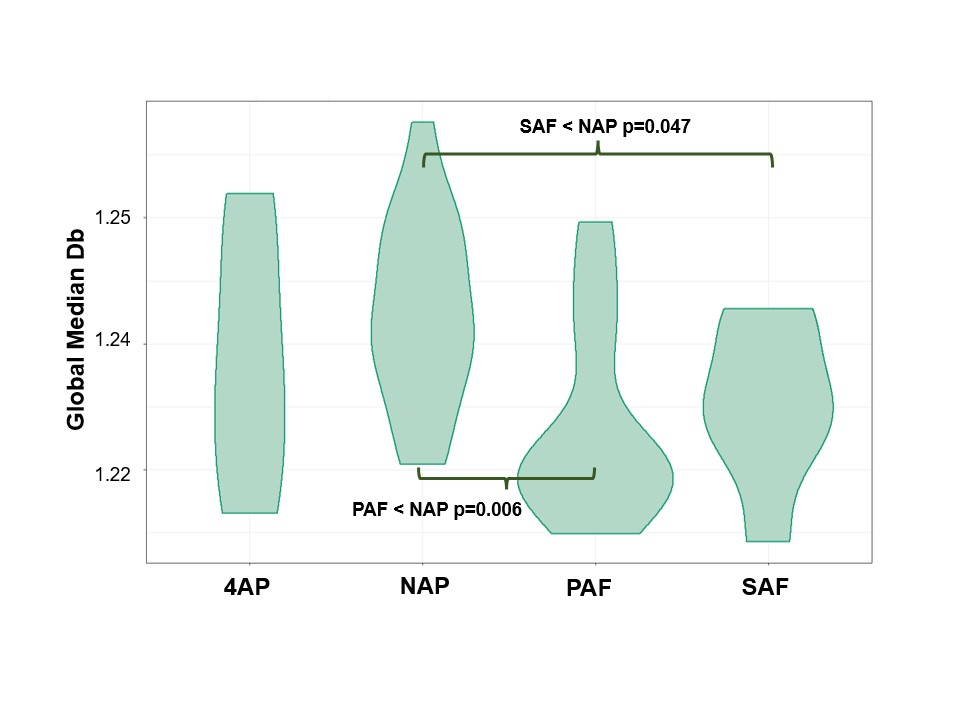
Overall there was a significant difference in Global median Db across AF subtypes (p=0.046; Figure 2).The Global median Db associated with permanent and persistent AF groups were significantly lower than that of the non-athlete paroxysmal AF group (p=0.006 and 0.047, respectively). When the four AF subgroups were assessed as two larger groups, the Global median Db associated with the paroxysmal AF groups was significantly greater than that of the permanent+persistent groups (median (IQR) 1.24 (1.23-1.26) vs 1.22 (1.22-1.24), respectively; p=0.01).The relationships between Global median Db and functional LA parameters are depicted in Figure 3 for all patients. When all AF groups were considered together, the Global median Db was negatively correlated with both maximum and minimal LA volumes (Spearman’s rho= -0.55 and -0.49, respectively; p<0.005 for each; Figure 3). Conversely, there was a significant direct correlation between Global median Db and LA EF (Spearman’s rho=0.44, p=0.004). There was no significant correlation between Global median Db and LA SV (Spearman’s rho=-0.01, p=0.87).
Conclusions
There are morphological differences in the LA between and among AF subtypes that appear to be detectable with quantitative assessment of shape complexity on LGE MRI. The paroxysmal AF groups demonstrated increased fractal dimension compared to persistent or permanent groups. LA dilatation associated with persistent/permanent group may explain the decreased shape complexity, but this requires validation in a larger cohort. Structural differences observed in patients with AF classification detected using fractal analysis may be the result of differences in physiopathology, cardiac remodelling and arrhythmogenic substrate.Acknowledgements
Funding for this study was supported by the University of Ottawa Heart Institute Oracle Innovation Cluster Pilot Fund. The authors gratefully acknowledge the technical contributions of Owen Clarkin, PhD.References
1. Benjamin EJ, Wolf PA, D'Agostino RB, Silbershatz H, Kannel WB, Levy D. Impact of atrial fibrillation on the risk of death: the Framingham Heart Study. Circulation. 1998;98(10):946-952.
2. Skanes AC, Healey JS, Cairns JA, et al. Focused 2012 update of the Canadian Cardiovascular Society atrial fibrillation guidelines: recommendations for stroke prevention and rate/rhythm control. The Canadian journal of cardiology. 2012;28(2):125-136.
3. Parkash R, Tang AS, Sapp JL, Wells G. Approach to the catheter ablation technique of paroxysmal and persistent atrial fibrillation: a meta-analysis of the randomized controlled trials. J Cardiovasc Electrophysiol 2011;22(7):729-738.
4. Calkins H, HRS/EHRA/ECAS EXPERT CONSENSUS STATEMENT 2012 HRS/EHRA/ECAS expert consensus statement on catheter and surgical ablation of atrial fibrillation: recommendations for patient selection, procedural techniques, patient management and follow-up, Definitions, E. Eur Niv Ad. 14 (2012) 528–606.
5. Mahnkopf C, Badger TJ, Burgon NS et al. Evaluation of the left atrial substrate in patients with lone atrial fibrillation using delayed-enhanced MRI: implications for disease progression and response to catheter ablation. Heart Rhythm 2010;7(10):1475-1481.
6. Oakes RS, Badger TJ, Kholmovski EG et al. Detection and quantification of left atrial structural remodeling with delayed-enhancement magnetic resonance imaging in patients with atrial fibrillation. Circulation 2009;119(13):1758-1767.
7. Delgado V, Di Biase L, Leung M, Romero J, Tops LF, Casadei B, Marrouche N, Bax JJ. Structure and function of the left atrium and left atrial appendage: AF and stroke implications.J Am Coll Cardiol. 2017; 70:3157–3172.
8. Whitaker J, Rajani R, Chubb H, Gabrawi M, Varela M, Wright M, Niederer S, O’Neill MD. The role of myocardial wall thickness in atrial arrhythmogenesis.Europace. 2016; 18:1758–1772.
9. Captur G, Karperien AL, Hughes AD, Francis DP, Moon JC. The fractal heart - embracing mathematics in the cardiology clinic. Nat Rev Cardiol 2017;14(1):56-64.
10. Firouznia M, Feeny AK, LaBarbera MA, McHale M, Cantlay C, Kalfas N, Schoenhagen P, Saliba W, Tchou P, Barnard J, Chung MK, Madabhushi A. Machine Learning–Derived Fractal Features of Shape and Texture of the Left Atrium and Pulmonary Veins From Cardiac Computed Tomography Scans Are Associated With Risk of Recurrence of Atrial Fibrillation Postablation. Circ Arrhythm Electrophysiol 2021;14(3):e009265.
11. Fedorov A, Beichel R, Kalpathy-Cramer J, Finet J, Fillion-Robin J-C, Pujol S, Bauer C, Jennings D, Fennessy F, Sonka M, Buatti J, Aylward S, Miller JV, Pieper S, Kikinis R. 3D slicer as an image computing platform for the quantitative imaging Network, Magn Reson Imaging 2012;30(9):1323–1341.
Figures