4858
Magnetic resonance multitasking T1 mapping in atrial fibrillation1Department of Cardiology, The Second Affiliated Hospital, Zhejiang University School of Medicine, Hangzhou, China, 2Key Lab of Cardiovascular Disease of Zhejiang Province, Hangzhou, China, 3UIH America, Inc., Houston, TX, United States, 4Department of Radiology, The Second Affiliated Hospital, Zhejiang University School of Medicine, Hangzhou, China
Synopsis
Keywords: Arrhythmia, Arrhythmia
CMR multitasking T1 mapping, a recently proposed free-breathing, non-ECG technique, was evaluated in atrial fibrillation patients. It demonstrated good image quality, differentiated patients from healthy participants, and correlated with important cardiac function biomarkers. It is a promising T1 mapping tool in atrial fibrillation patients.Background
Cardiovascular magnetic resonance (CMR) T1 mapping provides valuable information in myocardium abnormalities [1-3]. Atrial fibrillation (AF) is associated with high morbidity and mortality. AF patients are characterized by poor health conditions, inability to hold breath, and irregular heart rhythm and short R-R intervals that disturb signal acquisition in the optimal cardiac phase [4,5]. These made T1 mapping using the gold standard modified look-locker inversion recovery (MOLLI) sequence challenging [6].Recently, a free-breathing, non-ECG technique using multitasking was proposed for cardiac-phase-resolved myocardial T1 mapping [7]. The authors hypothesized that this technique may benefit participants with arrhythmia but conducted no study.
The purpose of this prospective study was to evaluate MR multitasking T1 mapping in AF.
Method
Phantoms: The T1 array in an ISMRM/NIST system phantom was used to assess T1 mapping accuracy [8].Participants: 34 AF patients and 21 healthy volunteers were recruited after written consent. Patients were eligible if they were diagnosed with AF regardless of the cause and had not yet received catheter ablation or pacemaker. The exclusion criteria were age < 18 years, hemodynamically unstable, unable to finish scan, and severe renal abnormality. Local IRB approved the study.
MRI protocols: MRI was performed on a 3T system (uMR 790, United Imaging, Shanghai, China). Multitasking sequence was the same as previously published [7]. Short-axis T1 mapping by MOLLI and multitasking used 3 matched slices. Cardiac functions were assessed on retrospectively gated cine images. Two patients received 0.2 mmol/kg gadodiamide (MultiHance, Bracco Sine, China) and underwent phase-sensitive-inversion-recovery (PSIR) scans. Five patients repeated the study on the same day. MRI parameters are listed in Table 1.
Image analysis: One radiologist analyzed the images using Cvi42 (Circle Cardiovascular Imaging Inc., Calgary, Canada). Myocardial T1 values were measured from ROIs drawn in the short‐axis slices. Papillary muscles and blood-pool were avoided. Average T1 values of the basal, mid, and apical slices was defined as the mean value. Left ventricle (LV) and left atrium (LA) function metrics and strains were analyzed by standard techniques.
Non-MRI biomarkers: An echocardiogram scan was performed on the same day as MR. Laboratory results were collected from the patients before discharge.
Statistical analysis: Categorical and consecutive data were presented as mean ± standard deviation (normal distribution), or median ± quartile (not normal distribution). Differences were tested by paired t-test or Kruskal-Wallis test. Bland‐Altman analysis and Pearson correlation were used. Correlation analysis was performed between select biomarkers and multitasking T1 values. Intra-observer repeatability was assessed using intraclass correlation coefficient (ICC). Statistical significance was defined as p < 0.05.
Results
Demographic information and biomarker results are listed in Table 2. The echocardiogram revealed an enlarged LA dimension, in agreement with MR findings that AF group had a higher LA volume than the healthy group.Both MOLLI and multitasking correlated strongly (R=0.99, p<0.001 for both) with the phantom T1 values.
Multitasking T1 exhibited a significant difference (p<0.001) between the AF (1161.1 ±54.1 ms) and the healthy (1104.8 ±48.6 ms) groups. Similarly, MOLLI T1 mapping exhibited a significant difference (p<0.001) between the AF (1166.5 ±74.8 ms) and the healthy (1104.8 ±45.9 ms) groups.
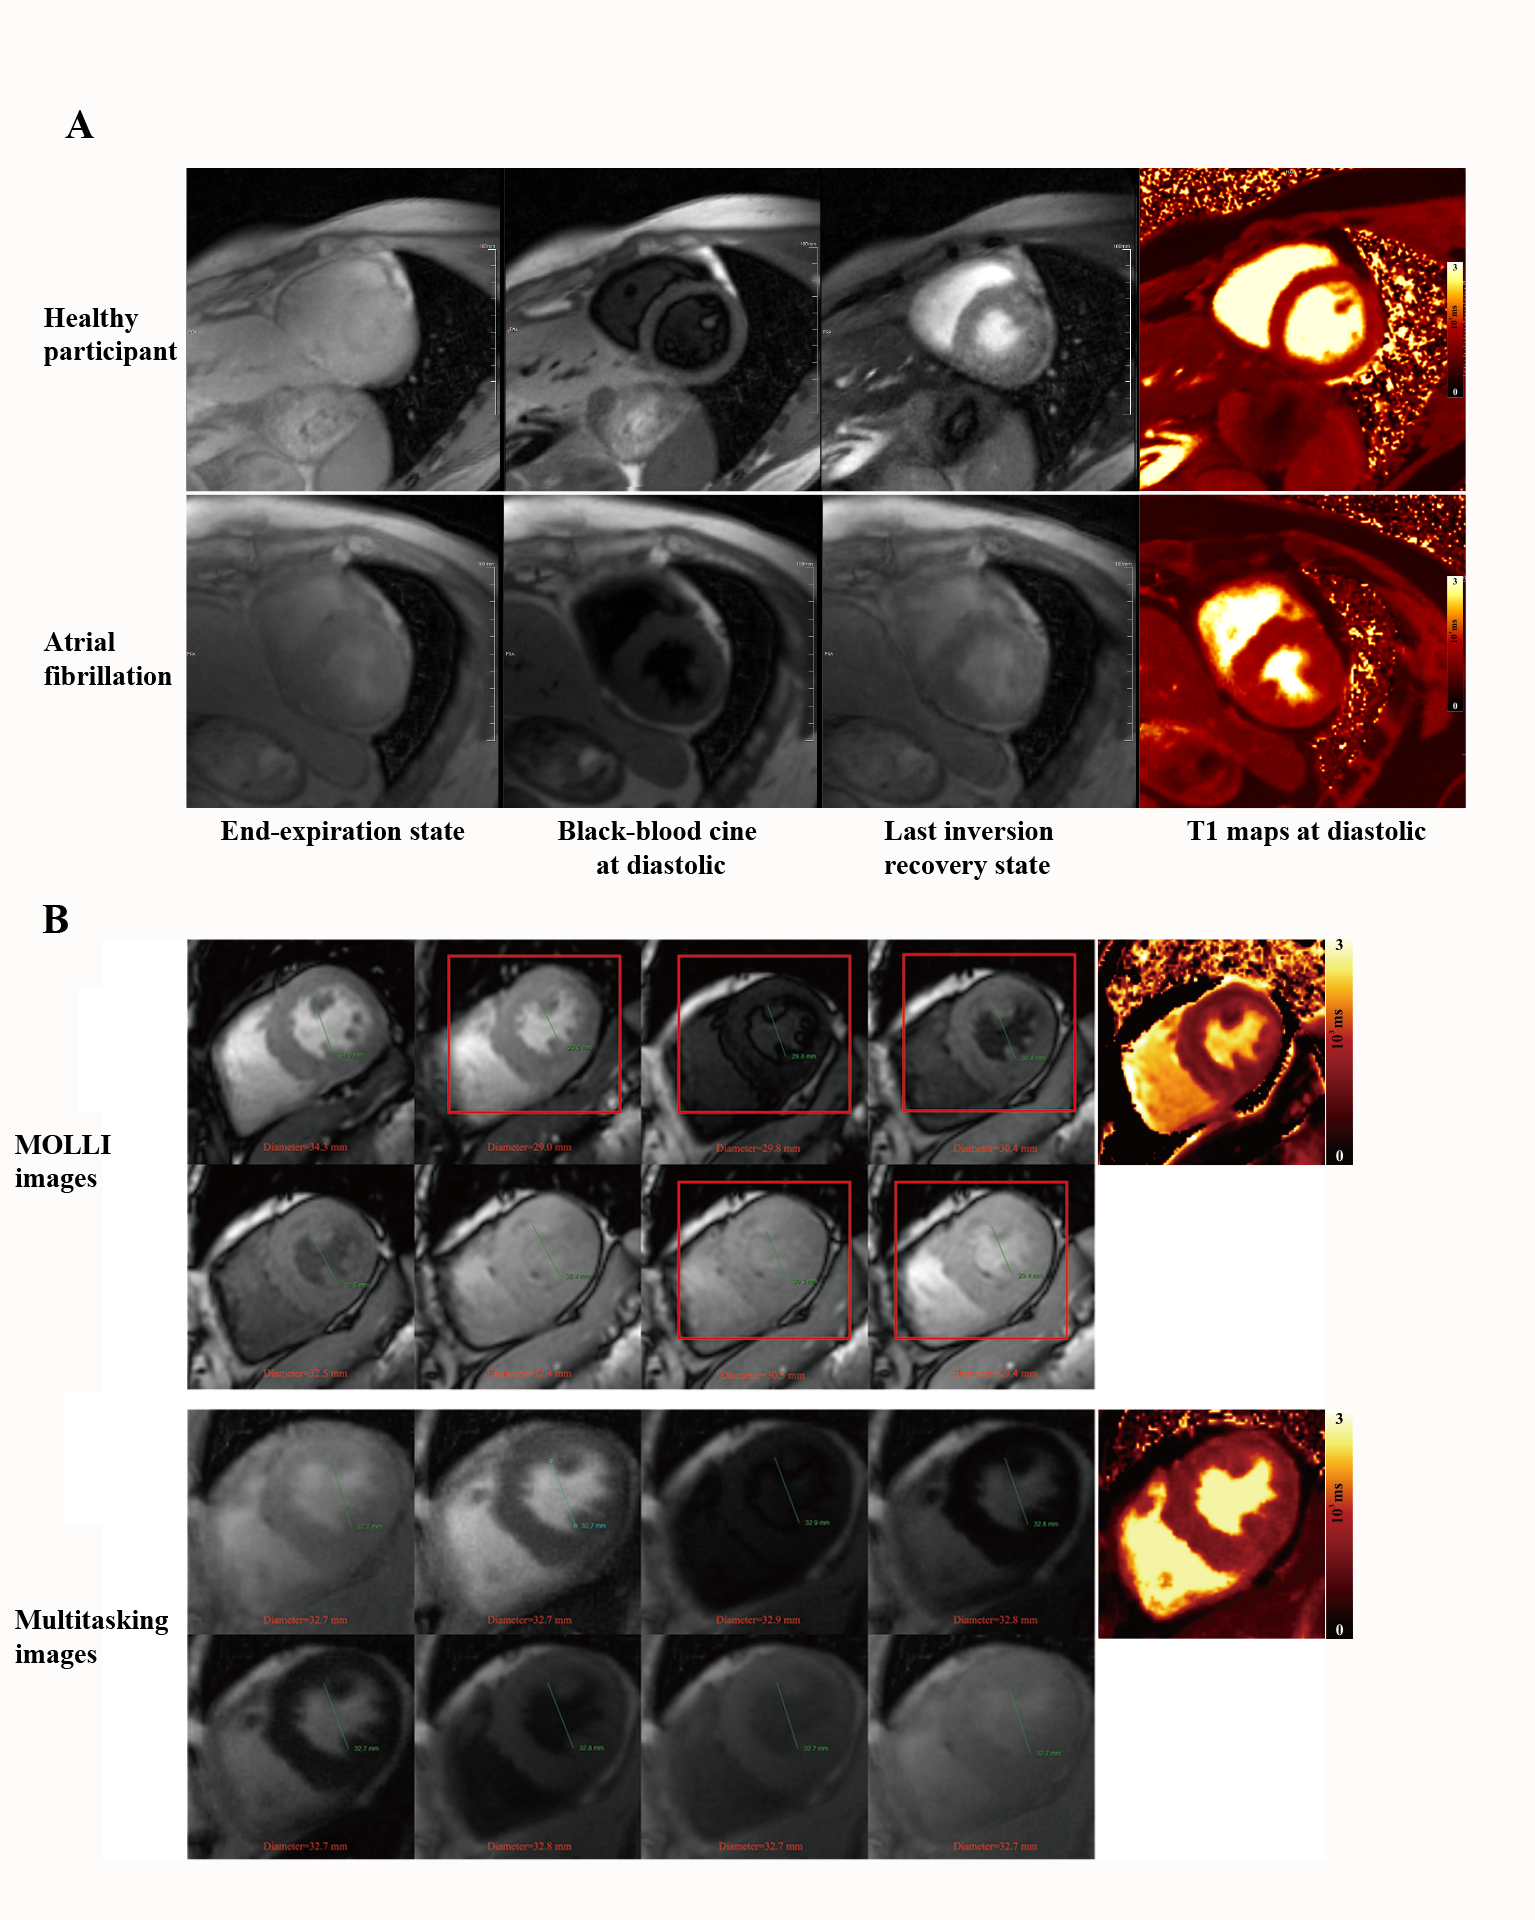
Typical multitasking images are shown in Figure 1A. AF multitasking images were free of artifacts and displayed consistent LV inner diameter that indicates the same cardiac phase, while MOLLI had artifacts and changing diameter that implies miss-triggering and possible erroneous T1 fitting (Figure 1B).
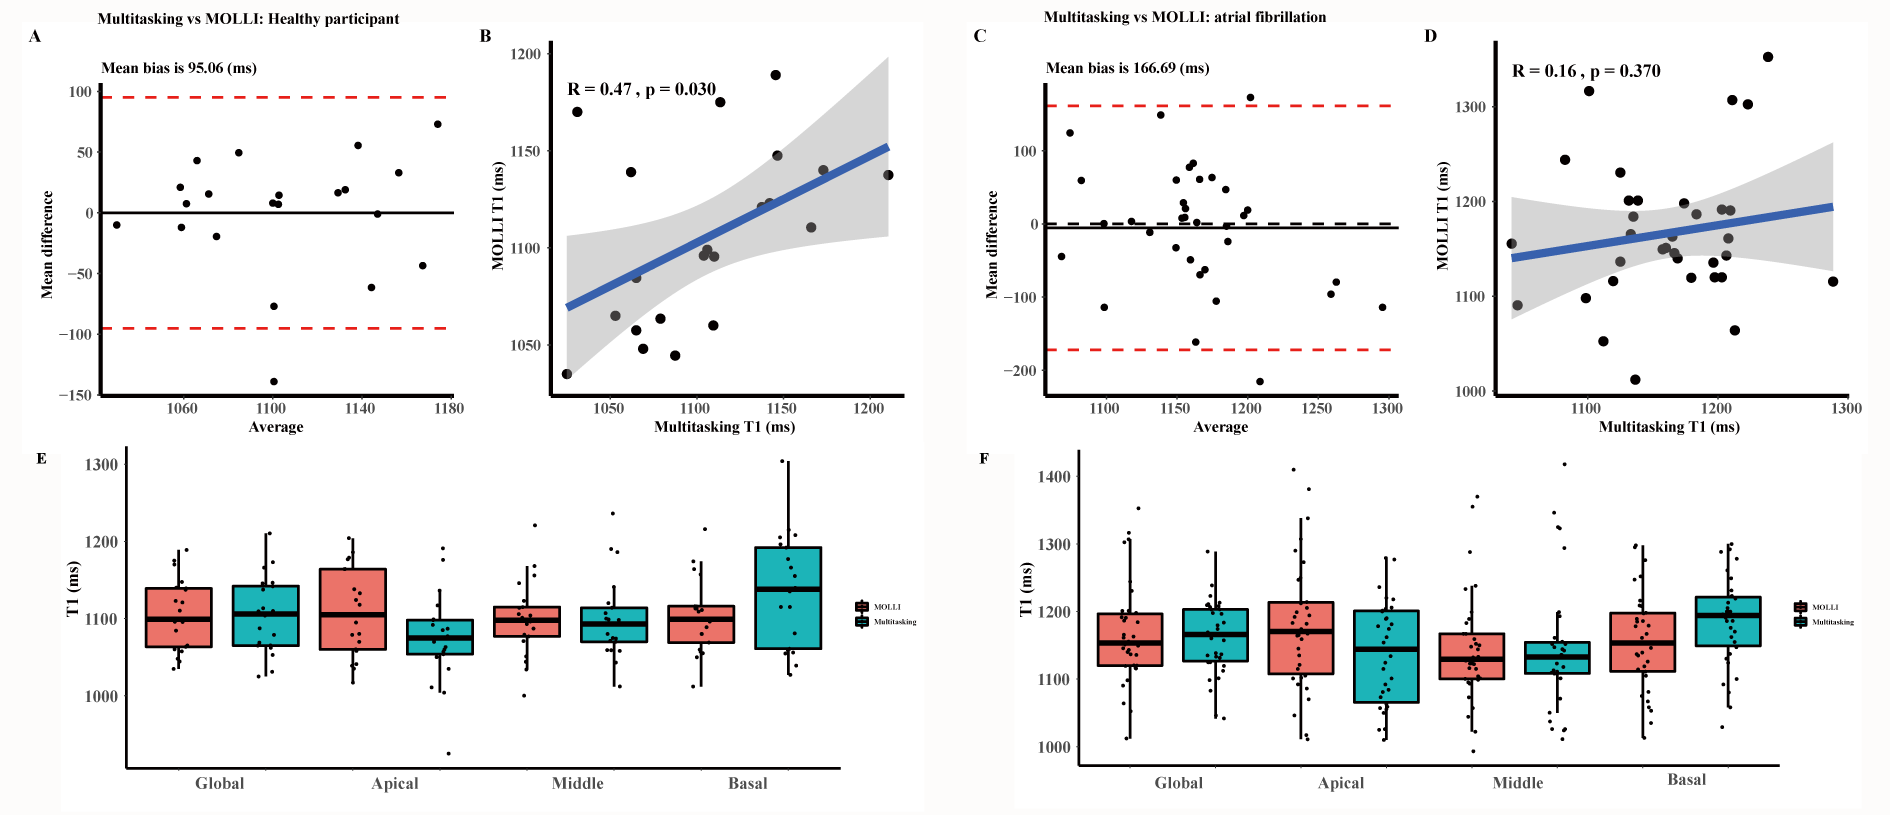
Comparison between multitasking and MOLLI are shown in Figure 2. Bland‐Altman analysis showed all but one subjects were within the 95% limits of agreement in healthy subjects, with the mean bias being 95.06 ms. Pearson correlation showed a moderate correlation (R=0.47, p=0.030). All but two subjects in AF were within the 95% limit, with the mean bias being 166.69 ms. There was non-significant correlation (R=0.16, p=0.370). Paired-t test of each segment demonstrated non-significant difference (p>0.05).
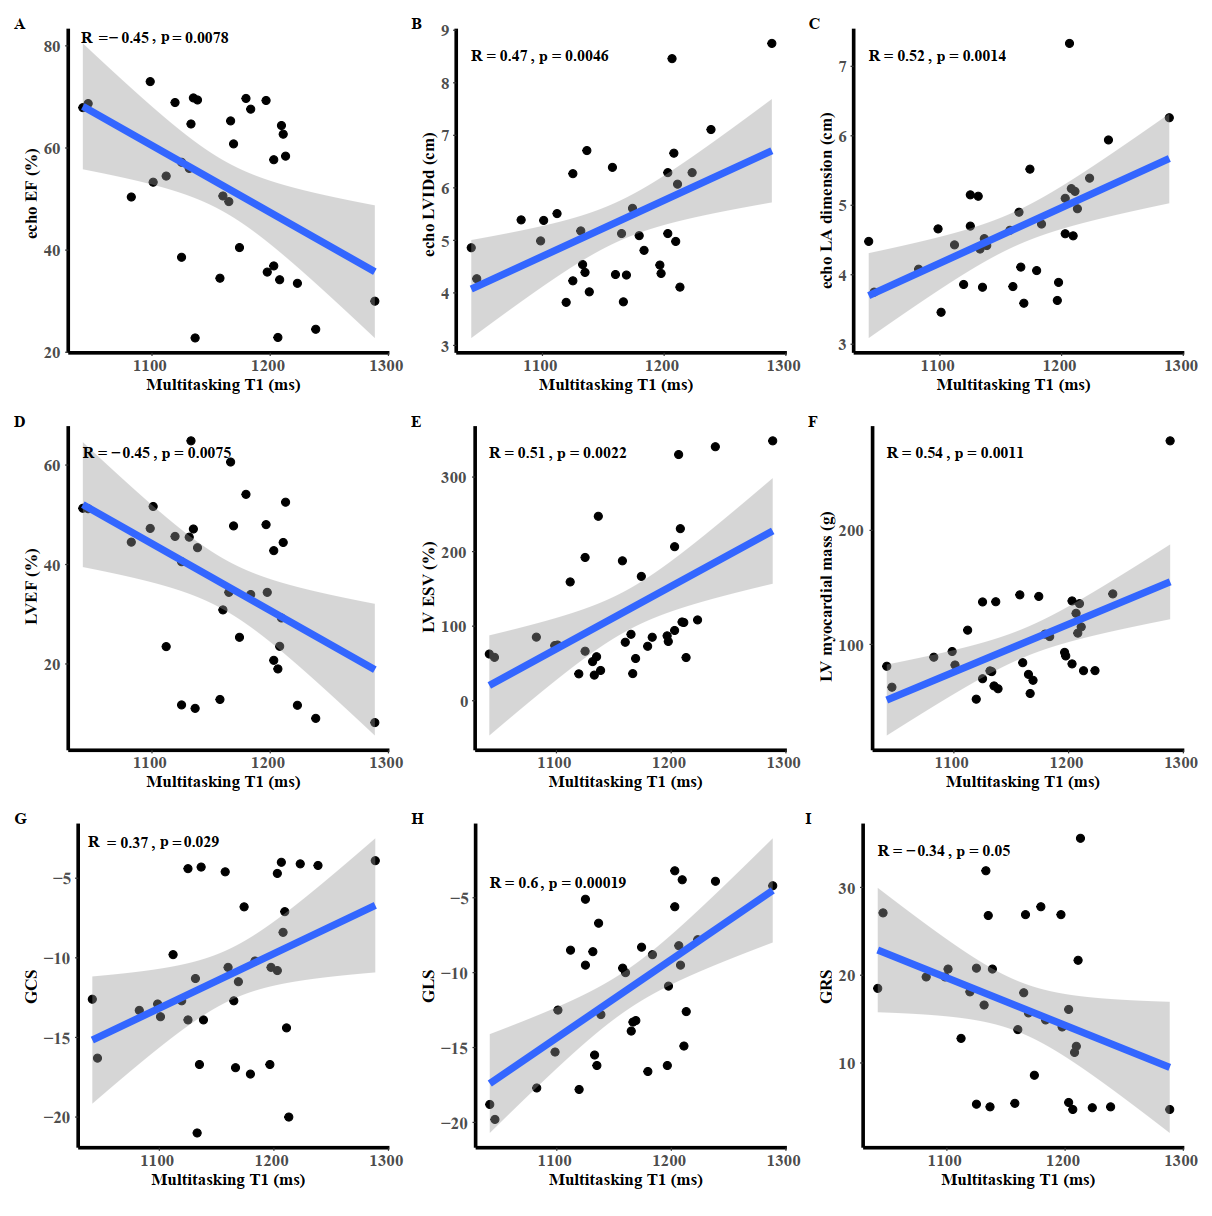
The correlations between select heart function biomarkers and multitasking T1 values are shown in Figure 3. Increased multitasking T1 values were associated with worsened heart failure.
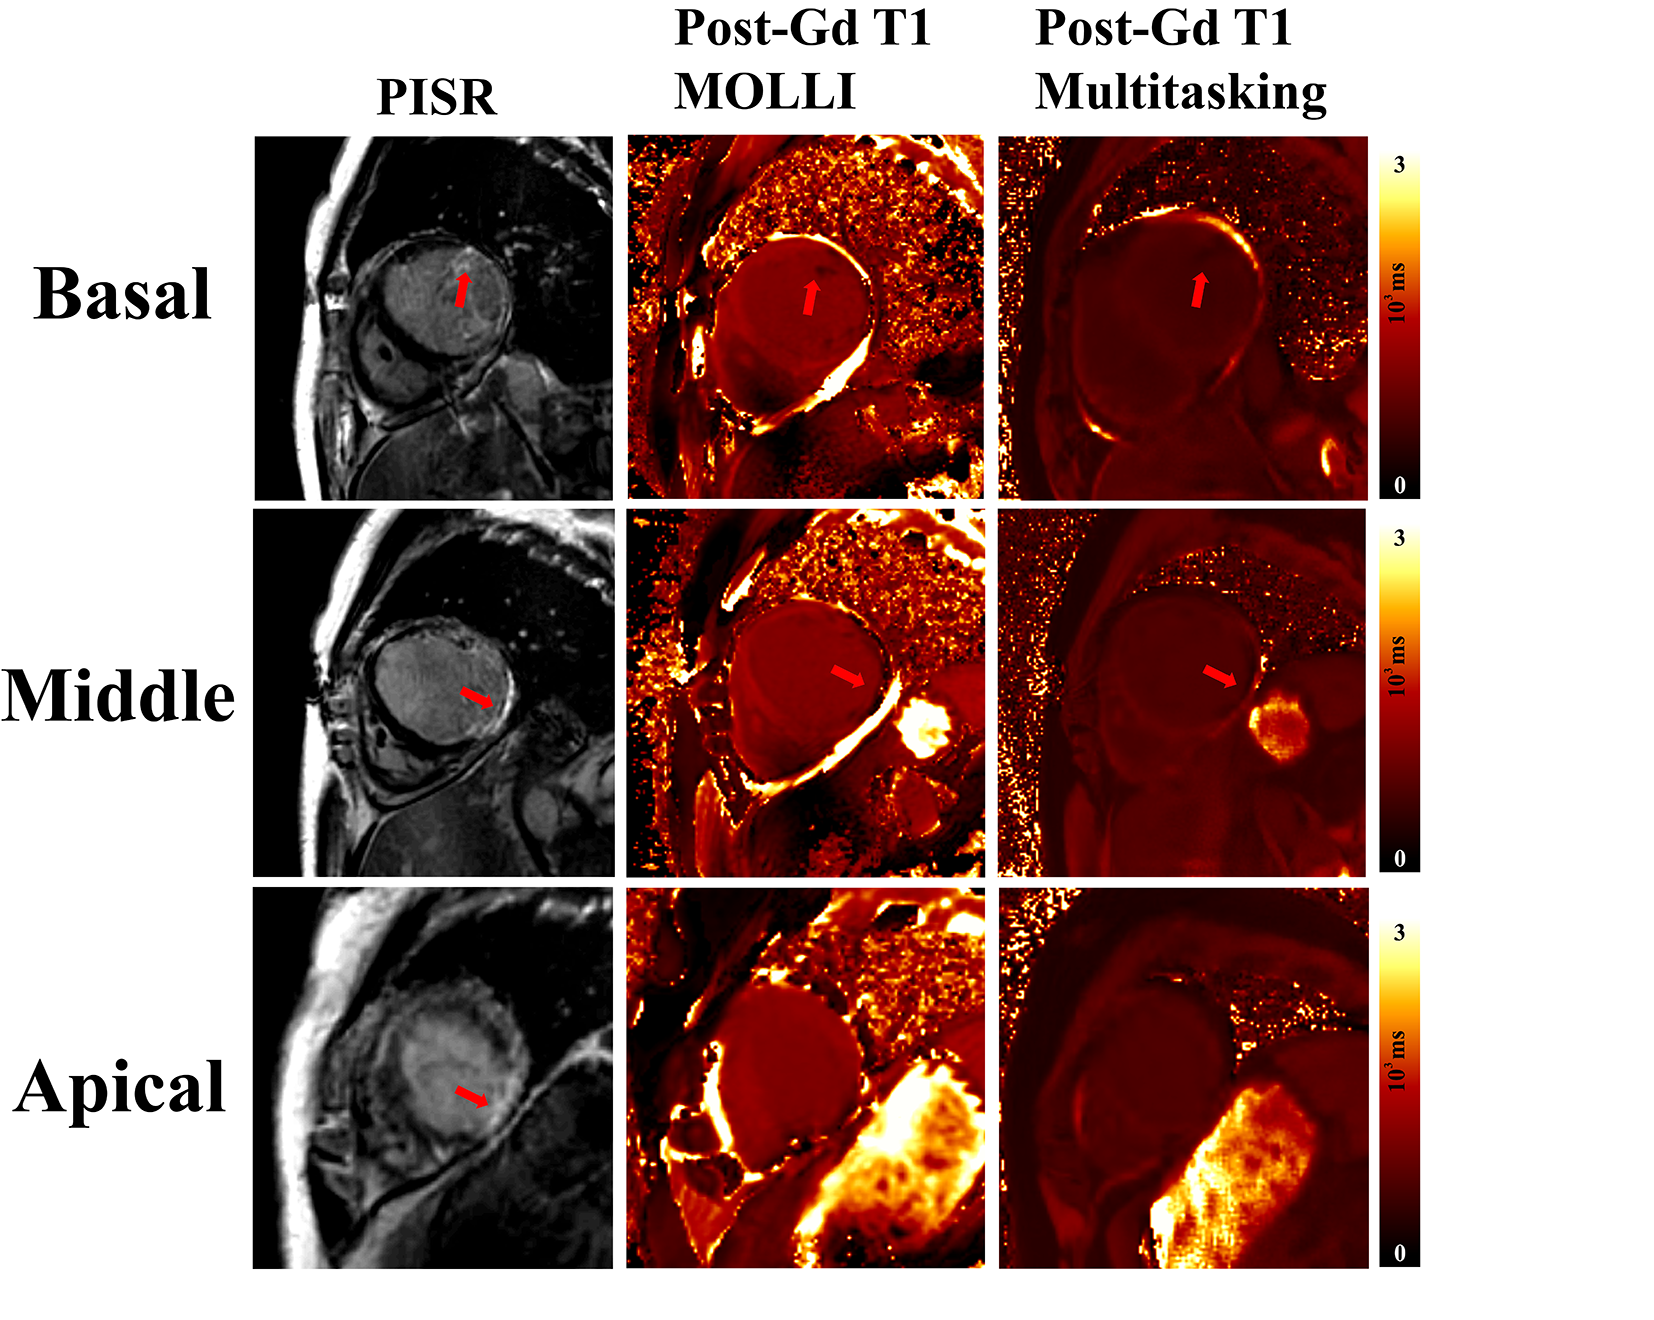
Among the AF patients received contrast agents, cardiac lesion of similar size and location was identified on multitasking, PSIR, and MOLLI images (Figure 4).
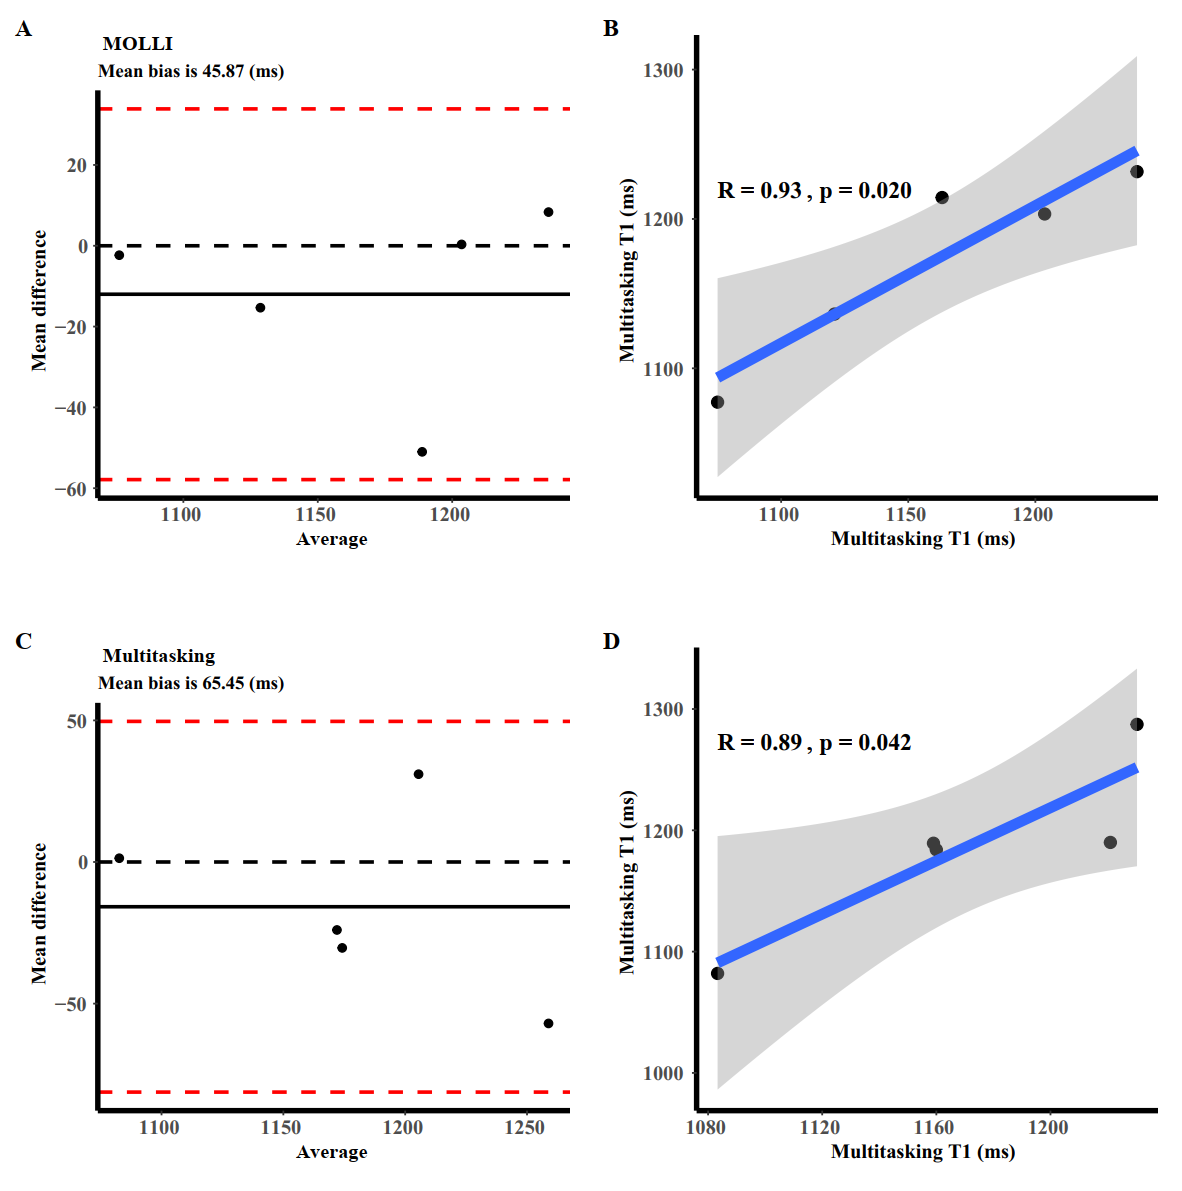
Intra-observer repeatability (Figure 5) had a good intraclass correlation coefficient (0.587 [0.587;0.837], p<0.001). It demonstrated a low mean bias (65.45 ms) and high correlation between scans (R=0.89, p=0.042), indicating good repeatability.
Conclusion and Discussion
This study investigated the use of MR multitasking T1 mapping in patients with AF. There was a significant native T1 value difference between AF participants and healthy participants. Elevated native T1 value in MR multitasking was associated with worsened cardiac function biomarkers. MR multitasking T1 mapping, a technique requires no ECG trigger or breath-hold, is promising for AF diagnosis.Several factors could complicate the analysis of our results. 1) MOLLI is known to underestimate myocardium T1 and thus create a bias. 2) As been shown, MOLLI in AF is susceptible to artifacts stemming from miss-triggering. This could explain the poor association between multitasking and MOLLI in AF patients. 3) MR multitasking T1 mapping is sensitive to B1+ field inhomogeneity. A recently developed dual flip-angle technique with spin history mapping is expected to alleviate this problem [9].
Acknowledgements
No acknowledgement found.References
[1] January, C.T., et al., 2019. AHA/ACC/HRS Focused Update of the 2014 AHA/ACC/HRS Guideline for the Management of Patients with Atrial Fibrillation: A Report of the American College of Cardiology/American Heart Association Task Force on Clinical Practice Guidelines and the Heart Rhythm Society in Collaboration With the Society of Thoracic Surgeons. Circulation, 2019. 140(2): p. e125-e151.
[2] Neilan, T.G., et al., The incidence, pattern, and prognostic value of left ventricular myocardial scar by late gadolinium enhancement in patients with atrial fibrillation. J Am Coll Cardiol, 2013. 62(23): p. 2205-14.
[3] Kato, S., et al., Left ventricular native T1 time and the risk of atrial fibrillation recurrence after pulmonary vein isolation in patients with paroxysmal atrial fibrillation. Int J Cardiol, 2016. 203: p. 848-54.
[4] Zhao, L., et al., Systolic MOLLI T1 mapping with heart-rate-dependent pulse sequence sampling scheme is feasible in patients with atrial fibrillation. J Cardiovasc Magn Reson, 2016. 18: p. 13.
[5] Zhao, L., et al., Cardiovascular magnetic resonance-determined left ventricular myocardium impairment is associated with C-reactive protein and ST2 in patients with paroxysmal atrial fibrillation. J Cardiovasc Magn Reson, 2021. 23(1): p. 30.
[6] Messroghli, D.R., et al., 2004. Modified Look-Locker inversion recovery (MOLLI) for high-resolution T1 mapping of the heart. Magnetic resonance in medicine, 52(1), 141–146.
[7] Shaw, J. L., et al, 2019. Free-breathing, non-ECG, continuous myocardial T1 mapping with cardiovascular magnetic resonance multitasking. Magnetic resonance in medicine, 81(4), 2450–2463.
[8] Keenan, K., et al., Comparison of T1 measurement using ISMRM/NIST system phantom. 2016, Proceedings of the International Society of Magnetic Resonance in Medicine, Singapore.
[9] Serry FM, Ma S, Mao X, et al. Dual flip-angle IR-FLASH with spin history mapping for B1+ corrected T1 mapping: Application to T1 cardiovascular magnetic resonance multitasking. Magn Reson Med. 2021;86(6):3182-3191.
Figures