4856
Left Atrial Hemodynamics Assessed with 2D Real Time Phase Contrast MRI are Associated with Prior Stroke History in AF Patients1Northwestern, Chicago, IL, United States
Synopsis
Keywords: Arrhythmia, Velocity & Flow
2D real time phase contrast was utilized in atrial fibrillation patients with and without a prior history of stroke. To account for within patient heartbeat variability, heartbeats were aggregated within each patient according to ECG trace. Heartbeat durations (RR-intervals) were sorted from fast to slow for each patient. Three groups were formed from the tertiles of the RR-intervals (faster, regular, and slower heartbeats). Blood stasis and peak velocity were compared between the stoke subgroups for each grouping. Patients with prior stroke had significantly higher stasis which remained significant in multivariable modeling using demographic variables as well.Introduction
Atrial fibrillation (AF) is the most common sustained cardiac arrhythmia. AF is associated with increased risk for ischemic stroke, which is thought to be a consequence of impaired atrial blood flow (reduced flow velocities, increased blood stasis).1,2 2D real time phase contrast (2DRTPC) allows for the beat-to-beat measurement of 2D through plane atrial blood flow. The hypothesis of this study was that AF patients having with a history of prior stroke will have impaired atrial hemodynamics measured with 2DRTPC compared to non-stroke AF patients.Methods
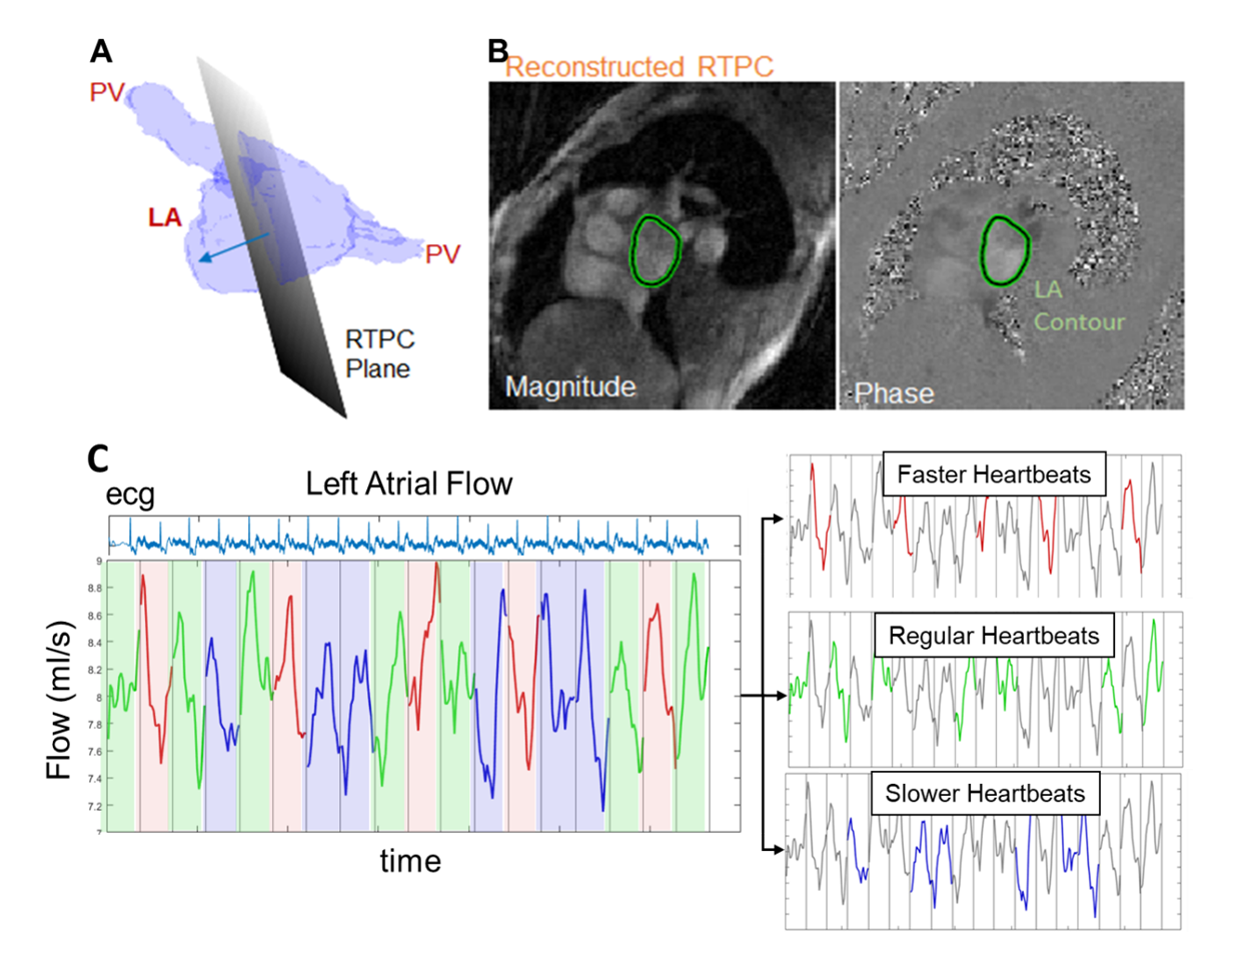
We prospectively enrolled 51 AF patients (68 ± 9 years, 31 males, 24 with prior stroke history) for cardiac MRI, including 2DRTPC. The 2DRTPC plane was placed in the mid LA parallel to the mitral valve (fig 1, A). 2DRTPC data were acquired during free breathing using a gradient-echo sequence employing radial k-space sampling with golden angles with the following acquisition parameters: venc = 60-70 cm/s, FOV = 288 mm x 288 mm, flip angle = 8°, spatial resolution=2.1 mm x 2.1mm, TE = 2.88 ms, TR = 4.25 ms, acceleration factor R = 28.0. Total acquisition time varied from 5-20 heartbeats. Undersampled k-space data were reconstructed offline using the GRAPPA operator gridding Golden-angle Radial Sparse Parallel (GROG-GRASP) method.3 Following pre-processing, the LA contour was segmented (fig 1, B) with an in-house deep learning network, followed with frame-by-frame manual editing of contours. 2D through plane LA peak velocity and blood stasis were calculated per heartbeat. LA peak velocity was calculated as the 95th percentile of velocities of the highest velocity timeframe within each cardiac cycle. Mean blood stasis was calculated as the average incidence of velocities less than a previously established threshold of 10/√3 cm/s across the cardiac cycle.4,5 To account for within patient heartbeat variability, heartbeats were aggregated within each patient according to ECG trace recorded by the scanner patient monitoring unit. Heartbeat durations (RR-intervals) were sorted from fast to slow for each patient. Three groups were formed from the tertiles of the RR-intervals (faster, regular, and slower heartbeats fig 1, C). The mean peak velocity and blood stasis were calculated for each of the 3 groups. Within patient differences of 2DRTPC parameters were assessed between varied heartbeat lengths. 2DRTPC parameters and demographic data were also used for multivariable analysis, using forward/backward stepwise general logistic regression to identify independent descriptors of stroke history status.Results
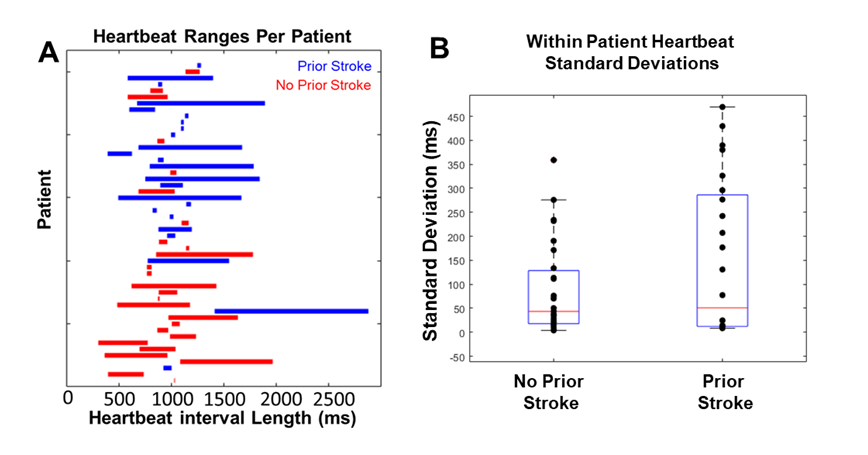
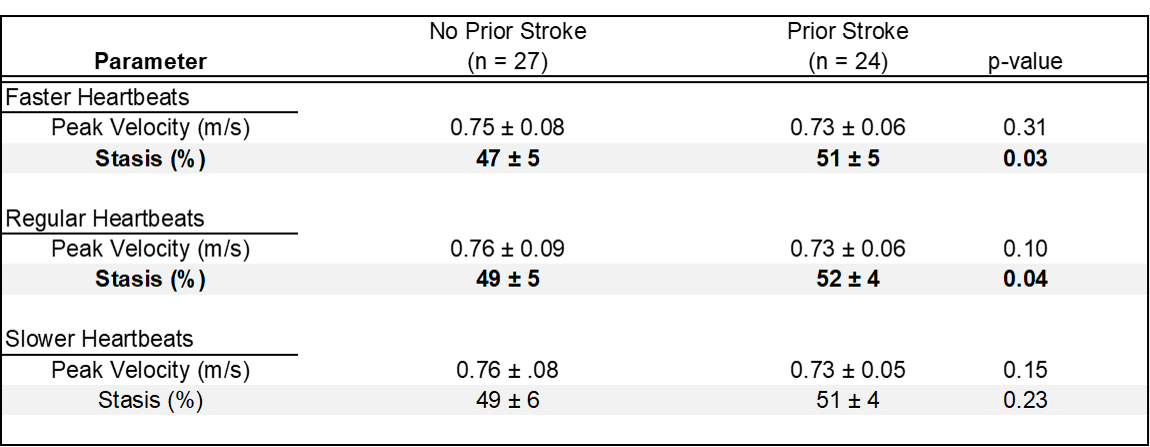
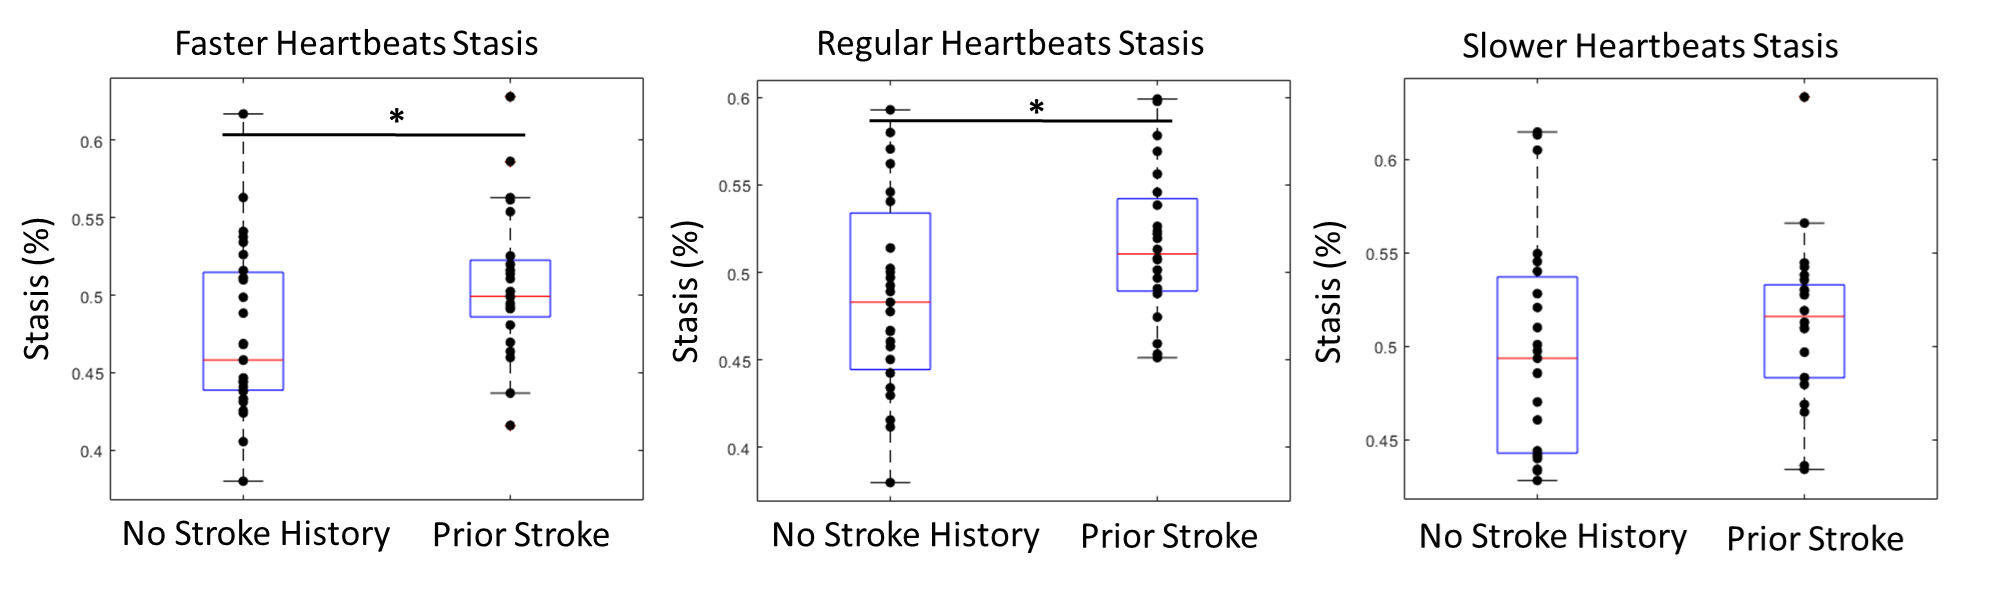
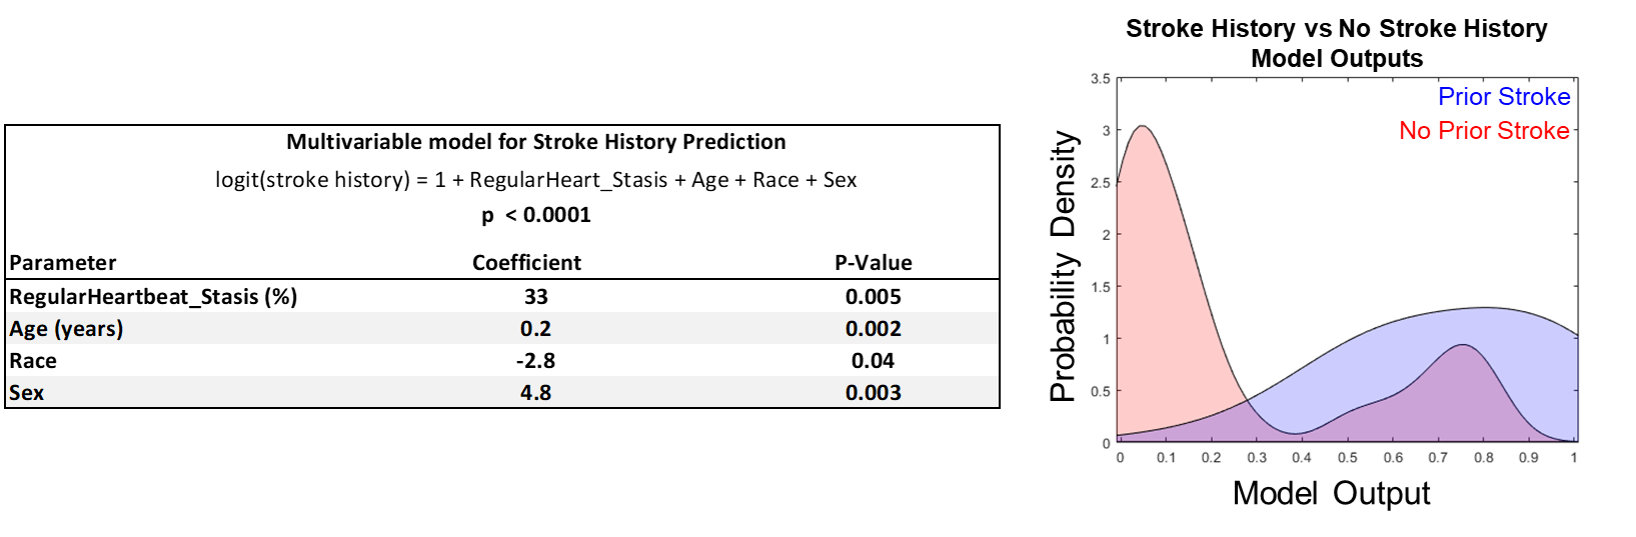
Heartbeat durations in prior stroke and no stroke history patients were not significantly different (mean RR-interval for prior stroke vs no stroke history: 979 ± 285 ms vs 983 ± 283 ms, p = 0.81). Further, RR-interval variance was not significantly different between groups (p = 0.88, fig 2). LA Stasis and peak velocity were not statistically different within each patient between fast, regular, and slow heartbeat groupings (lowest p = 0.10). LA stasis was significantly different between stroke history statuses for faster heartbeat (previous stroke 51 ± 5% vs no stroke history 47 ± 5%, p = 0.03, Table 1, fig 3) and regular heartbeat grouping (previous stroke 52 ± 4% vs no stroke history 49 ± 5%, p = 0.04). Peak velocity and stasis for slow heartbeats were not significantly different (p > 0.10). Regular heart beat derived stasis was a significant contributor to the multivariable model predicting stroke history, alongside age, sex and race (McFadden’s pseudo r-squared value of 0.46, fig 4).Discussion
This project utilized 2DRTPC to detect potential changes in LA velocities and stasis due to heart rate variability and how this translated into differences between the stroke history subgroups. For shorter heartbeats, atrial contraction (if any) may be reduced, and for longer heartbeats, diastolic time is increased. We speculate that these conditions may be mechanisms that contributed to the observed changes in blood flow compared to regular heartbeat durations. Stasis and peak velocity were not significantly different within each patient across the heartbeat duration groupings; however, such grouping may only be necessary for higher heart rate variability patients. While heartbeat durations were not statistically different between stroke status groupings, some patients experienced higher degrees of heart rate variability (fig 2A,B). Heartbeat duration, itself —not just deviation from "regular" heartbeats - may be an important factor for understanding atrial stasis and peak velocity in this population. However, no 300 ms wide window grouping (e.g., find heartbeats in every patient between 900-1100 ms) could capture every patient (fig 2A). As a univariate discriminator, stasis was significantly different between stroke history status in shorter and regular heartbeats. Prior stroke patients tended to have increased stasis, which may promote thrombus formation. While this trend continued into the slower heartbeat grouping, it was not significant. But, any missed ECG triggers would create artificially long heartbeat durations and fall into the slower heartbeat grouping, thus absorbing all noise due to this. Stasis was also a significant contributor to the multivariable model, suggesting blood flow parameters could provide additional information not contained within age, race, or sex in the context of stroke. Further modeling efforts should utilize heartbeat duration information as well.Conclusion
Left atrial hemodynamics measured with 2DRTPC were able to distinguish between AF patients with prior stroke and no stroke history.Acknowledgements
No acknowledgement found.References
1. Zabalgoitia M, Halperin JL, Pearce LA, et al. Transesophageal Echocardiographic Correlates of Clinical Risk of Thromboembolism in Nonvalvular Atrial Fibrillation. J Am Coll Cardiol. 1998;31(7):1622-1626. doi:10.1016/S0735-1097(98)00146-6
2. Lowe GDO. Virchow’s Triad Revisited: Abnormal Flow. Pathophysiol Haemost Thromb. 2003;33(5-6):455-457. doi:10.1159/000083845
3. Haji‐Valizadeh H, Feng L, Ma LE, et al. Highly accelerated, real‐time phase‐contrast MRI using radial k ‐space sampling and GROG‐GRASP reconstruction: a feasibility study in pediatric patients with congenital heart disease. NMR Biomed. 2020;33(5):e4240. doi:10.1002/nbm.4240
4. Markl M, Lee DC, Ng J, Carr M, Carr J, Goldberger JJ. Left Atrial 4-Dimensional Flow Magnetic Resonance Imaging: Stasis and Velocity Mapping in Patients With Atrial Fibrillation. Invest Radiol. 2016;51(3):147-154. doi:10.1097/RLI.0000000000000219
5. Markl M, Lee DC, Furiasse N, et al. Left Atrial and Left Atrial Appendage 4D Blood Flow Dynamics in Atrial Fibrillation. Circ Cardiovasc Imaging. 2016;9(9):e004984. doi:10.1161/CIRCIMAGING.116.004984
Figures