4853
The relationship of epicardial adipose tissue thickness with arrhythmias in patients with hypertension: a 3.0 T cardiac magnetic resonance study
Zhaoxia Yang1, Dazong Tang1, Yi Luo2, Chunlin Xiang1, Lu Huang1, and Liming Xia1
1Tongji Hospital,Huazhong University of Science and Technology, wuhan, China, 2Tongji Hospital,Huazhong University of Science and Technology, Wuhan, China
1Tongji Hospital,Huazhong University of Science and Technology, wuhan, China, 2Tongji Hospital,Huazhong University of Science and Technology, Wuhan, China
Synopsis
Keywords: Heart, Hypertension, epicardial adipose tissue
Cardiac MRI enables quantification of EAT thickness with good to excellent reproducibility for differentiating the hypertensive patients with arrhythmias from those without arrhythmias and normal controls. Additionally, EAT thickness was correlated with native T1 and LVMi, which demonstrated EAT might induce cardiac remodeling and promote myocardial fibrosis. Cardiac MRI-derived EAT thickness metrics has great potential to further explore the mechanism of EAT with arrhythmias and guide an appropriate treatment in patients of hypertension.Purpose
Hypertension is one of the most common risk factors for cardiovascular diseases 1 . Clinically, obesity commonly coexists with hypertension and may confer an increased risk of arrhythmias 2-4. Epicardial adipose tissue (EAT) is a metabolically active organ that secretes various bioactive molecules, closely associated with cardiac function and remodeling 5,6. However, little is known about the impact of arrhythmias on the excessive deposition of EAT in patients with hypertension. The aim of the study was to investigate the relationship between EAT thickness and arrhythmias in hypertensive patients.Methods and materials
54 hypertensive patients with arrhythmias (HTN [arrhythmias+]), 79 hypertensive patients without arrhythmias (HTN [arrhythmias-]), and 39 normal controls were retrospectively enrolled and underwent standard cardiac magnetic resonance imaging (MRI) examinations. EAT thickness was measured on basal short-axis and four-chamber long-axis cine images. Functional, morphological, tissue characteristic, and myocardial deformation parameters of cardiac MRI were analyzed using commercial software CVI42. One-way analysis of variance with Bonferroni’s post hoc test or Kruskal‑Wallis test, Pearson or Spearman analysis, receiver operating characteristic curve, and intra-class correlation coefficient analysis were performed.Results
All hypertensive patients had impaired left ventricular (LV) and left atrial (LA) myocardial deformation, and HTN (arrhythmias+) patients displayed higher LV mass index (LVMi), native T1, LA volume index, and increased EAT thickness than HTN (arrhythmias-) patients and normotensive controls. The presence of LV late gadolinium enhancement (LGE) was higher in hypertensive patients with arrhythmias than in those without arrhythmias (all P< 0.05). EAT thickness metrics significantly correlated with age, systolic blood pressure, body mass index, triglycerides and high-density lipoprotein levels, LVMi and native T1 (all P < 0.05). EAT thickness parameters were able to differentiate hypertensive patients with arrhythmias from those without arrhythmias and normal controls, and right ventricular free wall had the highest diagnostic performance (HTN (arrhythmias+) group vs HTN (arrhythmias-) group, AUC = 0.763, cut-off value = 4.4mm, sensitivity = 69.81%, specificity = 72.15%; HTN (arrhythmias+) group vs control group, AUC = 0.904, cut-off value =3.9mm, sensitivity = 88.68%, specificity = 82.05%). Intra-observer and inter-observer reliability of EAT thickness metrics were good to excellent (ICC: 0.934 ~ 0.9760, 0.880 ~0.948, respectively).Conclusion
Cardiac MRI-derived LV myocardial native T1, LA volume and EAT thickness parameters were significantly increased in hypertensive patients with arrhythmias. EAT thickness metrics with good to excellent reproducibility, could be a useful imaging marker for differentiating hypertensive patients with arrhythmias, which might be a potential target for the prevention of cardiac remodeling and arrhythmias in patients with hypertension.Acknowledgements
This work was supported by a grant from the National Natural Science Foundation of China (No. 81873889).References
- Fuchs FD, Whelton PK. High Blood Pressure and Cardiovascular Disease. Hypertension 2020;75(2):285-292.
- Afzal MR, Savona S, Mohamed O, Mohamed-Osman A, Kalbfleisch SJ. Hypertension and Arrhythmias. Heart Fail Clin 2019;15(4):543-550.
- Samanta R, Pouliopoulos J, Thiagalingam A, Kovoor P. Role of adipose tissue in the pathogenesis of cardiac arrhythmias. Heart Rhythm 2016;13(1):311-320.
- Hall JE, do Carmo JM, da Silva AA, Wang Z, Hall ME. Obesity, kidney dysfunction and hypertension: mechanistic links. Nat Rev Nephrol 2019;15(6):367-385.
- Ng ACT, Strudwick M, van der Geest RJ, et al. Impact of Epicardial Adipose Tissue, Left Ventricular Myocardial Fat Content, and Interstitial Fibrosis on Myocardial Contractile Function. Circ Cardiovasc Imaging 2018;11(8):e007372.
- Bakkum MJ, Danad I, Romijn MA, et al. The impact of obesity on the relationship between epicardial adipose tissue, left ventricular mass and coronary microvascular function. Eur J Nucl Med Mol Imaging 2015;42(10):1562-1573.
Figures
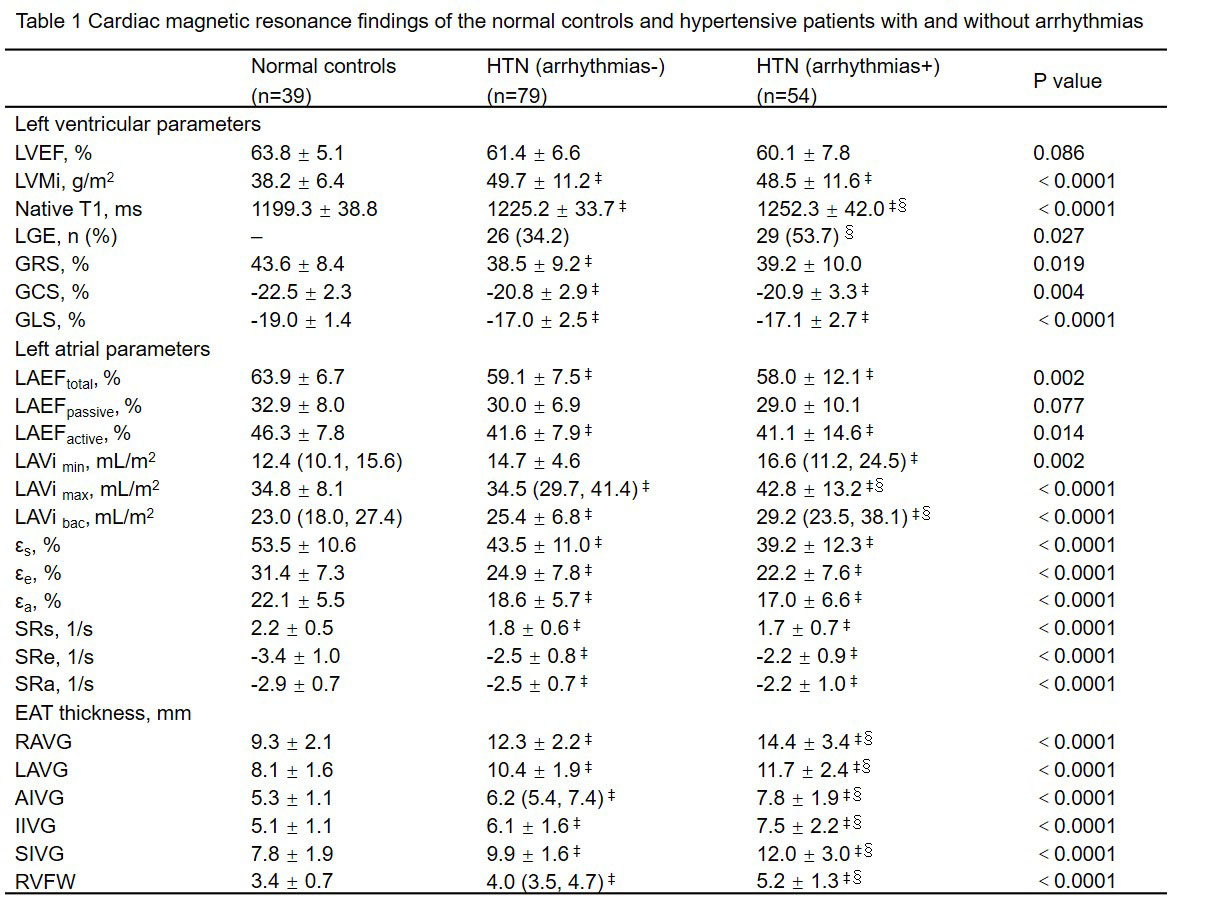
All values were
presented as mean ± SD or n (%) or median (interquartile range, IQR). ‡ p<0.05 vs contros, § p<0.05 vs HTN (arrhythmias-) group. LVEF: left ventricular ejection fraction; LVMi: left ventricular mass index; GRS, GCS, GLS: global radial, circumferential, longitudinal strain; LA: left atrial; εs, εe, εa: reservoir, passive, active strain; SRs, SRe, SRa: reservoir, passive, active strain rate; RAVG, LAVG: right and left atrioventricular groove; AIVG, IIVG, SIVG: anterior, inferior, superior interventricular groove; RVFW: right ventricular free wall.
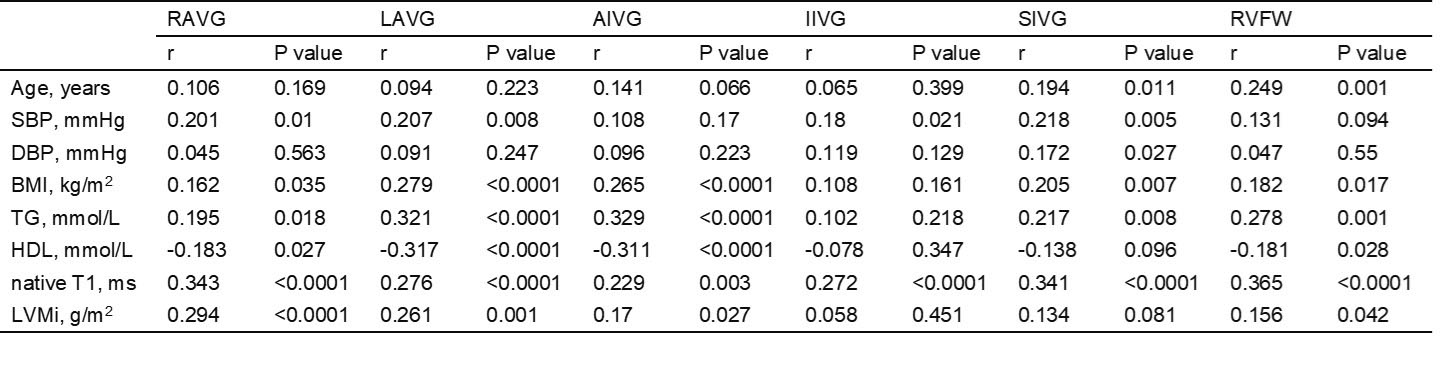
Table 2 Correlations of EAT thickness with clinical baseline variables and LV remodeling parameters in all participants. SBP: systolic blood pressure; DBP: diastolic blood pressure; BMI: body mass index; TG: triglycerides; HDL: high-density lipoprotein; LVMi: left ventricular mass index; RAVG: right atrioventricular groove; LAVG: left atrioventricular groove; AIVG: anterior interventricular groove; IIVG: inferior interventricular groove; SIVG: superior interventricular groove; RVFW: right ventricular free wall.
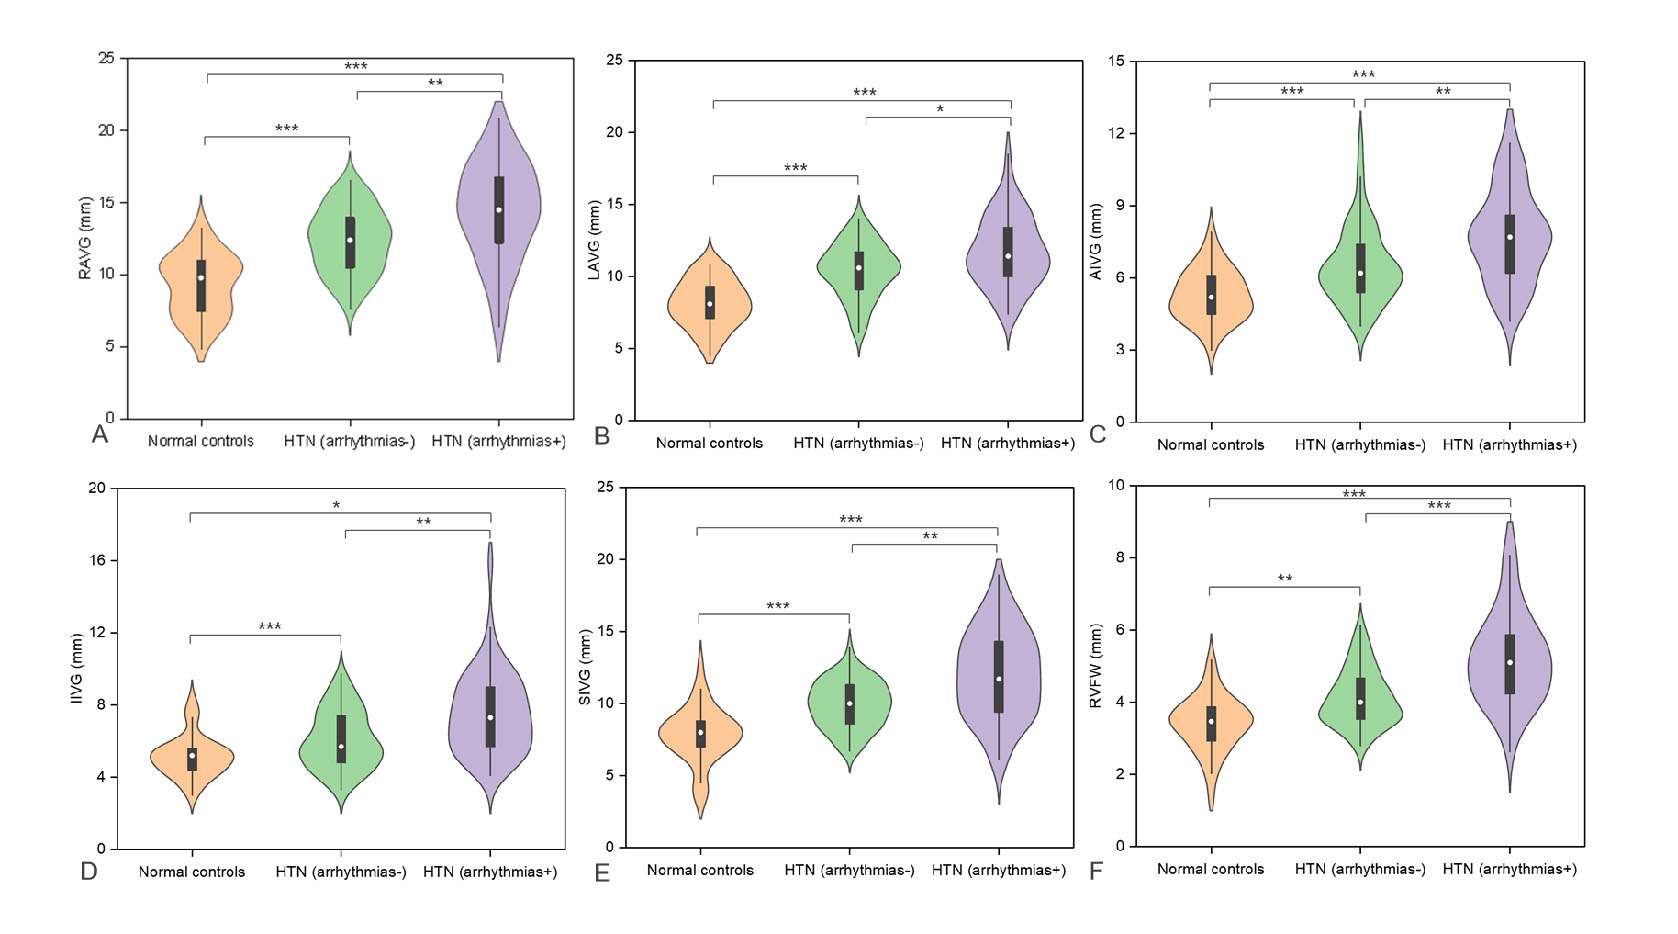
Figure 1 Comparison of
epicardial adipose tissue thickness metrics among normal controls, hypertensive
patients with and without arrhythmias. RAVG: right atrioventricular groove;
LAVG: left atrioventricular groove; AIVG: anterior interventricular groove;
IIVG: inferior interventricular groove; SIVG: superior interventricular groove;
RVFW: right ventricular free wall. * p < 0.05,**
p < 0.01,*** p <
0.001.
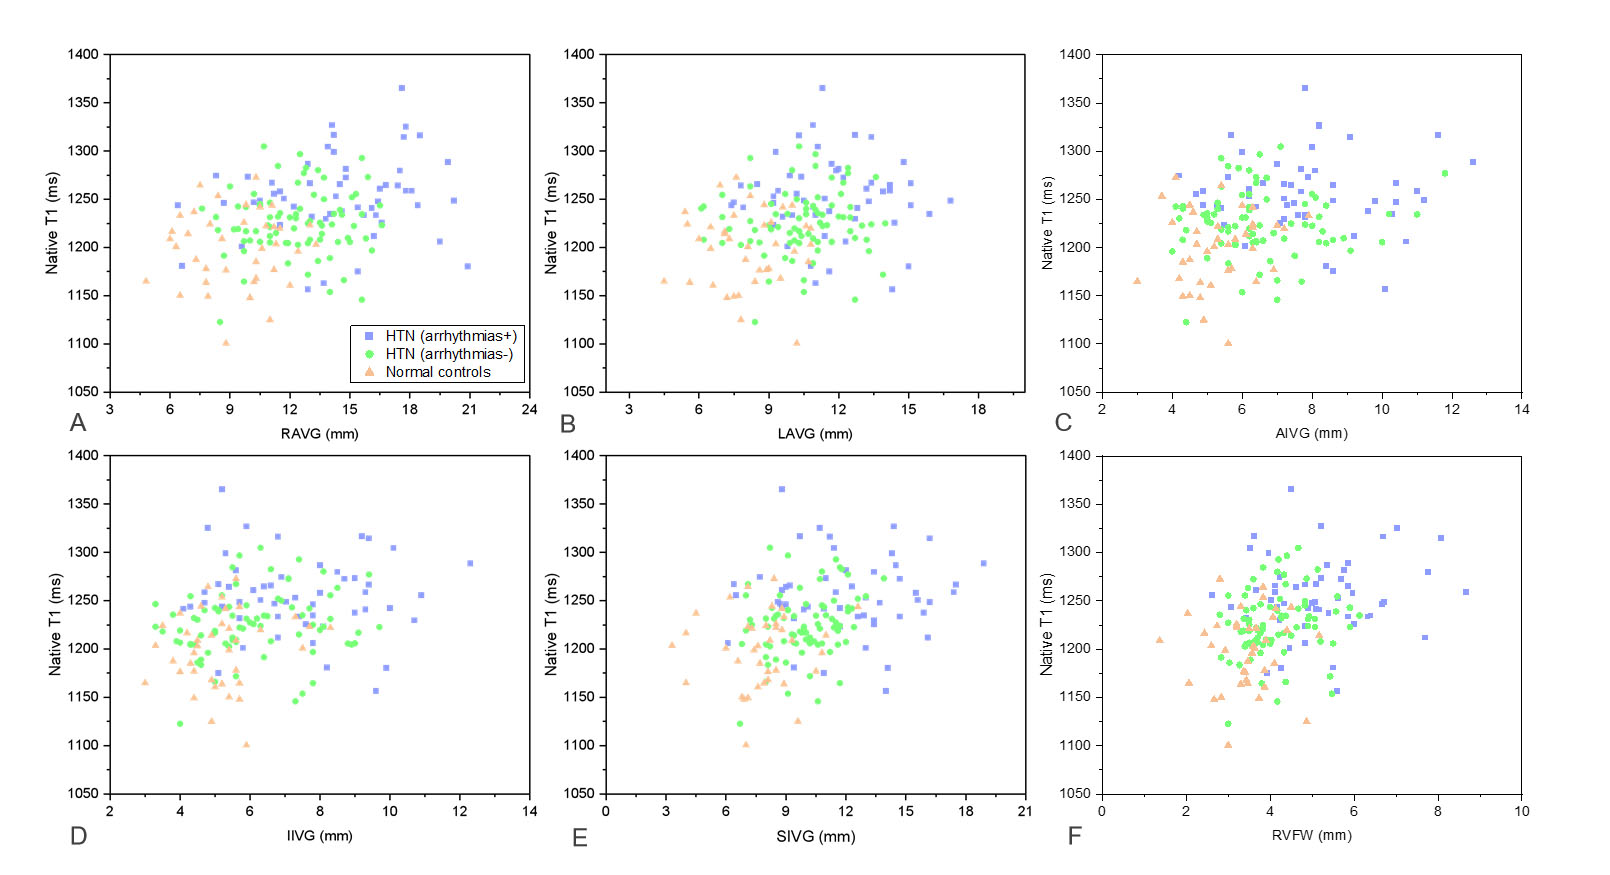
Figure 2 Correlations
between epicardial adipose tissue parameters and left ventricular myocardial native T1 in all participants.
RAVG: right atrioventricular groove; LAVG: left atrioventricular groove; AIVG:
anterior interventricular groove; IIVG: inferior interventricular groove; SIVG:
superior interventricular groove; RVFW: right ventricular free wall.
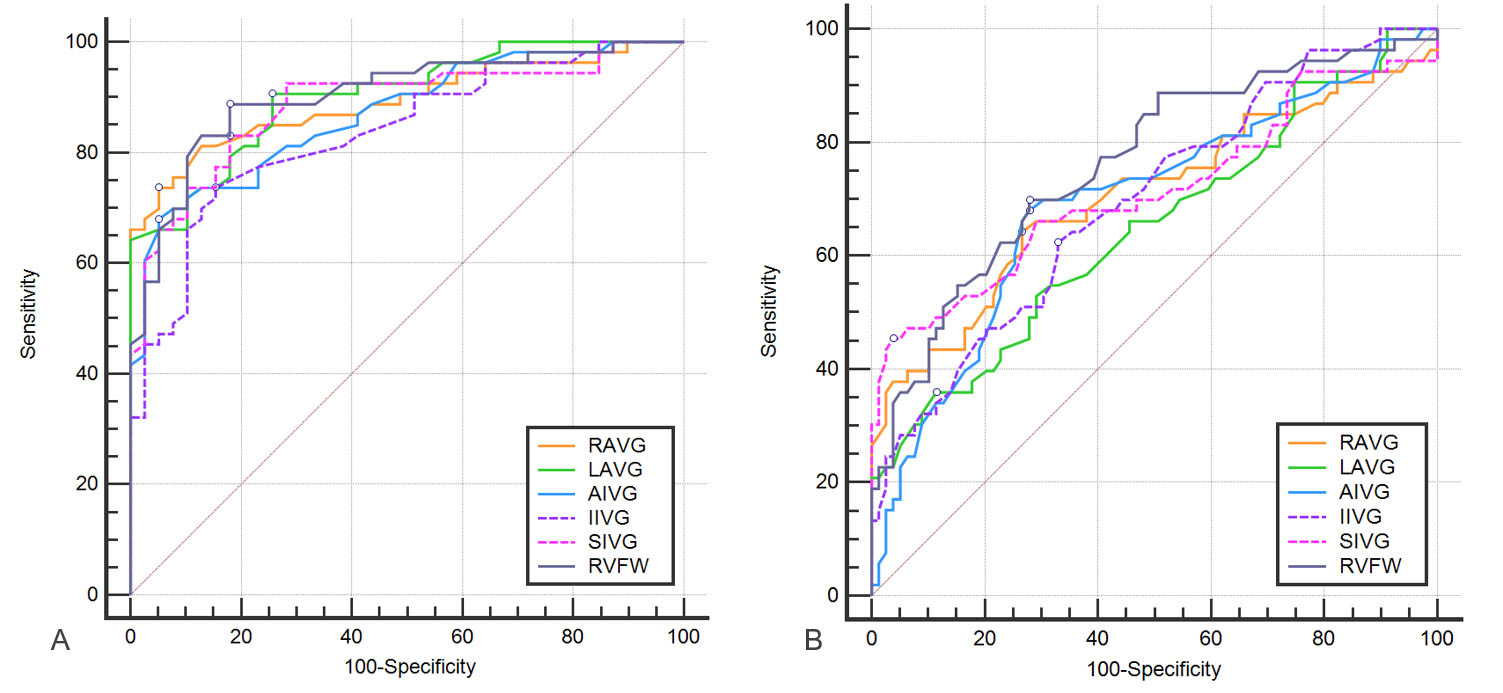
Figure 3 ROC curve
analysis of epicardial adipose tissue thickness metrics for differentiating HTN (arrhythmias+) group from normal
controls (A) and HTN
(arrhythmias-) group (B). HTN: hypertension; ROC, receiver operating
characteristic; RAVG: right atrioventricular groove; LAVG: left
atrioventricular groove; AIVG: anterior interventricular groove; IIVG: inferior
interventricular groove; SIVG: superior interventricular groove; RVFW: right
ventricular free wall.
DOI: https://doi.org/10.58530/2023/4853