4850
Improved self-navigation of respiratory motion in XD-GRASP reconstruction using exploratory factor analysis on 3D late gadolinium enhancement1Department of Radiology, Northwestern University Feinberg School of Medicine, Chicago, IL, United States, 2Department of Biomedical Engineering, Northwestern University, Evanston, IL, United States, 3Department of Medicine, Division of Cardiology, Northwestern University Feinberg School of Medicine, Chicago, IL, United States
Synopsis
Keywords: Arrhythmia, Image Reconstruction
Signal processing of self-navigation in 3D late gadolinium enhancement (LGE) with XD-GRASP reconstruction often leads to variable results due to a variety of factors including arrhythmia (variations in inversion-recovery of self-navigated signal) and bright signals around the body that are projected onto the edge profile used for tracking respiratory motion. Principal component analysis (PCA) is the conventional approach to process navigation signal. We hypothesize that exploratory factor analysis (EFA) produces better extraction of respiratory motion. Our results show that EFA improves respiratory motion tracking in 3D LA LGE obtained b-SSFP readout, but not in gradient echo [GRE] readout.Introduction
Left atrial (LA) fibrosis can be quantified from 3D late gadolinium enhancement (LGE) images. We had recently developed a self-navigated 3D LA LGE pulse sequence using XD-GRASP1 reconstruction2. In our 3D LGE using XD-GRASP, a 1D self-navigation k-space line is acquired along the superior inferior (SI) direction once per heartbeat to capture the respiratory motion. In conventional XD-GRASP, the PCA (principal component analysis), which assumes correlated variables and no unique variance, is performed to extract the respiratory motion from 1D projection of self-navigated signal. In this study, in order to improve the respiratory motion extraction, we applied exploratory factory analysis (EFA) instead of PCA, which does not require prior knowledge about the relationship between variables3. We sought to compare the performance between PCA (i.e., variance) and EFA (i.e., covariance) on extracting respiratory motion from 3D LA LGE raw k-space obtained using two different readouts (balanced steady free precession [b-SSFP] and gradient echo [GRE]).Methods
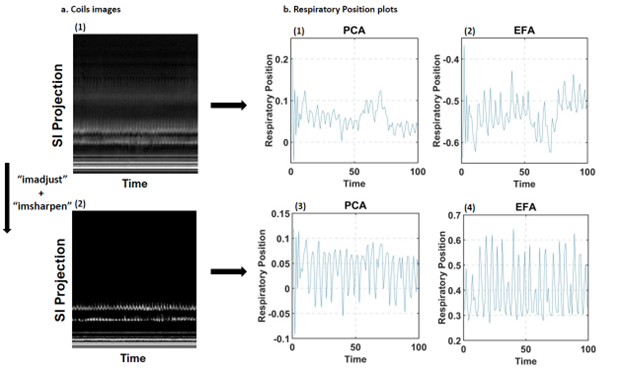
This is a retrospective study using existing stack-of-stars raw k-space of 27 patients (6 females; mean age=62.88 ± 11.01 yrs.) with atrial fibrillation;17 patients were scanned using b-SSFP; 10 patients were scanned using GRE. For details on imaging parameters, please see reference2. XD-GRASP reconstruction was performed on a GPU (2 x 32GB Tesla V100) workstation using MATLAB.Initial Pre-Processing of Navigation Signal: As shown in Figure 1, to enhance the edge profiles of 1D SI projection signal, we performed contrast adjusting (‘imadjust’) for each coil image, then we sharpened the image using the unsharp masking method in MATLAB (‘imsharpen’).
PCA vs. Promax4: We then performed an oblique rotation (Promax) on the fully stacked coils SI-projection data, and conventional PCA as a reference. We computed the blur metric (0 [best] to 1 [worst])5 on a cropped image encapsulating the heart region only to compare PCA and Promax.
Statistical Analysis: The variable normality was tested using the Shapiro-Wilk test. Appropriate statistical tests were used to compare groups.
Results
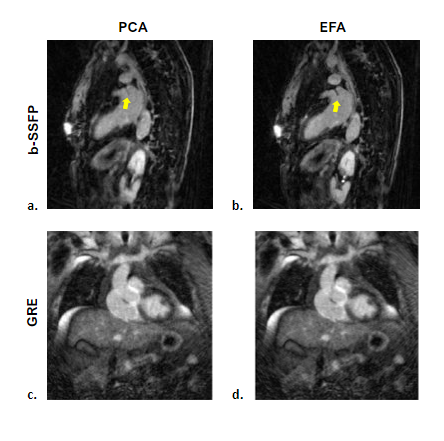
3D LA LGE with b-SSFP readout resultsMotion correction: As shown in Figure 1, a combination of image contrast adjustment, sharpening, and EFA produced the best respiratory signal extraction compared with other combinations. As shown in Figure 2a.b., EFA with preprocessing produced better results than PCA (see both raw images).
Blur Metric: According to the Shapiro-Wilk test, the blur metric is normally distributed. The mean blur metric was significantly (p<0.001) better for EFA (0.38 ± 0.04) than PCA (0.41 ± 0.05), where the relative difference was 7%.
3D LGE with GRE readout results
As shown in Figure 2c.d, EFA did not improve motion tracking compared with PCA for LGE data obtained with GRE readout.
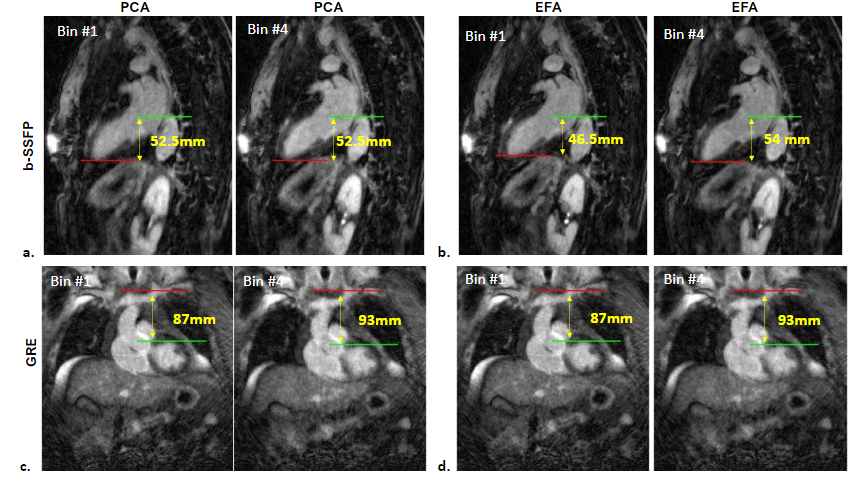
Motion correction: As shown in Figure 3c.d, no respiratory motion change was noticed in most of the data sets, the EFA method showed a minor improvement in motion in few cases but in general the effect is not noticeable.
Blur Metric: According to the Shapiro-Wilk test, the blur metric is not normally distributed. The median blur metric was not significantly different (p>0.05) for EFA (0.36 [0.06]) and PCA (0.37 [0.04]), where the relative difference was only 0.19%.
Conslusion
This study shows that EFA extracts better self-navigation signal than PCA for XD-GRASP reconstruction of 3D LA LGE using b-SSFP readout, but not for GRE readout. Future study includes comparison of repeatability of LA fibrosis quantification between PCA and EFA self-navigation signal extraction. Another future study includes comparing PCA and EFA on other types of XD-GRASP data.Acknowledgements
This work was supported in part by the following grants: National Institutes of Health (R01HL116895, R21AG055954, R01HL151079, R21EB030806A1) and American Heart Association (19IPLOI34760317, 949899).
References
1. Feng L, Axel L, Chandarana H, Block KT, Sodickson DK, Otazo R. XD-GRASP: Golden-angle radial MRI with reconstruction of extra motion-state dimensions using compressed sensing. Magn Reson Med. 2016 Feb;75(2):775-88. doi: 10.1002/mrm.25665. Epub 2015 Mar 25. PMID: 25809847; PMCID: PMC4583338.
2. Gunasekaran S, Haji-Valizadeh H, Lee DC, Avery RJ, Wilson BD, Ibrahim M, Markl M, Passman RS, Kholmovski EG, Kim D. Accelerated 3D Left Atrial Late Gadolinium Enhancement in Patients with Atrial Fibrillation at 1.5 T: Technical Development. Radiol Cardiothorac Imaging. 2020 Oct 15;2(5):e200134. doi: 10.1148/ryct.2020200134. PMID: 33154994; PMCID: PMC7605361.
3. Brown, J. D. (2009a). Statistics Corner. Questions and answers about language testing statistics: Principal components analysis and exploratory factor analysis—Definitions, differences, and choices. Shiken: JALT Testing & Evaluation SIG Newsletter, 13(1), 26-30. Also retrieved from the World Wide Web at http://jalt.org/test/bro_29.htm
4. https://www.mathworks.com/help/stats/rotatefactors.html
5. Crete, Frederique, et al. "The blur effect: perception and estimation with a new no-reference perceptual blur metric." Human vision and electronic imaging XII. Vol. 6492. SPIE, 2007.Figures