4849
T1rho was used to monitor myocardial changes in patients with CAD
Yanbing Yang1, Xiuzheng YUE2, Fang Wang3, and Yishi Wang2
1People's Hospital of Ningxia Hui Autonomous Region, yinchuan, China, 2Philips Healthcare, beijing, China, 3People's Hospital of Ningxia Hui Autonomous Region, yinchaung, China
1People's Hospital of Ningxia Hui Autonomous Region, yinchuan, China, 2Philips Healthcare, beijing, China, 3People's Hospital of Ningxia Hui Autonomous Region, yinchaung, China
Synopsis
Keywords: Cardiomyopathy, Cardiomyopathy
The current reference standard for detection of myocardial scar tissue is late gadolinium enhancement(LGE). Cardiac magnetic resonance T 1 mapping is a technique that enables quantification of extracellular volume fraction (ECV). Calculating ECV mapping need to inject gadolinium contrast agent, which may be contraindicated in some patients. For those patients, T1rho contrast may help them find the changes in myocardial because T1rho MRI has been used to detect early myocardial infraction in swine model. In this study, we used T1rho to assess myocardial changes in patients with early CHD with a view to finding Grey zone of LGE positive patients.Introduction
The current reference standard for detecting myocardial scar tissue is late gadolinium enhancement (LGE). It is a validated method with a high sensitivity to discriminate infracted from healthy myocardium. Cardiac magnetic resonance (CMR) T1 mapping is a technique that enables the quantification of extracellular volume fraction (ECV). However, calculating ECV mapping needs to inject gadolinium contrast agents, which may be contraindicated in some patients. For those patients, T1rho contrast may help them find the changes in myocardial because T1rho MRI has been used to detect early myocardial infarction in swine model. T1rho relaxation time is sensitive to changes in macromolecular. In this study, we used T1rho to assess myocardial changes in patients with early coronary heart disease (CHD) with a view to finding the Grey zone of LGE-positive patients, while comparing with T1 mapping and ECV values.Methods
Data acquisition All CMR data were acquired on a Philips 3.0T scanner (Ingenia CX, Best, The Netherlands). 7 patients with CHD with obvious LGE high signals(LGE positive patients) and 3 health volunteers(Normal controls) were recruited between Oct. 2021 to Feb. 2022. The study was approved by the IRB of Ningxia Hui Autonomous Region Hospital, and written informed consent was obtained from all the patients. The CMR imaging protocol consisted of routine sequences (CINE, native T1, T1rho before injecting contrast, after 10 min, LGE, and enhanced T1). The T1rho images were obtained using an electrocardiogram (ECG)-gated T1rho prepared gradient echo sequence in three short-axis slices from the base to the apex. Each slice can obtain four T1rho images with different times of spin locking (TSL(ms):0, 13.3, 26.7, 40 ms) within a single breath-hold. Imaging parameters were: repetition time (TR) 2.5 ms, echo time (TE) 1.09 ms, flip angle 35°, bandwidth 606 Hz/Px, field-of-view (FOV) 360 mm* 297 mm, voxel size 2.0mm * 2.0 mm * 8.0 mm.Data analysis All CMR analysis was performed by the same CMR technician using commercial software CVI42 version 5.2 (Circle Cardiovascular Imaging Inc., Calgary, Canada). In LGE-positive patients, the LGE areas were divided into LGE core zone (5SDs above normal myocardium), grey zone (between 2–5 SDs normal myocardium), and normal zone(2 SD below normal myocardium)according to the signal intensity of LGE (Figure 1). Overall Native T1, T1rho, and ECV values in the Normal controls and that in the LGE core zone, gray zone, and normal zone in the LGE positive patients were measured.Statistical analysis All date was performed using SPSS 21.0 software. Native T1, T1rho, and ECV values at the end of diastole were measured data, which were by normal distribution, represented by mean ± SD. The differences of Native T1, T1rho, and ECV values among all myocardium segments of LGE core, grey zone, and normal zone of LGE positive patients and Normal controls by one-way ANOVA and LSD comparison. Relationships between variables were determined by Pearson correlation. All the comparisons and correlations were two-tailed, and P<0.05 was considered statistically significant.Results
The mean Native T1, T1rho, and ECV values of one patient are shown in Figure 1. Overall T1rho, and ECV values of LGE-positive patients were higher than that in the Normal controls and LGE-positive patients(P>0.05. This may be due to the statistical bias caused by the small amount of our overall data. Native T1 values were not statistically significant in the LGE core, grey zone, or normal zone of LGE-positive patients(P>0.05). T1rho value and ECV value had statistically significant in the LGE core, grey zone, and normal zone of LGE-positive patients(P<0.05).Native T1, T1rho, and ECV values of Grey zone of LGE-positive patients were adopted for correlation analysis. Both native T1 values (Spearman’s r=0.62) and T1ρvalues (Spearman’s r=0.83) were significantly correlated with ECV (both P<0.05). All data are shown in Table 1.Discussion
This study shows a sensitive index can detect the change in cardiomyopathy without a contrast agent. LGE-MRI is the gold standard for in vivo detection of localized myocardial fibrosis, and ECV can be used for quantitative assessment of localized and diffuse fibrosis. However, both techniques rely on gadolinium contrast agents, which risk inducing nephrogenic systemic fibrosis. T1rho can evaluate myocardial fibrosis without a contrast agent. The results of this study showed that the T1rho and ECV values in the grey zone were significantly higher than those in the Normal zone of LGE-positive patients, which were statistically significant(P<0.05)and had a high correlation between the two. So, it can be used as an endogenous diagnostic index when the myocardial structure changes.Conclusion
For patients with CHD, T1rho mapping can be used as a method of detecting myocardial fibrosis regardless of the presence of LGE. It can be used better to identify LGE gray areas compared to native T1 values. Alternatively, an option is offered for patients with contraindications to contrast agents.Acknowledgements
No Acknowledgements foundReferences
[1] Nacif MS, Arai AE, Lima JAC, et al. Gadolinium-enhanced cardiovascular magnetic resonance: administered dose in relationship to United States Food and Drug Administration (FDA) guidelines. J Cardiovasc Magn Reson. 2012; 14:18.[2] Broberg CS, Chugh SS, Conklin C, et al.. Quantification of diffuse myocardial fibrosis and its association with myocardial dysfunction in congenital heart disease. Circ Cardiovasc Imaging 2010;3:727–34.[3] Witschey W, Pilla J, Kevin FG, et al. Rotating frame spin lattice relaxation in a swine model of chronic, left ventricular myocardial infarction. Magn Reson Med. 2010; 64:1453–60 .[4] Dong Z, Yin G, Yang K, et al. Endogenous assessment of late gadolinium enhancement grey zone in patients with non-ischaemic cardiomyopathy with T1ρ and native T1 mapping [published online ahead of print, 2022 Jul 6]. Eur Heart J Cardiovasc Imaging. 2022;jeac128.Figures
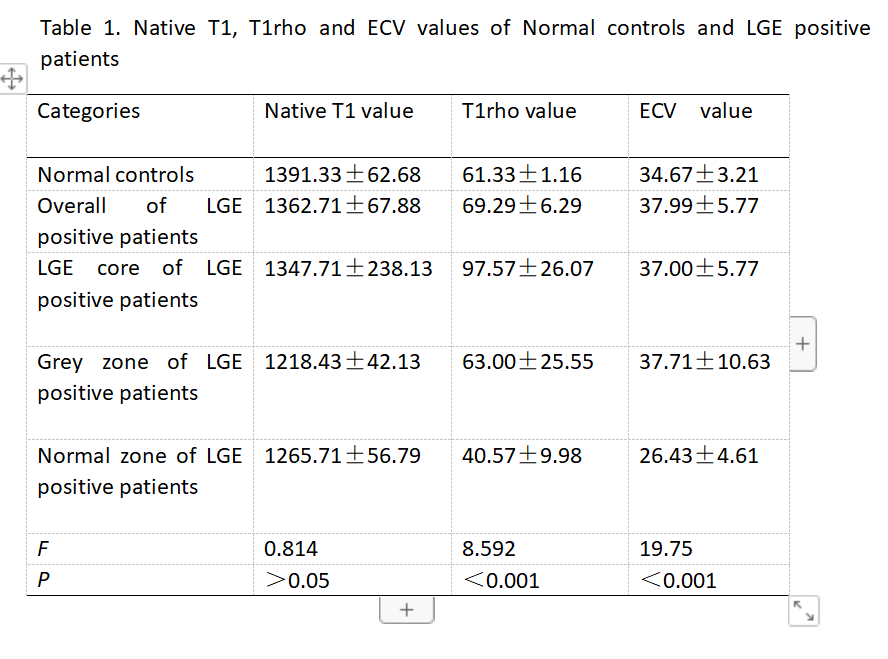
Table1 Native T1, T1rho and ECV values of Normal controls and LGE positive patients
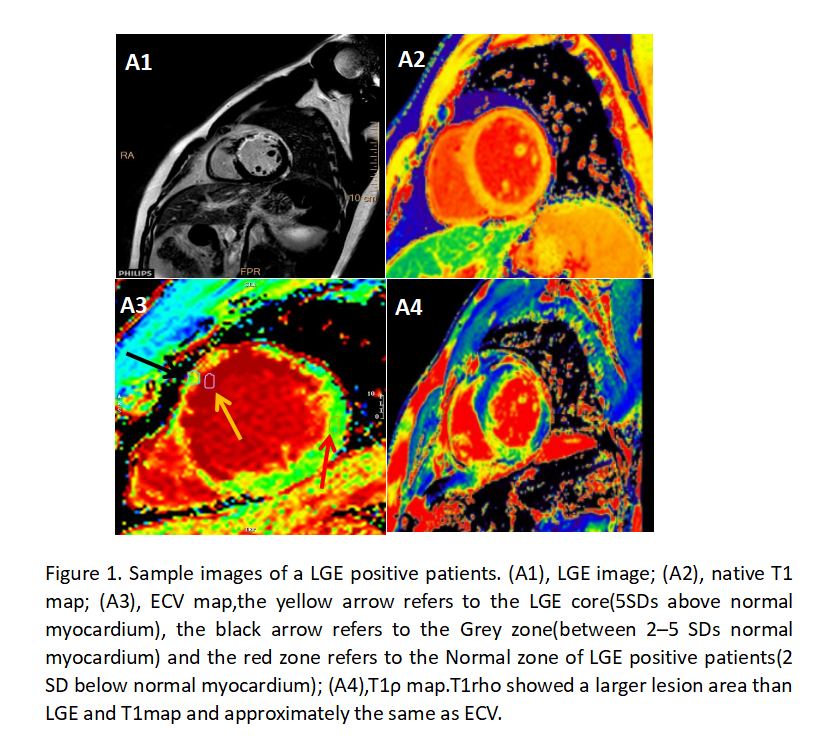
Figure 1. Sample images of a LGE positive patients. (A1), LGE image; (A2), native T1 map; (A3), ECV map,the yellow arrow refers to the LGE core(5SDs above normal myocardium), the black arrow refers to the Grey zone(between 2–5 SDs normal myocardium) and the red zone refers to the Normal zone of LGE positive patients(2 SD below normal myocardium); (A4),T1ρ map.T1rho showed a larger lesion area than LGE and T1map and approximately the same as ECV.
DOI: https://doi.org/10.58530/2023/4849