4839
Do myocardial balanced steady-state free precession signal intensity curves allow to distinguish infarct patients from healthy subjects?
Tom Dresselaers1,2, Baptiste Vande Berg1, Sofie Tilborghs3,4, Alexandru Cernicanu5, and Jan Bogaert1,2
1Radiology, UZ Leuven, Leuven, Belgium, 2Dept. of Imaging and Pathology, KU Leuven, Leuven, Belgium, 3Department of Electrical Engineering (ESAT), KU Leuven, Leuven, Belgium, 4Medical Imaging Research Center, UZ Leuven, Leuven, Belgium, 5Philips Benelux, Eindhoven, Netherlands
1Radiology, UZ Leuven, Leuven, Belgium, 2Dept. of Imaging and Pathology, KU Leuven, Leuven, Belgium, 3Department of Electrical Engineering (ESAT), KU Leuven, Leuven, Belgium, 4Medical Imaging Research Center, UZ Leuven, Leuven, Belgium, 5Philips Benelux, Eindhoven, Netherlands
Synopsis
Keywords: Myocardium, Cardiomyopathy, infarction
Pre-contrast balanced steady-state free precession (bssfp) cine images seem to contain sufficient information to identify patients with an acute or chronic myocardial infarction using radiomics or deep learning methods. The reason remains however to be elucidated. It is also unclear if the cardiac phase should be considered although radiomics features vary through the heart cycle. In this study we show that the known global myocardial bssfp signal intensity variations observed in healthy subject are in fact segment dependent and have a reproducible three peak profile. In patients with acute myocardial infarct these profiles shows segment dependent alterations vs. controls.Introduction
Recent studies suggest that pre-contrast balanced steady-state free precession (bssfp) cine images contain sufficient information to identify patients with an acute or chronic myocardial infarction (MI)1-5. These studies rely on radiomics or deep learning methods exploiting image contrast and texture information that may be, at least in part, nontrivial to interpret visually. Radiomic features of cine bssfp images were however reported to vary substantially throughout the cardiac cycle in healthy subjects6. Previous studies have also demonstrated a marked cyclic behavior of the bssfp signal intensity7,8. Therefore the performance of such classification methods may vary with the cine frame(s) used to establish the model (often end-diastole). Nonetheless, bssfp images can depict edema in acute myocardial infarct similar to T2-STIR images9 which should also be evident from (first order) radiomics features and allow to partly verify the radiomics output.In this study we first aimed to determine the segment-specific signal intensity variability during the heart cycle in healthy subjects. Next we assessed whether in acute MI patients infarct, border or remote segments would deviate from the segment specific temporal signal intensity curves in healthy myocardium. Such information is essential to understand first order and texture features differences induced by myocardial infarction and their dependency on the heart phase. In addition such signal intensity time curves could have diagnostic potential themselves.
Methods
Non-contrast midventricular single slice short axis bSSFP images of 99 consecutive ST-segment elevation AMI patients and 49 subjects with normal findings were initially included in this study. Sixteen infarct patients were excluded because the SAX image did not cover the infarcted myocardium as visualized at late gadolinium-enhanced (LGE) CMR. Images were recorded at 1.5T (Philips Ingenia) with a standard phase array anterior and posterior coil combination and using a bssfp sequence (TR 3.7ms, TE 1.7ms, flip angle 60°, accel. fact. 2, matrix 160 × 256; field of view, 300 mm; pixel size, 1.6 × 1.6 mm; slice thickness 8 mm and number of phases, 30, phase percentage, 67%).All cine frames were automatically contoured using commercial software (Neosoft suiteHEART®). Contours were exported and further used for processing using an in-house tool (matlab R2019). First, any residual blood pool pixels were excluded based on a blood pool signal intensity threshold (one SD from mean left ventricular blood pool signal intensity in the image). Next, the RV insertion points were manually selected and a six-segments model was applied. Then, the signal intensity curves per segment and complete myocardium were determined per subject. Next average signal intensity curves were calculated for infarct, border, remote and healthy segments (number of segments in table 1). Relative signal intensity curves (segmental or full myocardium) were also calculated by defining the average signal intensity (full myocardium) of the complete cardiac cycle as hundred percent per subject. Inter-subject variability in end-systolic and end-diastolic frame were limited (table 2) and ignored for the group-wise calculations.
Results and Discussion
Signal intensity curves in healthy subjects showed a distinctive pattern of three peaks coinciding with fast filling and contractility phases during systole and diastole (rapid left ventricular in/outflow phases; figure 1). Notably, inferior and inferolateral segments consistently showed a stronger signal intensity increase during systole than anterior and anteroseptal segments (figure 2: black triangles). End-diastolic signal intensity was however similar between segments in healthy subjects. In contrast to what perhaps could be expected based on B1 or rf coil sensitivity, anterior, anteroseptal and anterolateral signal intensities were lowest. Previous work by Goldfarb and colleagues6 reported similar cine signal intensity variation although they only described two maxima (non-segmental) likely due to the lower temporal resolution (20 vs 30 frames). Through-plane motion was initially suggested as a major factor for this signal intensity variation8. Spear and colleagues concluded however that that there is no correlation with peak signal intensity changes and longitudinal shortening although there is some dependency on slice location (base to apex)9. In infarct patients, inferior to lateral segments containing infarcted tissue had a higher signal intensity than remote or border segments across most of the cardiac cycle. This was less the case for anterior and septal segments. This likely reflects the hyperintense edema area in acute MI that is most clearly depicted during systole (vs remote or border zones) as previously reported 7,10 although not evident for all segments. Main contrast mechanisms underpinning this edema depiction were found to be proton density and alterations in magnetization transfer, although through plane motion and blood flow may also contribute8,10,11. Relative signal intensity curves provided essentially the same results (figure 4).Conclusion
A full heart cycle bssfp signal intensity analysis shows marked segment dependent differences between healthy subjects and infarct patients. Healthy subjects showed a distinctive pattern with three peaks while in infarct patients deviations during systole were evident. Studies relying on radiomics of bssfp data should consider the contrast dependency on the heart cycle and could potentially exploit this region-dependent cyclic behavior.Acknowledgements
No acknowledgement found.References
- Larroza A, López-Lereu MP, Monmeneu JV, et al. Texture analysis of cardiac cine magnetic resonance imaging to detect nonviable segments in patients with chronic myocardial infarction. Med Phys. 2018;45(4):1471-1480. doi:10.1002/mp.12783
- Larroza A, Materka A, López-Lereu MP, Monmeneu JV, Bodí V, Moratal D. Differentiation between acute and chronic myocardial infarction by means of texture analysis of late gadolinium enhancement and cine cardiac magnetic resonance imaging. Eur J Radiol. 2017;92:78-83. doi:10.1016/j.ejrad.2017.04.024
- Rauseo E, Izquierdo Morcillo C, Raisi-Estabragh Z, et al. New Imaging Signatures of Cardiac Alterations in Ischaemic Heart Disease and Cerebrovascular Disease Using CMR Radiomics. Front Cardiovasc Med. 2021;8:716577. Published 2021 Sep 23. doi:10.3389/fcvm.2021.716577
- Avard E, Shiri I, Hajianfar G, et al. Non-contrast Cine Cardiac Magnetic Resonance image radiomics features and machine learning algorithms for myocardial infarction detection. Comput Biol Med. 2022;141:105145. doi:10.1016/j.compbiomed.2021.105145.
- Baessler B, Mannil M, Oebel S, Maintz D, Alkadhi H, Manka R. Subacute and Chronic Left Ventricular Myocardial Scar: Accuracy of Texture Analysis on Nonenhanced Cine MR Images. Radiology. 2018;286(1):103-112. doi:10.1148/radiol.2017170213
- Alis D, Yergin M, Asmakutlu O, Topel C, Karaarslan E. The influence of cardiac motion on radiomics features: radiomics features of non-enhanced CMR cine images greatly vary through the cardiac cycle. Eur Radiol. 2021;31(5):2706-2715. doi:10.1007/s00330-020-07370-y.
- Goldfarb JW, McLaughlin J, Gray CA, Han J. Cyclic CINE-balanced steady-state free precession image intensity variations: implications for the detection of myocardial edema. J Magn Reson Imaging. 2011;33(3):573-581. doi:10.1002/jmri.22368
- Weber OM, Speier P, Scheffler K, Bieri O. Assessment of magnetization transfer effects in myocardial tissue using balanced steady-state free precession (bSSFP) cine MRI. Magn Reson Med. 2009;62(3):699-705. doi:10.1002/mrm.22053.
- Spear TJ, Stromp TA, Leung SW, Vandsburger MH. Influence of longitudinal position on the evolution of steady-state signal in cardiac cine balanced steady-state free precession imaging. Acta Radiol Open. 2017;6(11):2058460117729186. Published 2017 Nov 21. doi:10.1177/2058460117729186
- Kumar A, Beohar N, Arumana JM, et al. CMR imaging of edema in myocardial infarction using cine balanced steady-state free precession. JACC Cardiovasc Imaging. 2011;4(12):1265-1273. doi:10.1016/j.jcmg.2011.04.024
- Zhou X, Rundell V, Liu Y, et al. On the mechanisms enabling myocardial edema contrast in bSSFP-based imaging approaches. Magn Reson Med. 2011;66(1):187-191. doi:10.1002/mrm.22794
Figures
Figure
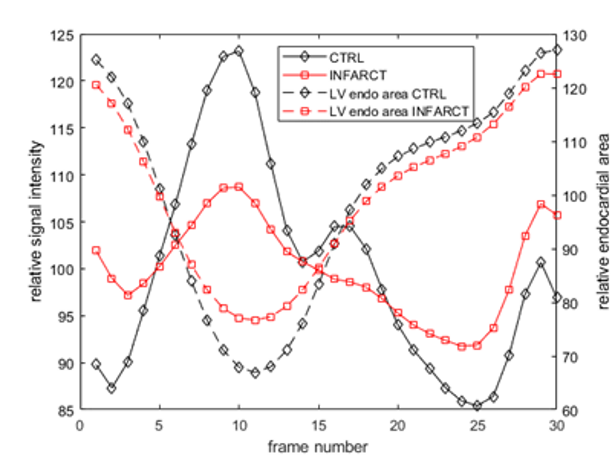
1: The relative signal intensity and endocardial area changes (vs. mean over
time within subject group) for healthy controls and infract patients. The group
averaged systolic variations differ in infarct subjects from the typical fluctuations
during the heart cycle in control subjects.
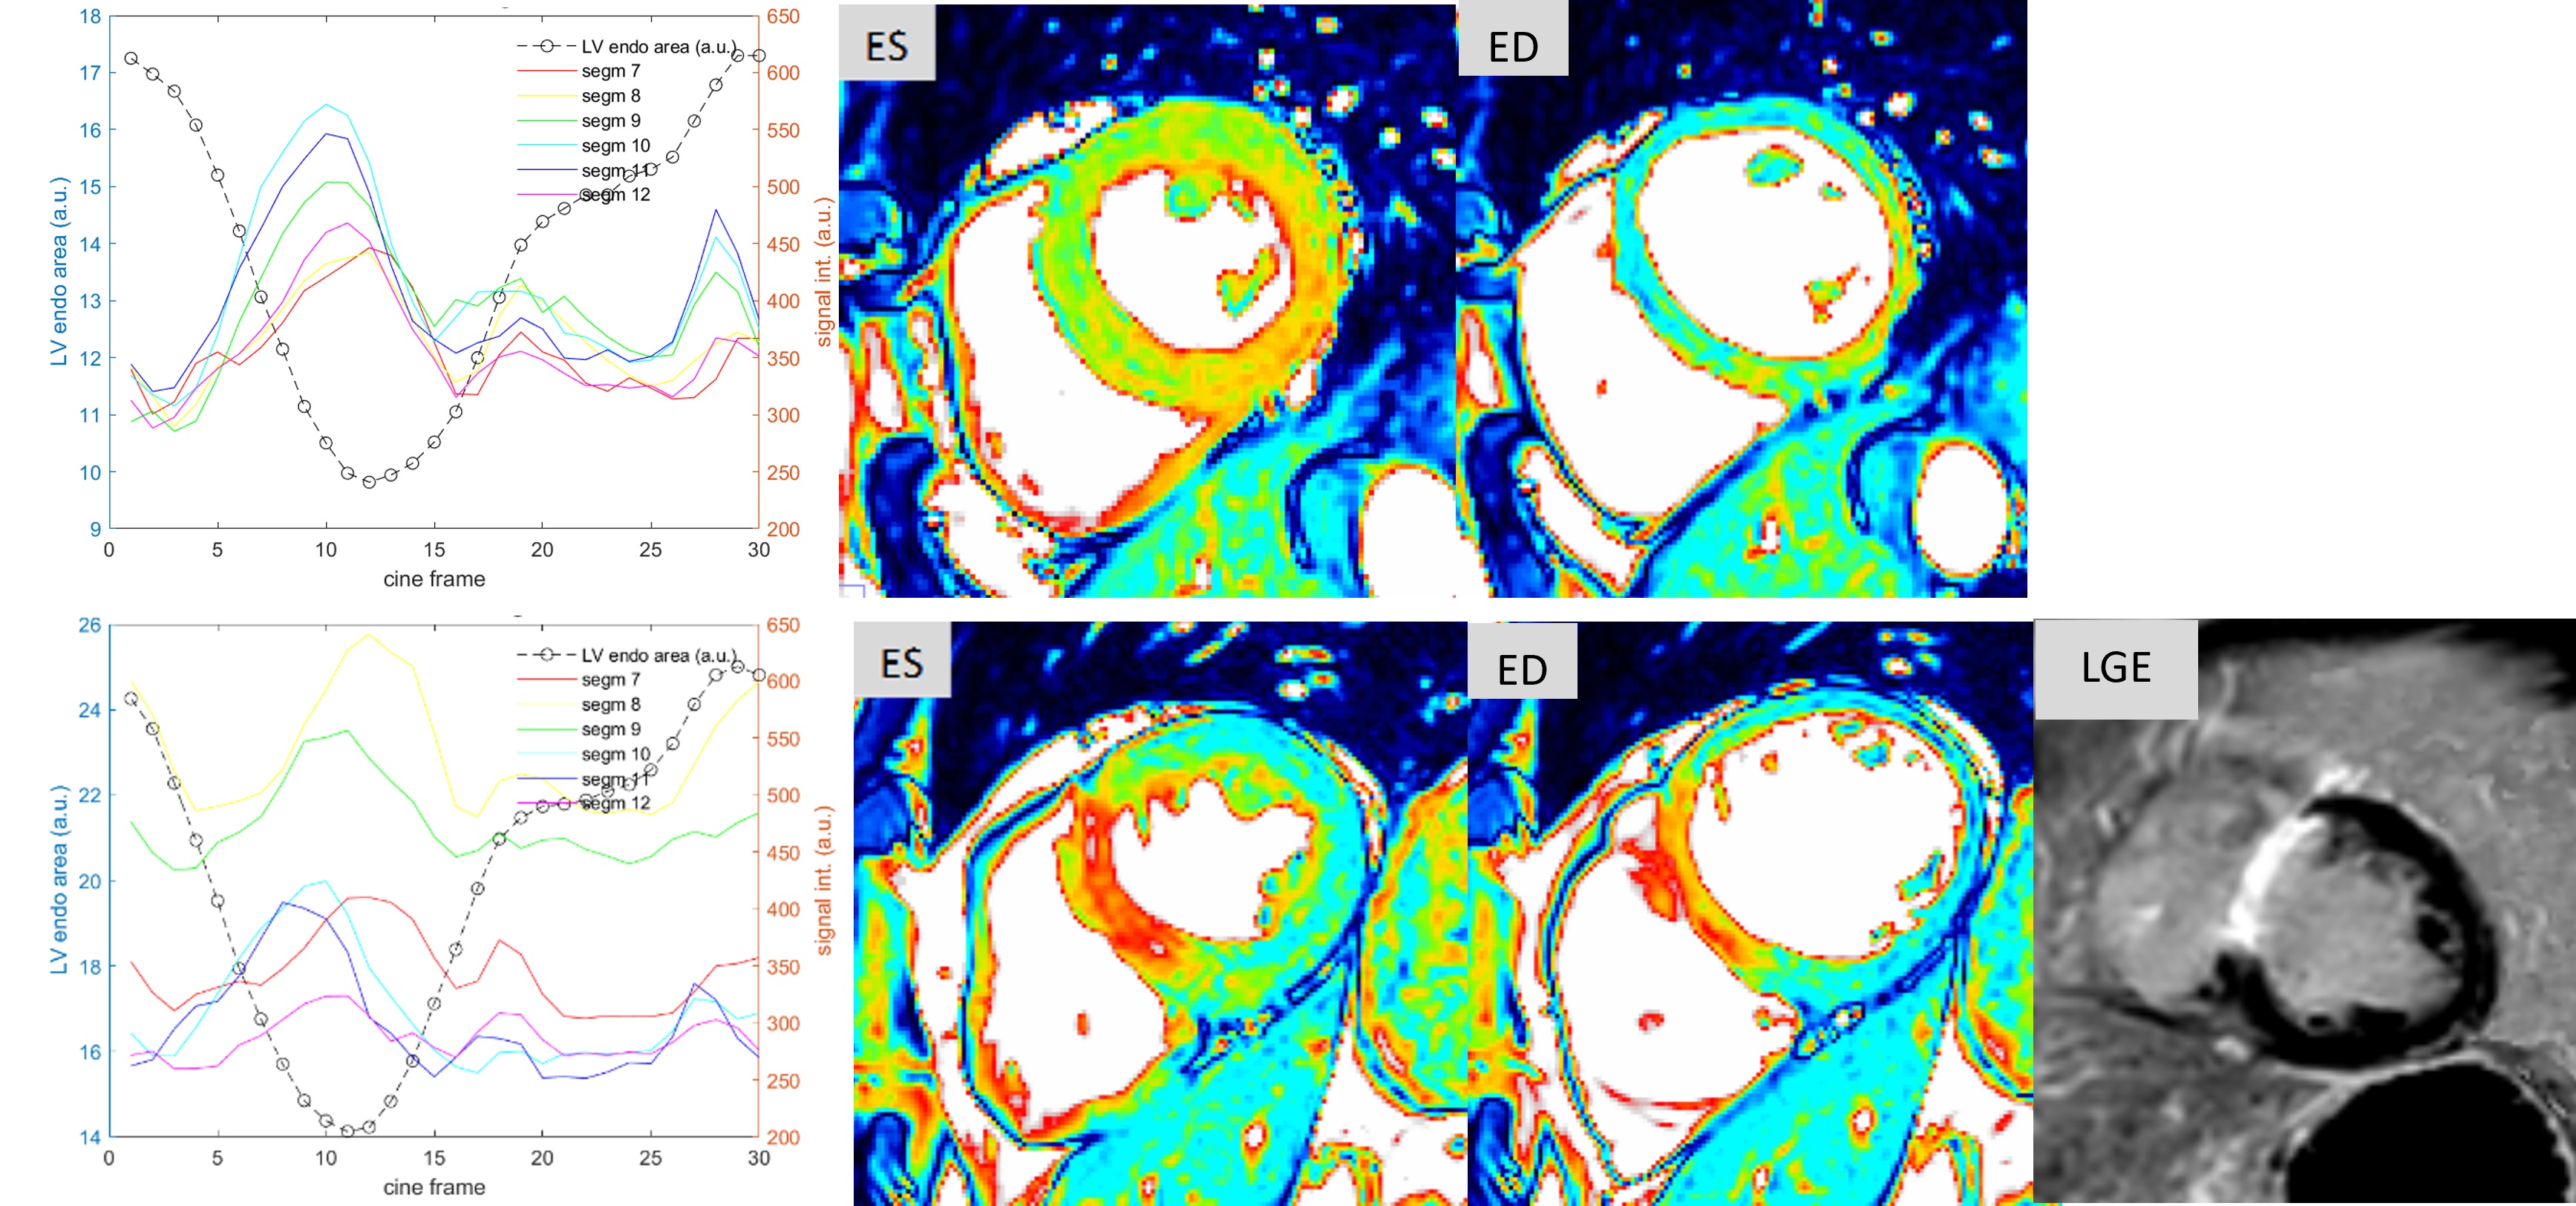
Figure
2: Examples of signal intensity curves through the cardiac cycle and images
from end-systolic and end diastolic frames from a control subject (top), a
patient with a septal infarct with edema (bottom). Cine images are shown in
color scale to better visualize the regional, temporal and inter-subject
variability.
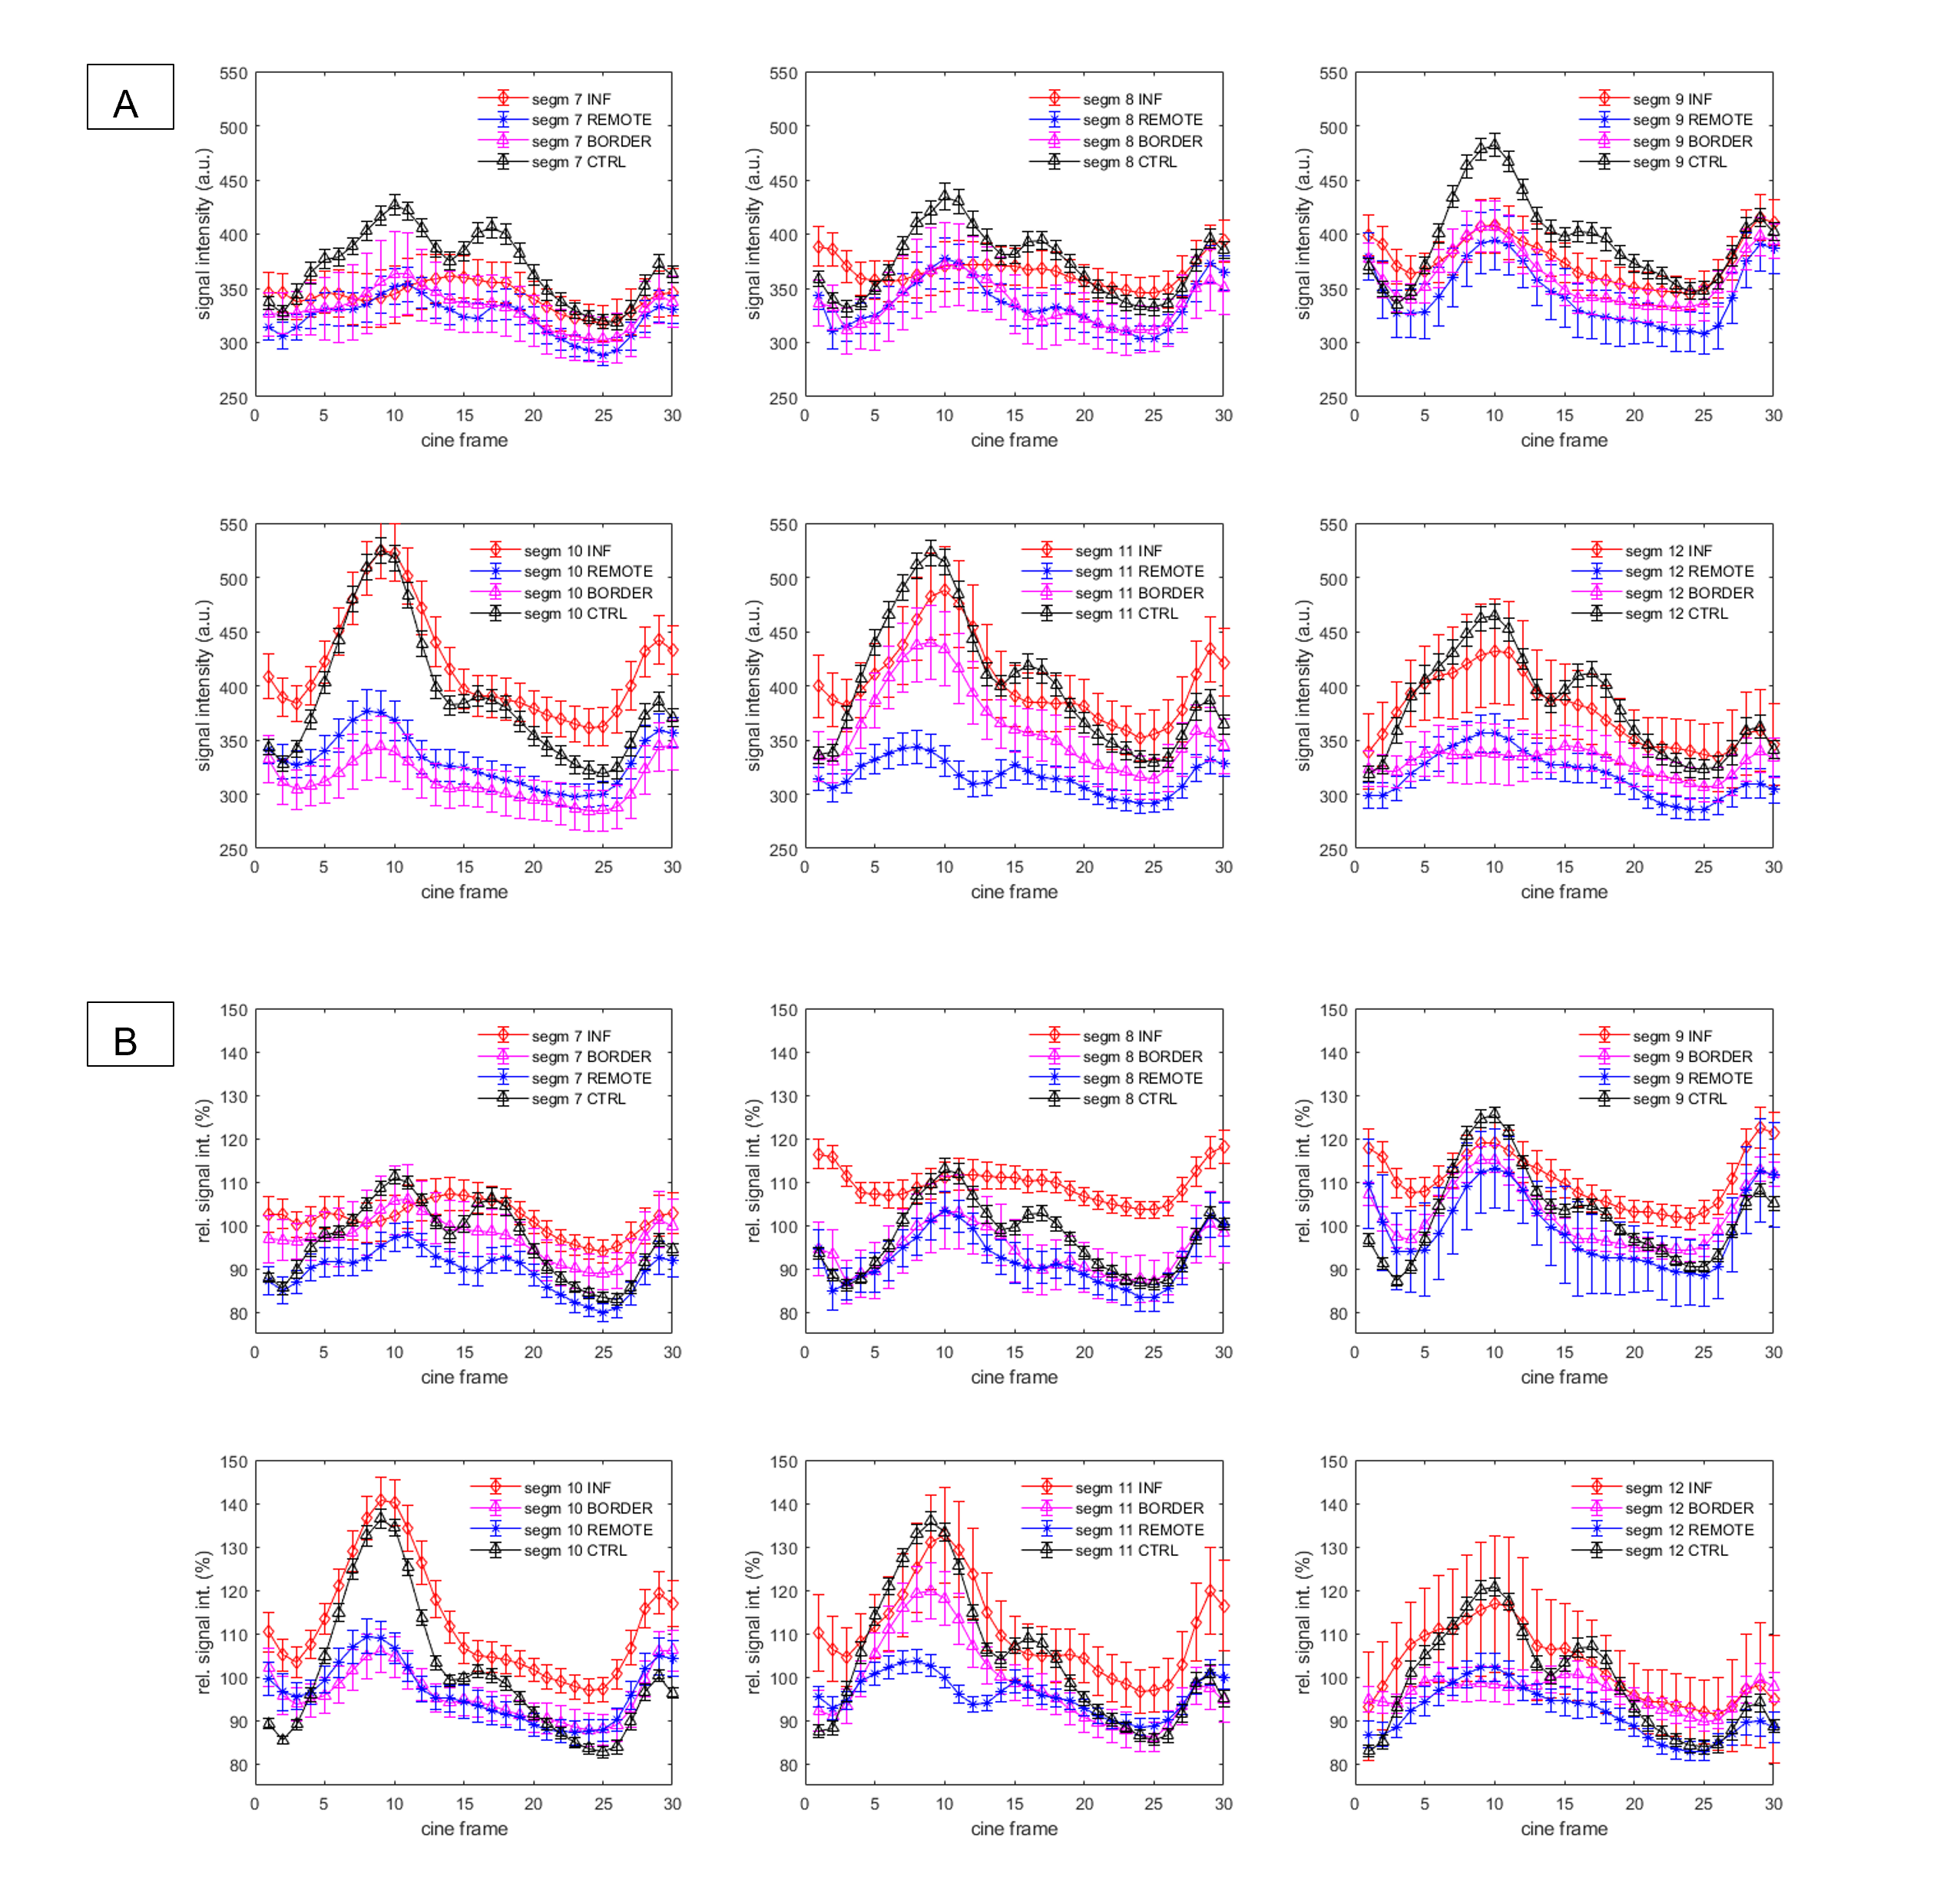
Figure 3: (A) Segment-type averaged signal intensity time curves for the six mid-ventricular segments (segments: 7: anterior, 8: anteroseptal, 9: inferoseptal 10: inferior, 11: inferolateral, 12: anterolateral). (B) Segment-type averaged relative signal intensity time curves. The mean signal intensity of all segments and cine frames was taken as a subject-specific reference. Error margins indicate standard errors.
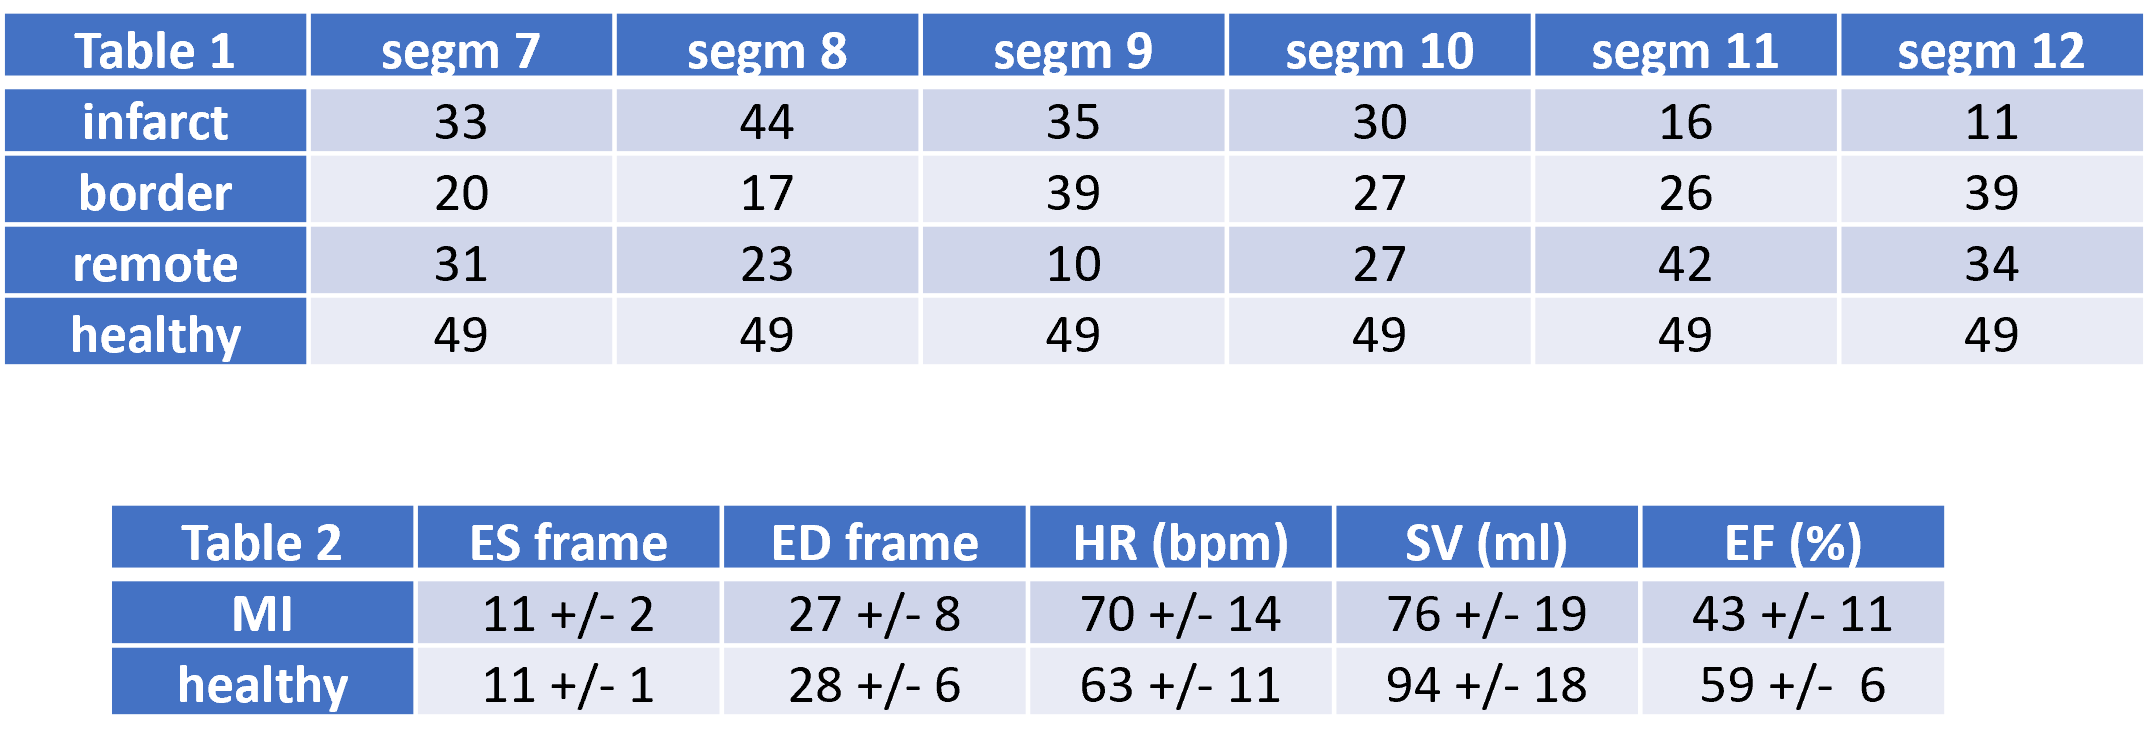
Table1: Number of subjects per segment with that segment defined as either infarct, border, remote or healthy based on LGE imaging (number of subjects contributing to figure 2).
Table 2: End-systolic and end-diastolic frame number and functional parameters.
DOI: https://doi.org/10.58530/2023/4839