4838
Assessing Myocardial Microvascular Reactivity with a Novel MRI Blood-Pool Imaging Approach1Institute of Biomedical Engineering, University of Toronto, Toronto, ON, Canada, 2Translational Biology & Engineering Program, Ted Rogers Centre for Heart Research, Toronto, ON, Canada, 3McEwen Stem Cell Institute, University Health Network, Toronto, ON, Canada, 4Laboratory of Medicine and Pathobiology, University of Toronto, Toronto, ON, Canada, 5Peter Munk Cardiac Centre, University Health Network, Toronto, ON, Canada, 6The Edward S. Rogers Sr. Department of Electrical and Computer Engineering, University of Toronto, Toronto, ON, Canada
Synopsis
Keywords: Vessels, Perfusion
Coronary microvascular dysfunction is driven by vascular inflammation and can go undetected for years. Current imaging diagnostics lack the ability to quantify microvascular vasomodulation, a potential biomarker for cardiac diseases dominated by microvascular disease. We propose a novel MRI approach that utilizes elevated carbon dioxide and a blood-pool contrast agent to quantify changes in microvascular blood volume. Our results confirmed hypercapnia caused strong vasodilation within female myocardium but no response in males. Transitioning from hypercapnia to room air elicited strong vasoconstriction in both sexes. This technology will be valuable for early detection of microvascular dysfunction in various diseases.
INTRODUCTION
Microvascular dysfunction (mvD), and more specifically coronary microvascular disease (CMD), has been implicated as the primary hallmark of several cardiac and inflammatory diseases afflicting millions of people worldwide. The onset and progression of microvascular disease is driven by vascular inflammation and is characterized by vascular smooth muscle cell thickening and impaired vasomodulation, both of which ultimately reduce perfusion and damage tissue1. To meet metabolic demands, the body recruits additional assistance from our microvascular reserve, which is diminished during stress, thus resulting in a dampened vasomodulatory response to stimuli2. Diagnosing mvD in the myocardium, therefore, requires a non-invasive method to measure vasomodulation or, more precisely, changes in microvascular blood volume.Current clinical imaging diagnostic platforms lack the ability to detect vasomodulation in a sensitive and specific manner. Because of this shortcoming, there is also no literature sex comparison of cardiac microvascular reactivity in response to stress. This work aims to address this technology and knowledge gap by developing and demonstrating a novel MRI technique for the specific assessment of vasomodulation without confounding influences from changes in blood oxygen saturation, hematocrit, or flow velocity. This tool will create an unprecedented non-invasive technology to assess microvascular function in the beating heart, allowing the potential for early diagnosis in patients who go on to develop CMD.
METHODS
In previous work, our lab explored the utility of gas stimuli, specifically, elevated carbon dioxide (CO2) levels to induce a state of hypercapnia, for assessing the functionality of microvessels in abdominal organs3–5. Elevated CO2 is a safe and reliable vasodilatory or vasoconstrictive stimulus and is effective in differentiating healthy from diseased vasculature. Very briefly, various levels of CO2 (5-20%) were mixed with 21% oxygen, balanced nitrogen and directed into an intubated rat. Respiration was controlled via a ventilator (80 breaths/minute); vital signs and blood oxygen saturation were monitored via an oximeter (Figure 1). A blood-pool T1 contrast agent (Ablavar, Lantheus, USA) was injected intravenously as a bolus (0.3mmol/kg) to saturate the blood volume fraction, eliminating sensitivity to molecular oxygen and producing changes in T1 dominated by the blood volume fraction. The extended residency time of Ablavar, which stems from protein binding, allows a prolonged period of stable T1 signal enhancement (~40 minutes)6,7. A specialized cardiac gating software that utilizes respiratory motion was used to retrospectively gate the rodent`s heartbeat to the scanner to acquire cardiac images in one of two phases of the cardiac cycle8.Imaging was performed on a 3 Tesla pre-clinical scanner (MR Solutions, United Kingdom) on a cohort of young (4 months old) male (n = 4) and female (n = 5) Sprague Dawley rats. The imaging protocol consisted of: 1) baseline 3D Cine in the true short-axis plane and pre-injection T1-mapping (flip angles: 2o, 5o, 10o, 15o, 20o, TR = 7msec), 2) Ablavar injection and subsequent T1- weighted Cine FLASH acquisitions every 5 minutes (flip angle = 15o, TR = 6msec). The gas challenge regime post-contrast consisted of 10 minutes at normoxia (21% oxygen), followed by 10 minutes at 10% CO2, and finally a return to normoxia for 10 minutes. Quantitative analysis was completed in-house using Matlab (v2022, MathWorks). Slice location for image analysis was consistent among all animals and regions of interest were mapped out manually around the septum and the anterior and posterior myocardial wall. Changes observed on MRI were validated with real-time perfusion measurements using laser Doppler flowmetry (OxyFlo, Oxford Optronix, United Kingdom). A fiber-optic probe was secured into the myocardium of the left ventricle and perfusion in arbitrary units was measured while the rat underwent the gas regime specified.
RESULTS
Exposure to 10% CO2, a known cardiac vasodilator, elicited conflicting results when compared across sexes. Young female rats demonstrated a strong vasodilatory response within 10 minutes of hypercapnic exposure, quantified through the drastic reduction in T1, while their male counterparts exhibited little to no change. When reverting to room air following 10 minutes of CO2, both male and female animals exhibited strong vasoconstriction, quantified by a drastic increase in T1 (Figures 2-3, Table 1). Laser Doppler perfusion measurements for validation confirmed that anywhere between 10-20% CO2 resulted in increased perfusion while less than 5% CO2 reduced perfusion (Figure 4).DISCUSSION
Our results demonstrate that our technology is sufficiently sensitive and specific to detect and quantify hypercapnia-induced changes in microvascular blood volume in the myocardium. Low levels of CO2 elicit a vasodilatory response in the myocardium, which can then be reversed by immediate exposure to normoxia, or room air. We also discover that females demonstrate a much stronger response to hypercapnic stimuli when compared to their male counterparts. This diagnostic tool will be immensely helpful for diagnosing mvD as an early biomarker of inflammation-related heart disease.CONCLUSION
This work described a novel MRI diagnostic tool for highly specific assessment of microvascular vasomodulation and demonstrated a greater vasodilatory response to hypercapnic stimuli in female rats compared to male. This non-invasive technology will be valuable for early diagnosis of cardiac disease in patients predisposed to developing mvD (e.g. in diabetic cardiomyopathy).Acknowledgements
This work was supported by the Canadian Institutes of Health Research [grant number #PJT-175131 to H.L.M.C.]; Natural Sciences and Engineering Research Council of Canada [grant number #RGPIN-2019-06137 to H.L.M.C.]; Canada Foundation for Innovation/Ontario Research Fund [grant #34038 to H.L.M.C.]; Dean’s Spark Professorship [to H.L.M.C.]. SL is funded by a Ted Rogers Centre for Heart Research PhD Education Fund and a Doctoral Completion Award from the University of Toronto. The authors would like to acknowledge Alexander Mertens for his contributions towards optimizing the Matlab code for image quantification and reconstruction.
References
1. Callewaert, B., Jones, E. A. V., Himmelreich, U. & Gsell, W. Non-Invasive Evaluation of Cerebral Microvasculature Using Pre-Clinical MRI: Principles, Advantages and Limitations. Diagnostics (Basel, Switzerland) 11, (2021).
2. Thomas, M. A., Hazany, S., Ellingson, B. M., Hu, P. & Nguyen, K. L. Pathophysiology, classification, and MRI parallels in microvascular disease of the heart and brain. Microcirculation 27, (2020).
3. Ganesh, T., Estrada, M., Duffin, J. & Cheng, H. L. T2* and T1 assessment of abdominal tissue response to graded hypoxia and hypercapnia using a controlled gas mixing circuit for small animals. J. Magn. Reson. Imaging 44, 305–316 (2016).
4. Ganesh, T., Zakher, E., Estrada, M. & Cheng, H. L. M. Assessment of microvascular dysfunction in acute limb ischemia-reperfusion injury. J. Magn. Reson. Imaging 49, 1174–1185 (2019).
5. Ganesh, T., Estrada, M., Yeger, H., Duffin, J. & Margaret Cheng, H. L. A non-invasive magnetic resonance imaging approach for assessment of real-time microcirculation dynamics. Sci. Rep. 7, (2017).
6. Goyen, M. Gadofosveset-enhanced magnetic resonance angiography. Vasc. Health Risk Manag. 4, 1 (2008).
7. Rosen, B. R., Belliveau, J. W., Vevea, J. M. & Brady, T. J. Perfusion imaging with NMR contrast agents. Magn. Reson. Med. 14, 249–265 (1990).
8. Daal, M. R. R. et al. Quantification of Mouse Heart Left Ventricular Function, Myocardial Strain, and Hemodynamic Forces by Cardiovascular Magnetic Resonance Imaging. J. Vis. Exp. 2021, (2021).
Figures
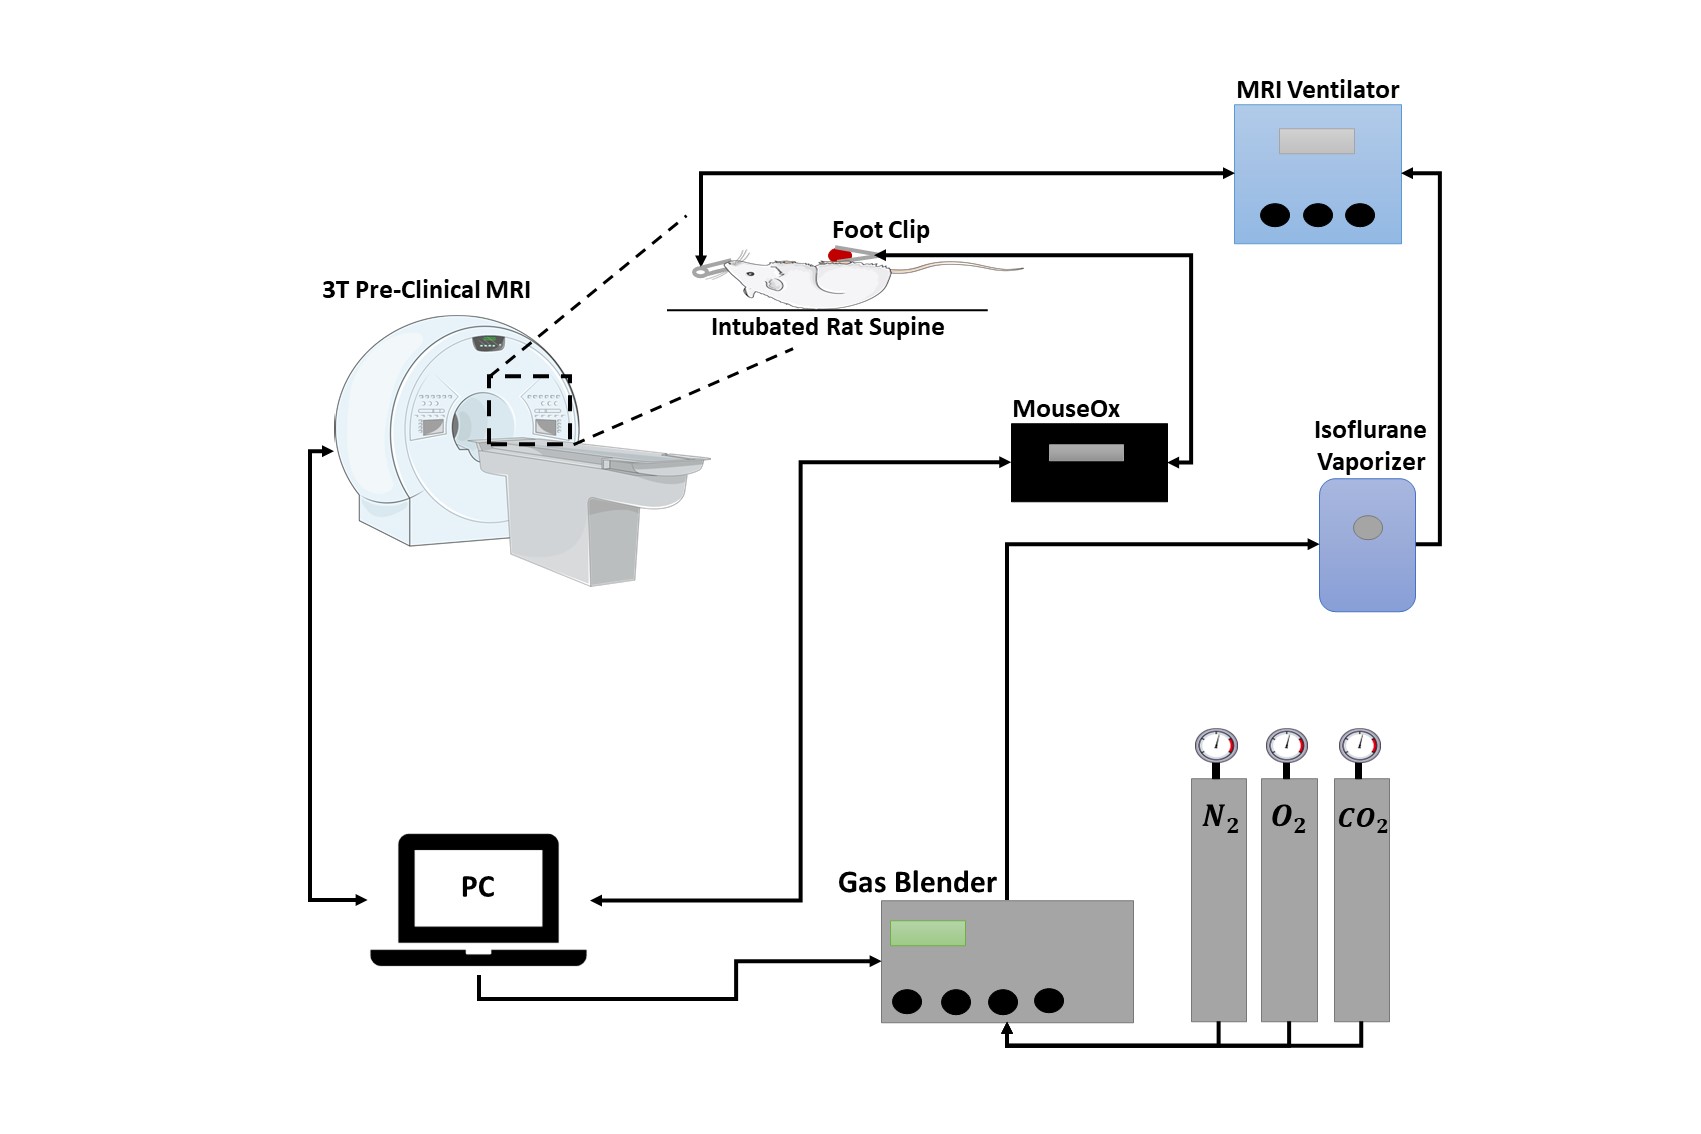
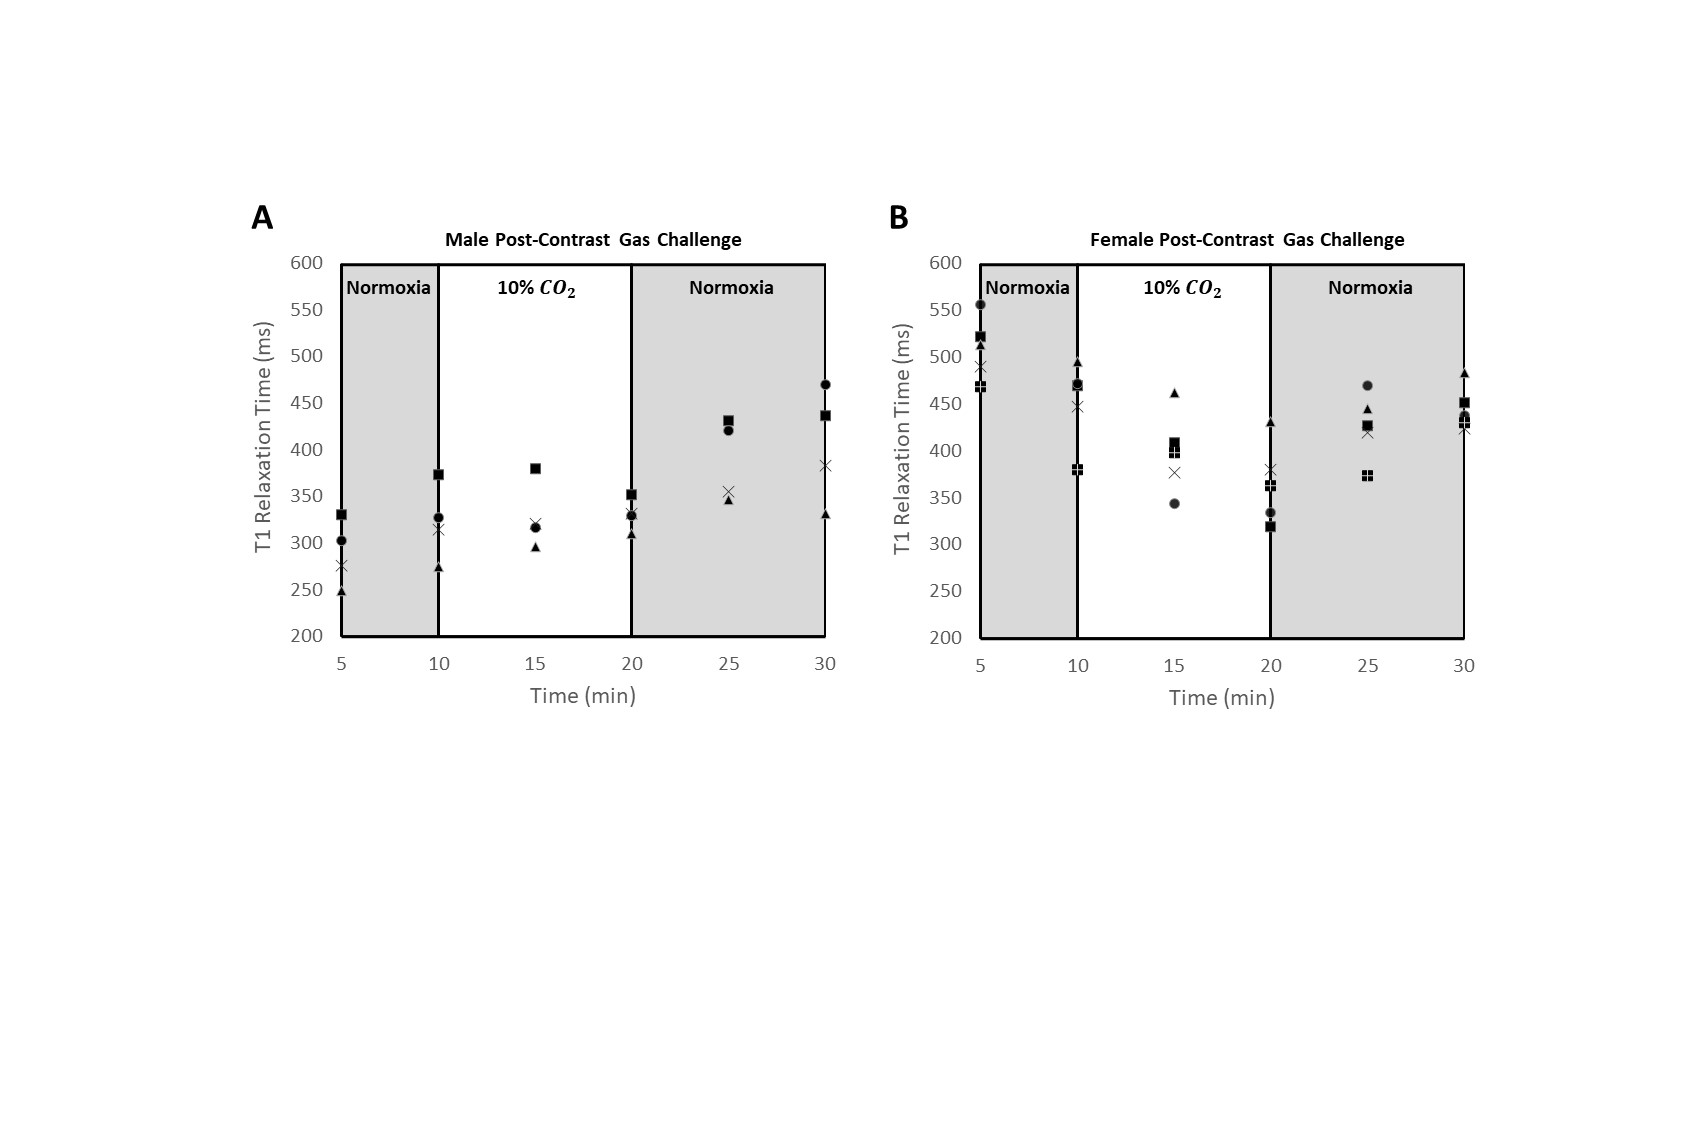
Figure 2. T1 measurements in dynamic MRI of microvascular response to hypercapnia in rat cardiac muscle (septum, anterior, and posterior walls). Gas regime consisted of 10 minutes at normoxia post-contrast injection, followed by 10 minutes at 10% ![]() , and lastly a return to 10 minutes of normoxia. Graphs display data points for individual male (n=4) (A) and female (n=5) (B) rats.
, and lastly a return to 10 minutes of normoxia. Graphs display data points for individual male (n=4) (A) and female (n=5) (B) rats.
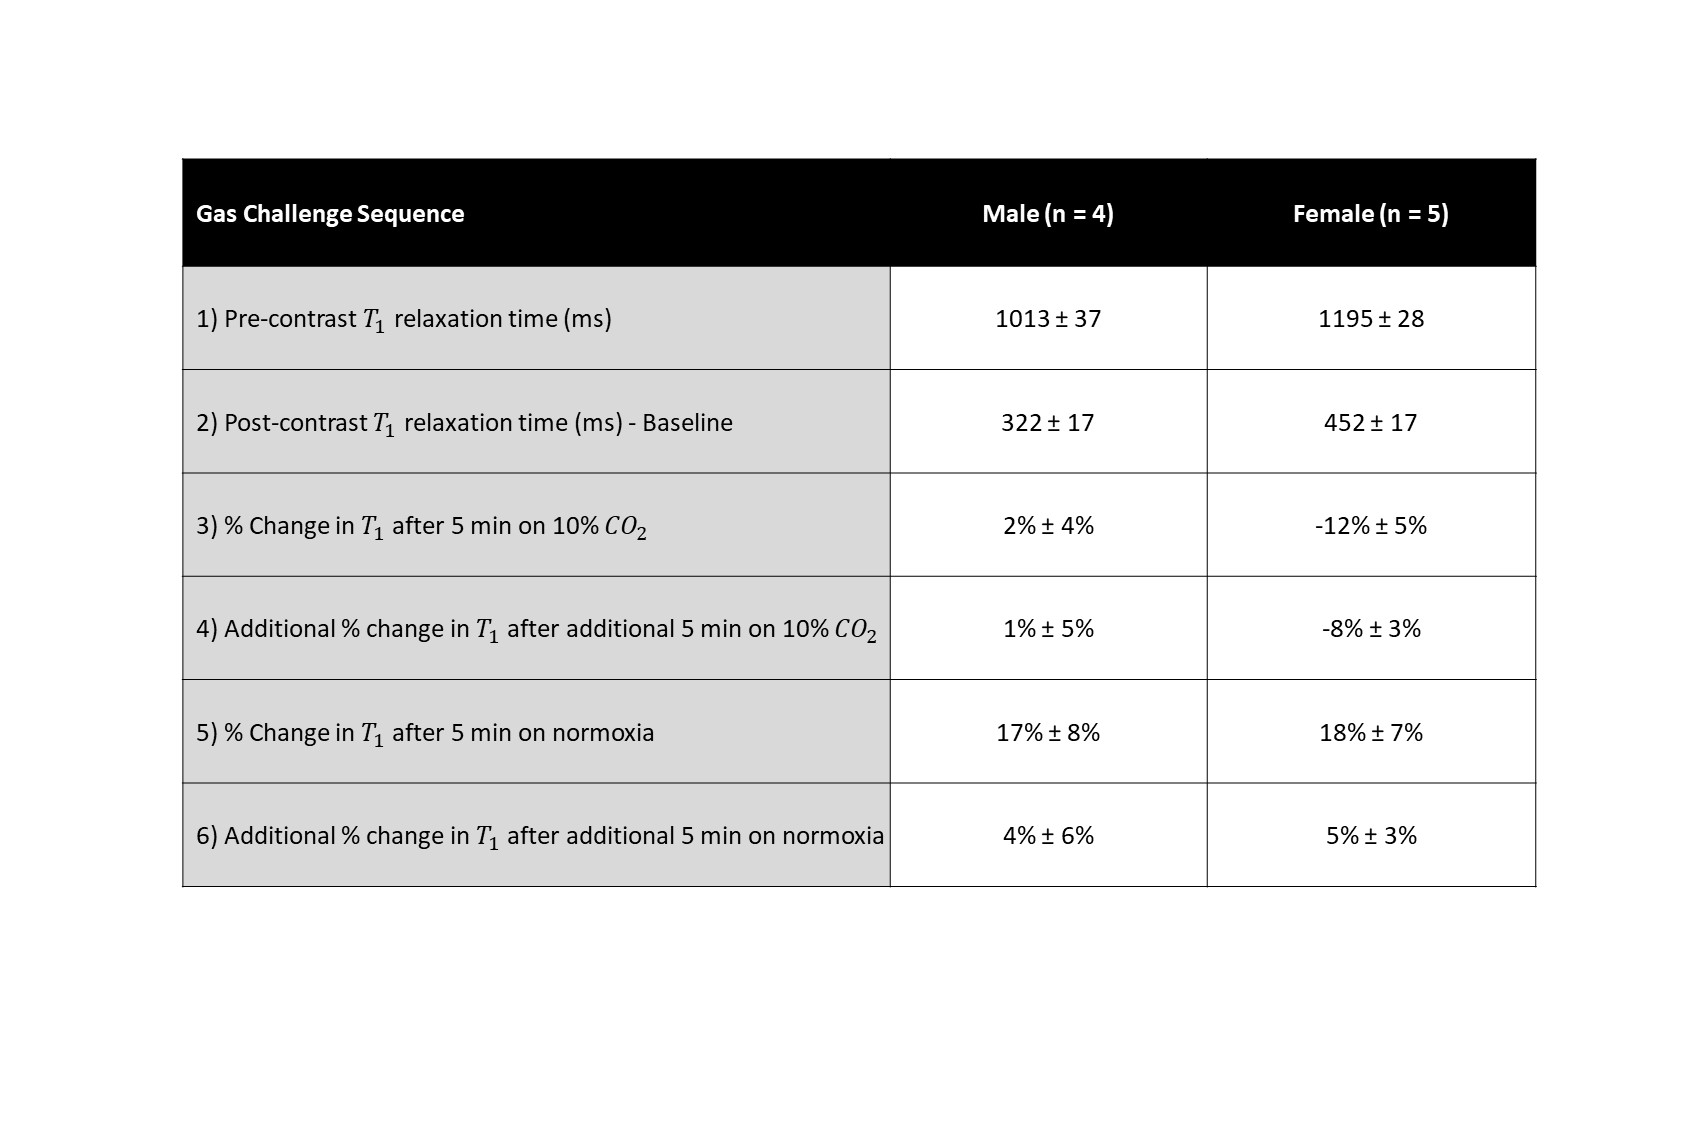
Table 1. Gas challenge sequence and corresponding 𝑇1 relaxation time measurements (ms). Percent changes are calculated with respect to the previous imaging step.
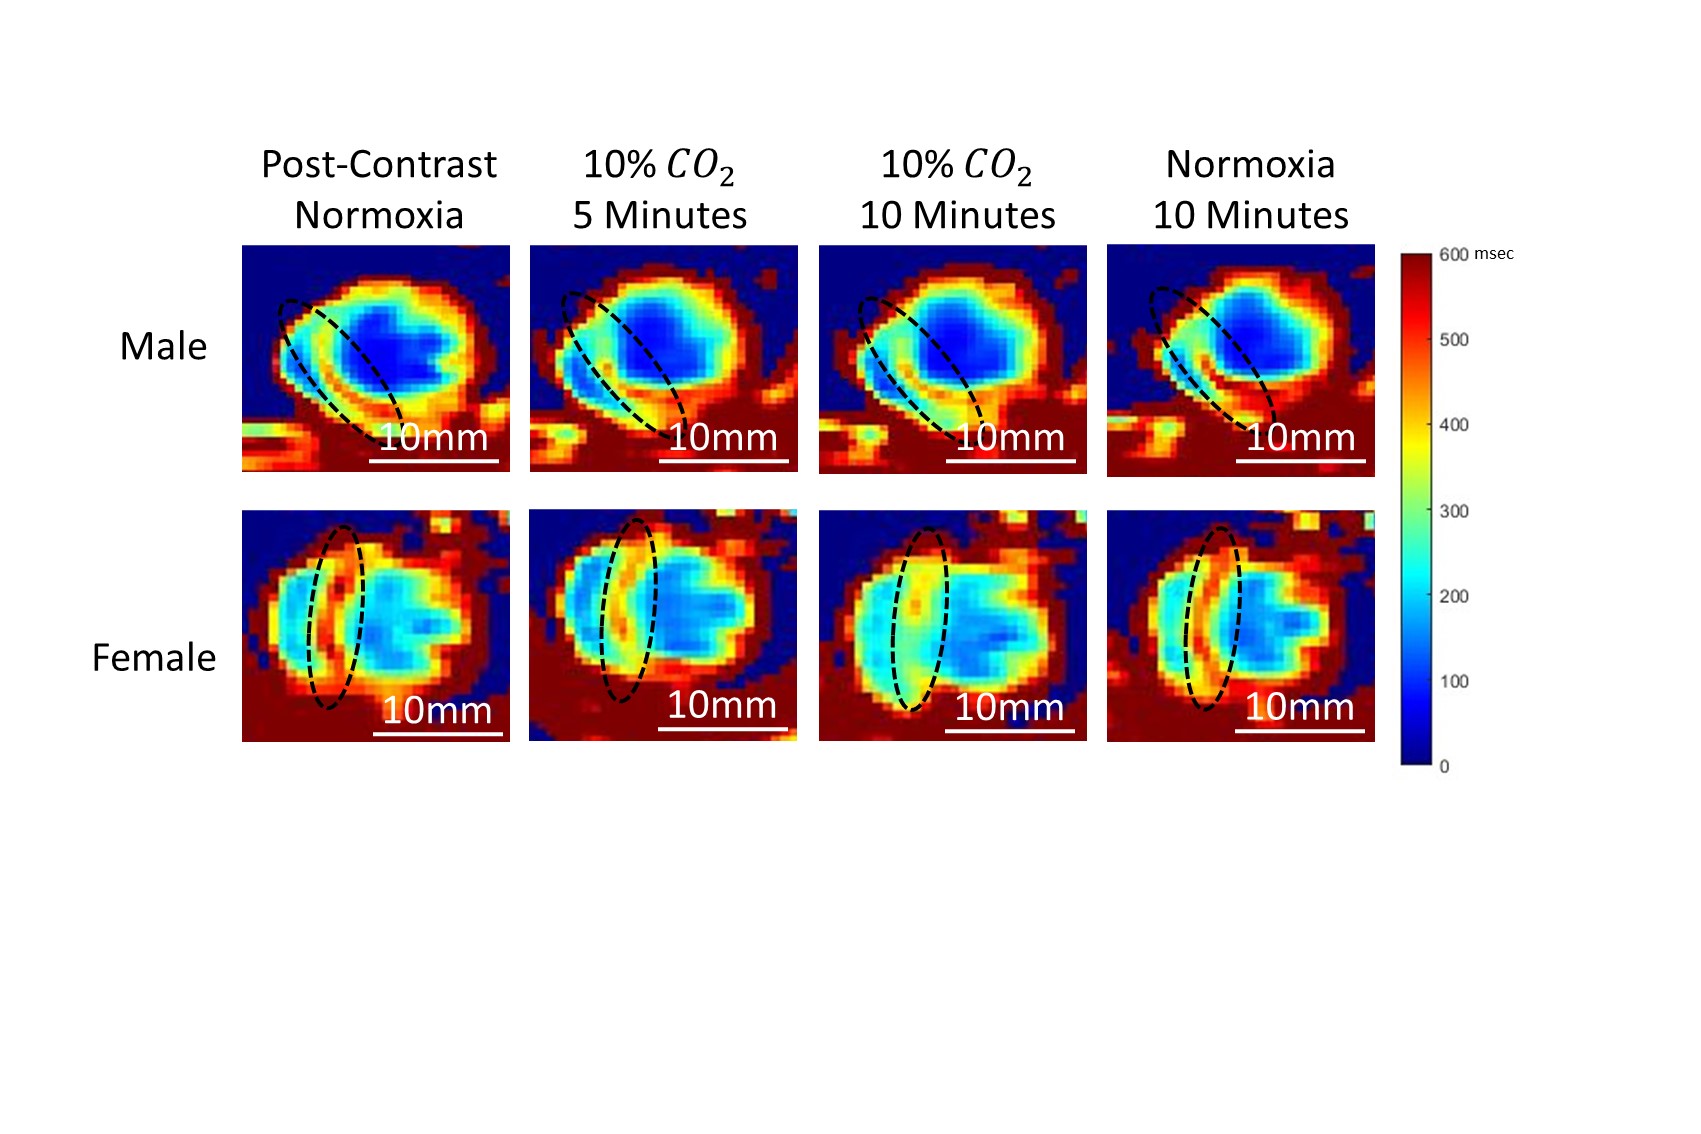
Figure 3. Representative T1 maps of the heart from a young (4 months) male (top) and female (bottom) rat undergoing hypercapnic challenge. T1 relaxation times were quantified in the septum, anterior, and posterior walls (black dotted oval).
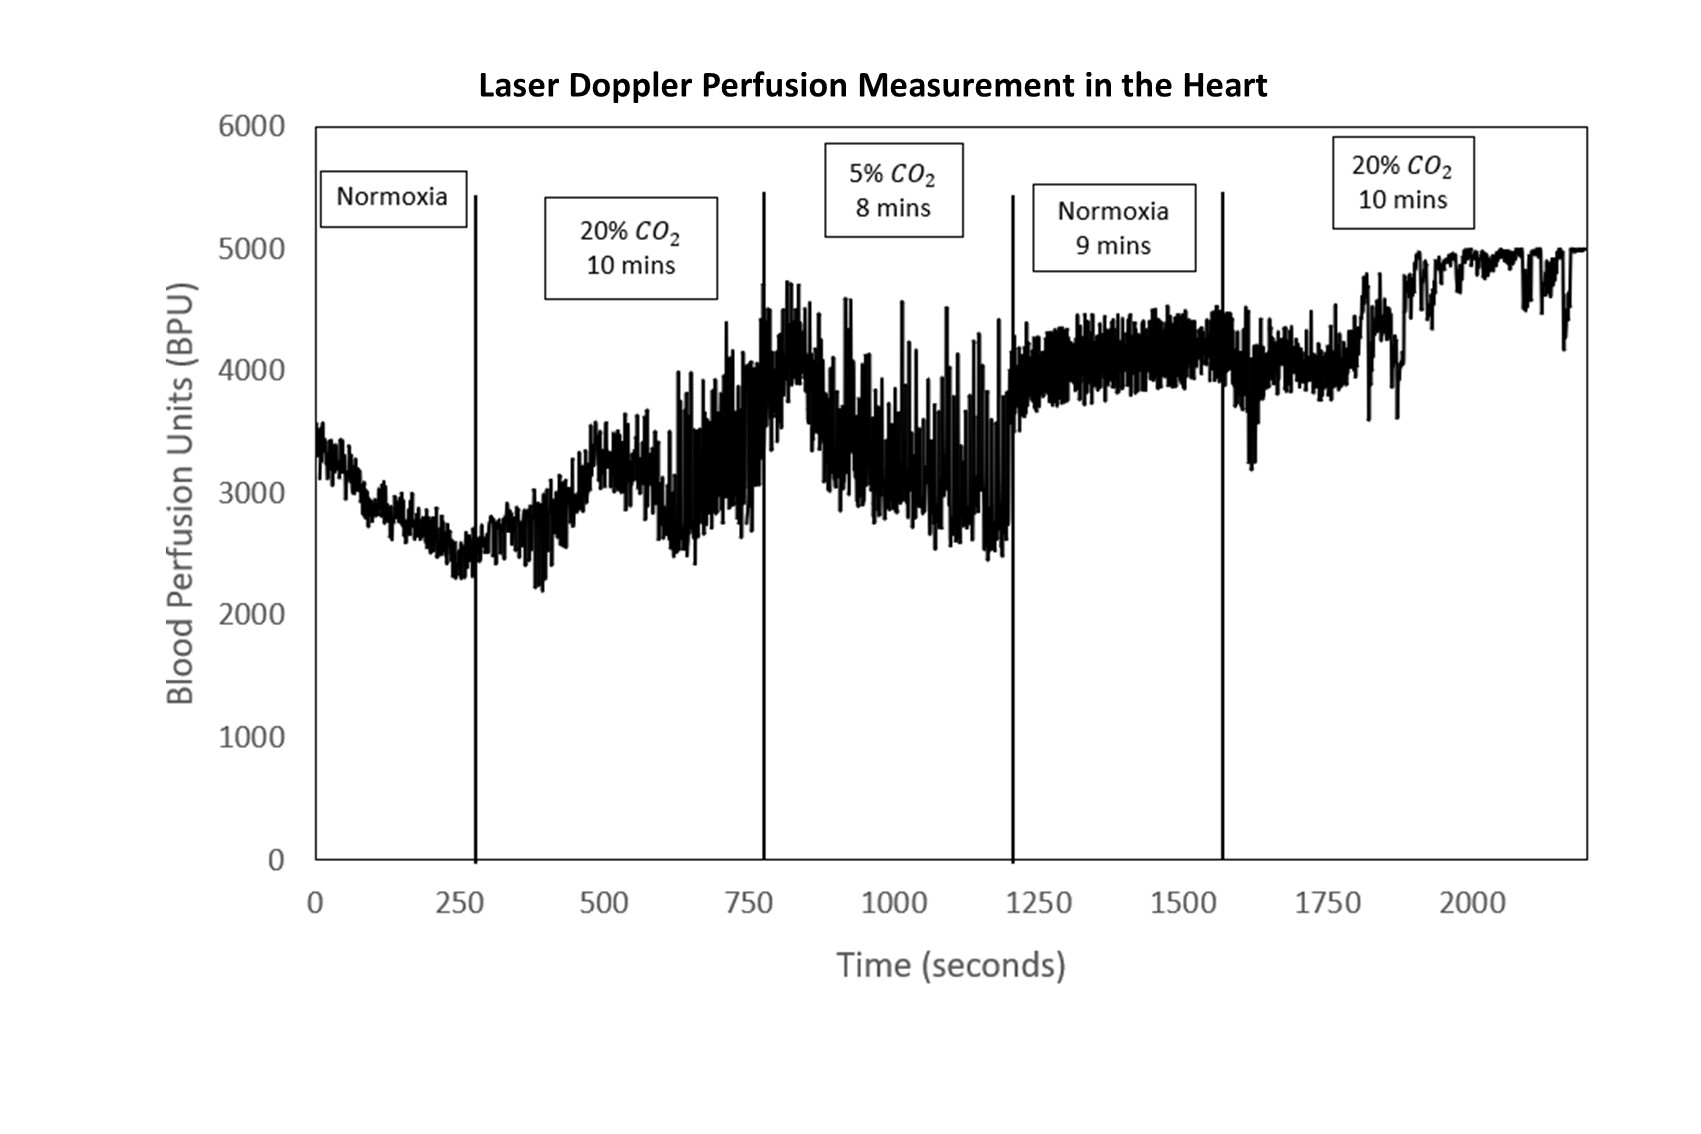
Figure 4. Laser doppler perfusion measurements performed on a healthy adult rat in the myocardium. Measurements were recorded over a span of 40 minutes while the rat underwent a series of gas stimuli with varying levels of CO2. Results are presented as arbitrary blood perfusion units (BPU).