4837
Imaging reactive oxygen species and tissue iron in ischemia-reperfusion injury in swine with multimodal [18F]ROStrace PET/CT and QSM
Sophia Swago1, Elizabeth W. Thompson1, Annefleur Loth2, Abhijit Bhattaru3, Brianna F. Moon1, Giovanni Ferrari4, Estibaliz Castillero4, Victor A. Ferrari5, Robert Gorman6, Cory Tschabrunn7, Robert Mach3, Joel Karp3, Walter R. Witschey3, and Paco Bravo3
1Department of Bioengineering, University of Pennsylvania, Philadelphia, PA, United States, 2Amsterdam Medical Centre, University of Amsterdam (AMC-UvA), Amsterdam, Netherlands, 3Department of Radiology, University of Pennsylvania, Philadelphia, PA, United States, 4Department of Surgery, Columbia University, New York City, NY, United States, 5Department of Medicine and Penn Cardiovascular Institute, University of Pennsylvania, Philadelphia, PA, United States, 6Department of Surgery, University of Pennsylvania, Philadelphia, PA, United States, 7Department of Medicine, University of Pennsylvania, Philadelphia, PA, United States
1Department of Bioengineering, University of Pennsylvania, Philadelphia, PA, United States, 2Amsterdam Medical Centre, University of Amsterdam (AMC-UvA), Amsterdam, Netherlands, 3Department of Radiology, University of Pennsylvania, Philadelphia, PA, United States, 4Department of Surgery, Columbia University, New York City, NY, United States, 5Department of Medicine and Penn Cardiovascular Institute, University of Pennsylvania, Philadelphia, PA, United States, 6Department of Surgery, University of Pennsylvania, Philadelphia, PA, United States, 7Department of Medicine, University of Pennsylvania, Philadelphia, PA, United States
Synopsis
Keywords: Myocardium, Ischemia
Additional myocardial injury can occur after reestablishing blood flow post ischemia. We use a multimodal protocol of sequential quantitative susceptibility mapping and positron emission tomography to directly image reactive oxygen species (ROS) and tissue iron in vivo in pig hearts after ischemic injury. We found that ROS was increased in infarct compared to remote regions of the myocardium in all animals. In an animal with microvascular obstruction, we observed an increase in susceptibility measured by QSM in the infarct region, indicating increased tissue iron, but no increased susceptibility was seen in the animals without microvascular obstruction.
Introduction
Injury may occur after blood flow is restored after myocardial infarction (MI), and the presence of this ischemia-reperfusion injury (IRI) is associated with adverse clinical outcomes(1). However, limited knowledge exists of the molecular underpinnings of IRI. Reactive oxygen species (ROS) have been shown to increase in cardiomyocytes 60 minutes post-ischemia-reperfusion(2). However, it is currently unknown if ROS increase post-MI in vivo, and if so, the time course and spatial distribution in the myocardium of ROS activity. Additionally, iron has a central role in ROS-induced damage, catalyzing the formation of hydrogen peroxide (H2O2) from hydroxyl radicals(3). As a result, increased tissue iron post-MI may be a biomarker of increased ROS. In this study, we demonstrate the feasibility of directly imaging cardiac tissue iron with quantitative susceptibility mapping (QSM)(4) and ROS activity with [18F]ROStrace(5) in vivo in a swine model of subacute IRI using sequential cardiac magnetic resonance (CMR) and PET/CT imaging.Methods
IRI was induced in three healthy Yorkshire Swine by occlusion of the mid- left anterior descending coronary artery for 180 minutes (N=1) or 90 minutes (N=2) using a balloon catheter, followed by restoration of flow. Three days following IRI, in vivo CMR data were collected at 1.5 T (Avanto, Siemens Healthcare, Erlangen, Germany). ECG-gated late gadolinium enhancement (LGE) imaging was performed using a phase-sensitive inversion recovery (PSIR) segmented gradient echo sequence, and QSM data (N=2) were collected using a multi-echo gradient-echo image acquisition at 1.25 x 1.25 x 3 mm3 resolution (TR/TEfirst /TElast / ΔTE=161/3.8/14.6/2.7 ms, FA=13 degrees, FOV=172×240 mm , BW=400 Hz/pixel).Swine were then imaged the same day on the PennPET Explorer using a multitracer protocol that included 82-Rubidium [82Rb] and [18F]ROStrace administered sequentially via IV bolus. Then, 3-dimensional list-mode scans were acquired for 8 and 60 minutes to measure myocardial blood flow (MBF) and in vivo ROS activity respectively.
LGE and PET images were co-registered using MIM 7.1.5. Regions of interest (ROIs) were drawn on LGE images in remote myocardium, infarcted myocardium, and blood pool. Time-activity curves were generated from each ROI and ROStrace fractional uptake rate (FUR [s-1]) was calculated:
$$FUR=\frac{C_{T}(t)}{\int_{0}^{t}C_{a}(t)dt}$$
where $$$C_{T}(t)$$$ is the tracer concentration in the tissue at time=t, measured at equilibrium, and $$$\int_{0}^{t}C_{a}(t)dt$$$ is the arterial input function. ROStrace FUR was corrected for MBF (ml/min/g) using a simple flow model(6) for 82Rb. Infarct size and microvascular obstruction (MVO) size were quantified using QMass 8.1 (Medis Suite 4.0).
QSM images were reconstructed using the morphology-enabled dipole inversion image processing (MEDI) pipeline(7,8). In brief, this pipeline involves unwrapping of the multi-echo GRE phase images, removal of the background field, and solving the local field dipole inversion problem using linear least-squares minimization. As for the LGE images, ROIs were drawn in the remote and infarcted myocardium. The mean and standard deviation of magnetic susceptibility (Δχ) was determined for each ROI.
Results
Registered LGE and PET images are shown in Figure 1. Time activity curves (Fig. 2) show the uptake in regions of infarct, remote myocardium, and the blood pool in a single animal. MBF-corrected ROStrace FUR in the infarct ranged from 0.24 to 0.32 ml/g and in remote myocardium ranged from 0.09 to 0.17 ml/g (Fig. 3). Infarct size (% myocardium) measured on LGE ranged from 16.7 to 21.7 and MVO area (% myocardium) ranged in two animals from 2.94 to 3.91. Across all three animals, ROS activity showed a trend of increase in the infarcted compared to remote myocardium. In two animals with 90-minute infarction, one with MVO and one without MVO, in vivo QSM was performed (Fig. 4). In the animal with 2.94% MVO, Δχ was 0.13±0.11 ppm in the infarct and -0.01±0.02 ppm in remote myocardium. In the animal without MVO, Δχ was -0.06±0.04 ppm in the infarct and -0.02±0.02 ppm in remote myocardium (Fig. 5).Discussion and Conclusion
We observed increased ROS activity in vivo in the infarcted myocardium of all three animals using the PET tracer [18F]ROStrace, in agreement with in situ findings of increased ROS in cardiomyocytes post-ischemia. Additionally, we found increased susceptibility in the infarct of an animal with an hypointense infarct core, indicative of MVO and hemorrhagic infarct. For the first time, we utilized a comprehensive and complementary protocol using sequential CMR and PET to measure ROS activity and tissue iron in infarcted and remote myocardium in a swine model of subacute ischemia-reperfusion injury.Acknowledgements
We gratefully appreciate support from the National Heart, Lung, and Blood Institute of the National Institutes of Health under award numbers R01HL137984 and F31HL158217.References
- Husser O, Monmeneu JV, Sanchis J, Nunez J, Lopez-Lereu MP, Bonanad C, Chaustre F, Gomez C, Bosch MJ, Hinarejos R. Cardiovascular magnetic resonance-derived intramyocardial hemorrhage after STEMI: influence on long-term prognosis, adverse left ventricular remodeling and relationship with microvascular obstruction. International journal of cardiology 2013;167(5):2047-2054.
- Becker LB, vanden Hoek TL, Shao Z-H, Li C-Q, Schumacker PT. Generation of superoxide in cardiomyocytes during ischemia before reperfusion. American Journal of Physiology-Heart and Circulatory Physiology 1999;277(6):H2240-H2246.
- Becker LB. New concepts in reactive oxygen species and cardiovascular reperfusion physiology. Cardiovascular research 2004;61(3):461-470.
- Moon BF, Iyer SK, Hwuang E, Solomon MP, Hall AT, Kumar R, Josselyn NJ, Higbee-Dempsey EM, Tsourkas A, Imai A. Iron imaging in myocardial infarction reperfusion injury. Nature communications 2020;11(1):1-14.
- Chu W, Chepetan A, Zhou D, Shoghi KI, Xu J, Dugan LL, Gropler RJ, Mintun MA, Mach RH. Development of a PET radiotracer for non-invasive imaging of the reactive oxygen species, superoxide, in vivo. Organic & biomolecular chemistry 2014;12(25):4421-4431.
- Yoshida K, Mullani N, Gould KL. Coronary flow and flow reserve by PET simplified for clinical applications using rubidium-82 or nitrogen-13-ammonia. Journal of Nuclear Medicine 1996;37(10):1701-1712.
- Liu J, Liu T, de Rochefort L, Ledoux J, Khalidov I, Chen W, Tsiouris AJ, Wisnieff C, Spincemaille P, Prince MR. Morphology enabled dipole inversion for quantitative susceptibility mapping using structural consistency between the magnitude image and the susceptibility map. Neuroimage 2012;59(3):2560-2568.
- Liu T, Liu J, De Rochefort L, Spincemaille P, Khalidov I, Ledoux JR, Wang Y. Morphology enabled dipole inversion (MEDI) from a single‐angle acquisition: comparison with COSMOS in human brain imaging. Magnetic resonance in medicine 2011;66(3):777-783.
Figures
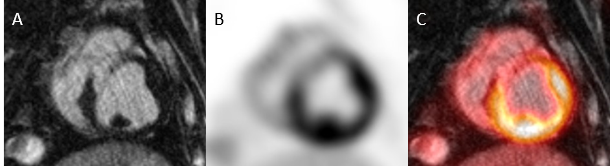
Figure 2. Representative 82-Rb (left) and ROStrace (right) time-activity-curves (TAC) from a single subject in infarct (top) and remote (bottom) regions of the myocardium. Though absolute time-activity is decreased due to reduced myocardial blood flow, corrected [18F]ROStrace activity is greater in the infarct region.
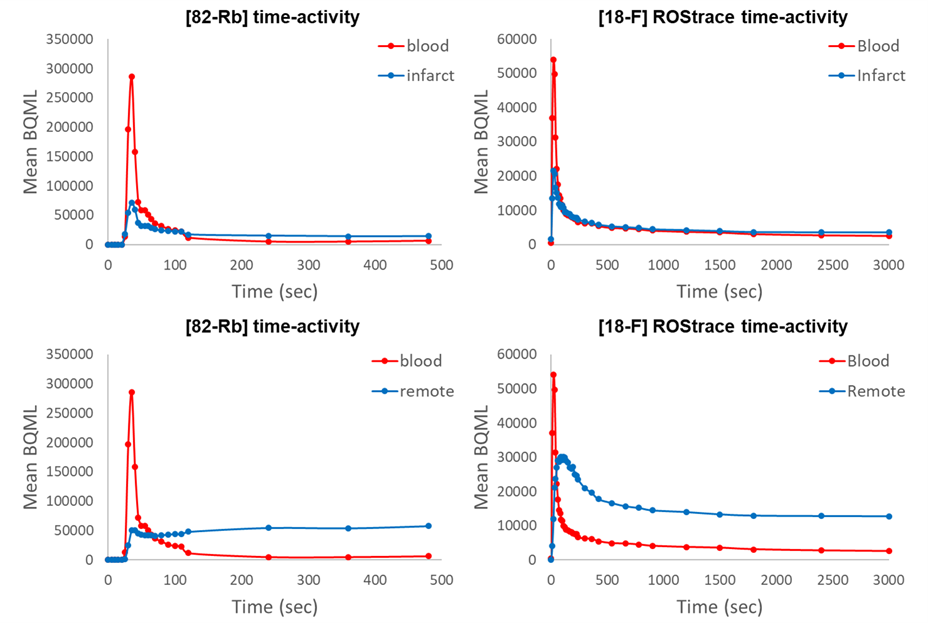
Figure 2. Representative 82-Rb (left) and ROStrace (right) time-activity-curves (TAC) from a single subject in infarct (top) and remote (bottom) regions of the myocardium. Though absolute time-activity is lower due to reduced myocardial blood flow, corrected [18F]ROStrace activity is higher in the infarct region.
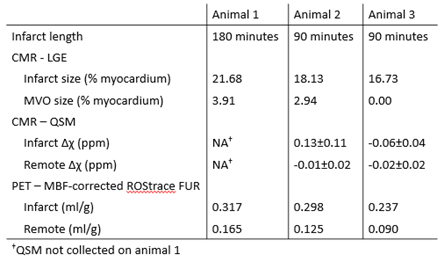
Figure 3. Reported infarct and MVO size determined from LGE CMR and ROStrace FUR in infarct and remote regions of myocardium. Tissue susceptibility Δχ was measured in two animals in infarct and remote regions.
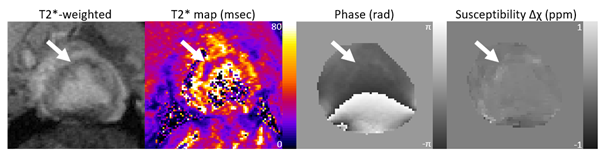
Figure 4. The T2*-weighted magnitude and corresponding phase images. T2* map shows a hypointense infarct core, and the QSM image shows hyperintensity in this region.
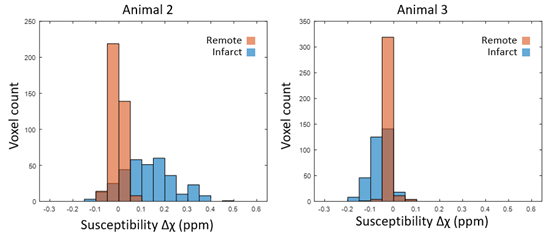
Figure 5. Histogram of susceptibility in the infarct and remote ROIs of an animal with MVO (left) and without MVO (right). The relative count is normalized to the total number of voxels in each ROI.
DOI: https://doi.org/10.58530/2023/4837