4835
Non-enhanced Multi-contrast 3D Whole-heart MRI for Assessment of Reperfusion Injury in Patients with Acute Myocardial Infarction1Radiology, Beijing Chaoyang Hospital, Beijing, China, 2Siemens Shenzhen Magnetic Resonance Ltd., Shenzhen, China, 3China MR Scientific Marketing, Siemens Healthineers, Beijing, China, 4MR Research Collaborations, Siemens Healthcare Limited, Camberley, United Kingdom, 5School of Biomedical Engineering and Imaging Sciences, King's College London, London, United Kingdom
Synopsis
Keywords: Myocardium, Myocardium
Bright- and black-blood MRI sequences provide multi-contrast information for myocardial assessment in patients with acute ST-segment-elevation myocardial infarction (STEMI). A free-breathing 3D whole-heart bright-blood and black-blood phase sensitive (BOOST) inversion recovery sequence has been recently proposed for a simultaneous multi-contrast high-quality depiction of cardiac and vascular structures without contrast agent injection. In this study, we applied this sequence to visualize reperfusion injury in 10 patients with STEMI. Good agreement in microvascular obstruction (MVO) and intramyocardial hemorrhage (IMH) visualization was observed between the proposed approach and traditional 2D imaging methods in patients, promising potential integration into clinical treatment workflow.Early reperfusion therapy is currently the standard treatment for patients with acute ST-segment-elevation myocardial infarction (STEMI)[1]. However, in some cases, the benefits of reperfusion therapy may be paradoxically induced due to myocardial reperfusion injury[2]. Myocardial reperfusion injury is associated with poor left ventricular (LV) remodeling and major cardiovascular events[3-5]. Myocardial reperfusion injury is mainly manifested by microvascular obstruction (MVO) and intramyocardial hemorrhage (IMH)[6]. Yet, there is no clear understanding of the detection and clinical significance of myocardial hemorrhage and its relationships to microvascular obstruction. Simultaneous evaluation and fusion registration analysis of MVO and IMH is particularly important for studying the mechanism of myocardial reperfusion injury. However, currently available techniques such as T2* mapping and late gadolinium enhancement still suffer from some limitations, such as insufficient coverage, low spatial resolution, and the need to acquire data on multiple breath-holds. Recently, a 3D whole-heart bright-blood and black-blood phase sensitive (iT2Prep- BOOST) sequence has been developed and applied at 1.5T for non-contrast enhanced simultaneous thrombus/hemorrhage detection[7]. In this study, we aim to explore the potential of BOOST for simultaneous non-contrast enhanced MVO and IMH visualization in clinical applications at 3T.
Method
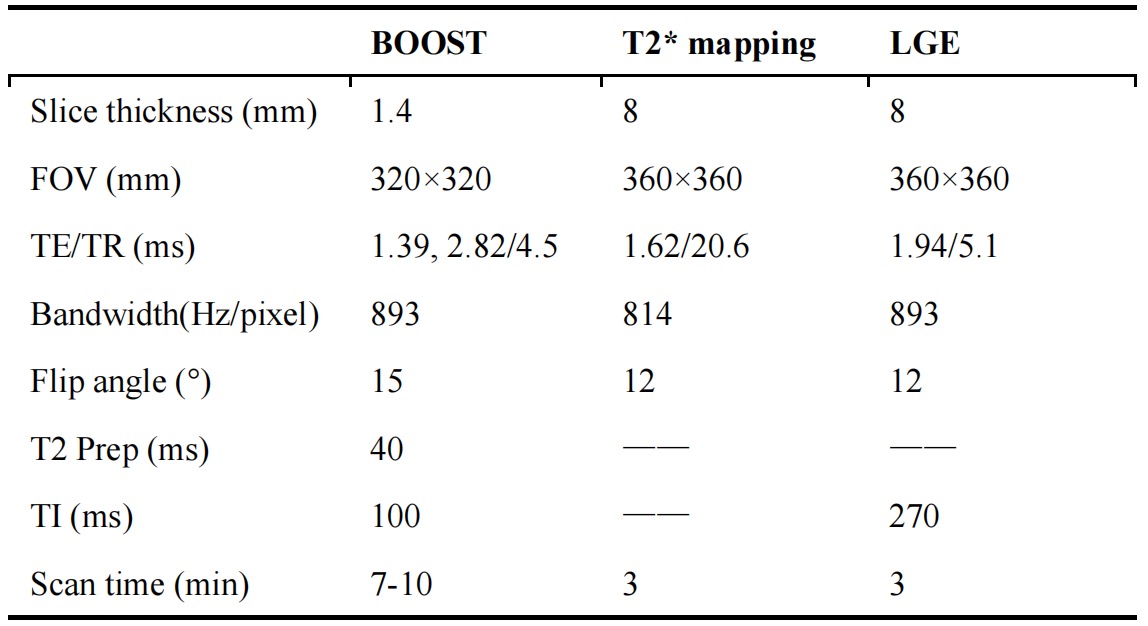
This study employed a previously published 3D whole-heart, electrocardiogram-triggered, 2-heart beat research sequence (iT2Prep-BOOST) with a variable-density Cartesian spiral profile order trajectory (VD-CASPR) and 2D image-based navigators (iNAV) enabling 100% respiratory scan efficiency, combined with GRE-Dixon imaging for use at 3T[7]. The acquired datasets were: 1st heart beat: bright-blood T2-prepared Inversion Recovery (T2prep-IR), second heart beat: no preparation. A black-blood image was created via subtraction of the 1st and 2nd heart beat water images after Dixon-based fat water separation.Ten patients (10 men, age: 48-70 years) with first STEMI who underwent successful percutaneous coronary intervention (PCI) were prospectively enrolled and examined with cardiac magnetic resonance (CMR) within seven days after PCI. The study was approved by our Institutional Review Board, and all patients provided written informed consent. CMR was performed on a 3T scanner (MAGNETOM Prisma, Siemens Healthcare, Erlangen, Germany), including 3D whole-heart iT2prep-BOOST (GRE acquisition), T2* mapping, LGE sequences, T1WI, and T2 STIR. The parameter information of the main CMR protocols used is listed in Table 1. The size of IMH and MVO were measured by post-processing software. All 2D image analyses were performed with cvi42 (Circle Cardiovascular Imaging, Calgary, Alberta, Canada). 3D whole-heart iT2prep-BOOST image analysis was performed using 3D-Slicer software[8]. Qualitative (image quality 1-4 score) and quantitative (MVO and IMH sizes) analyses were performed.
Results
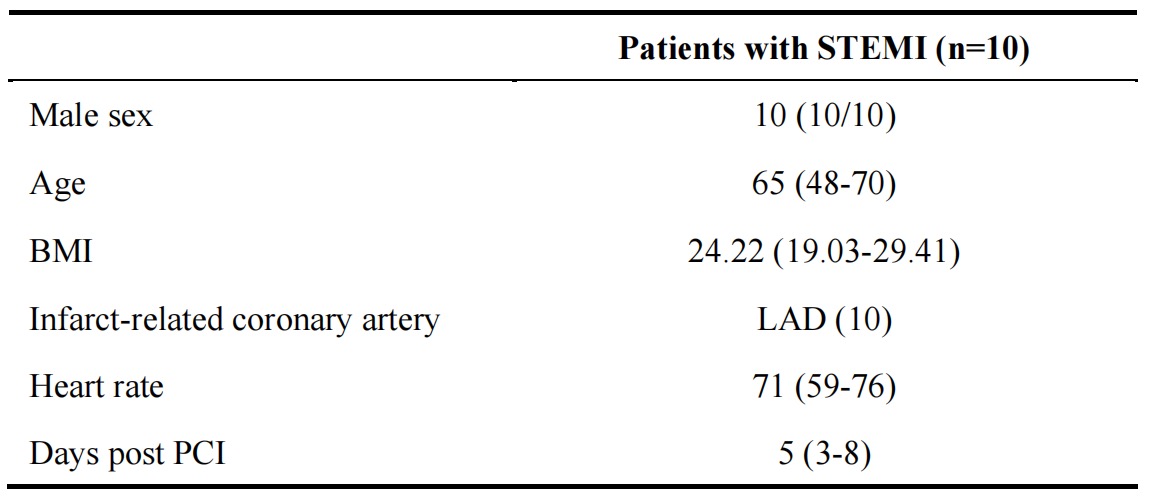
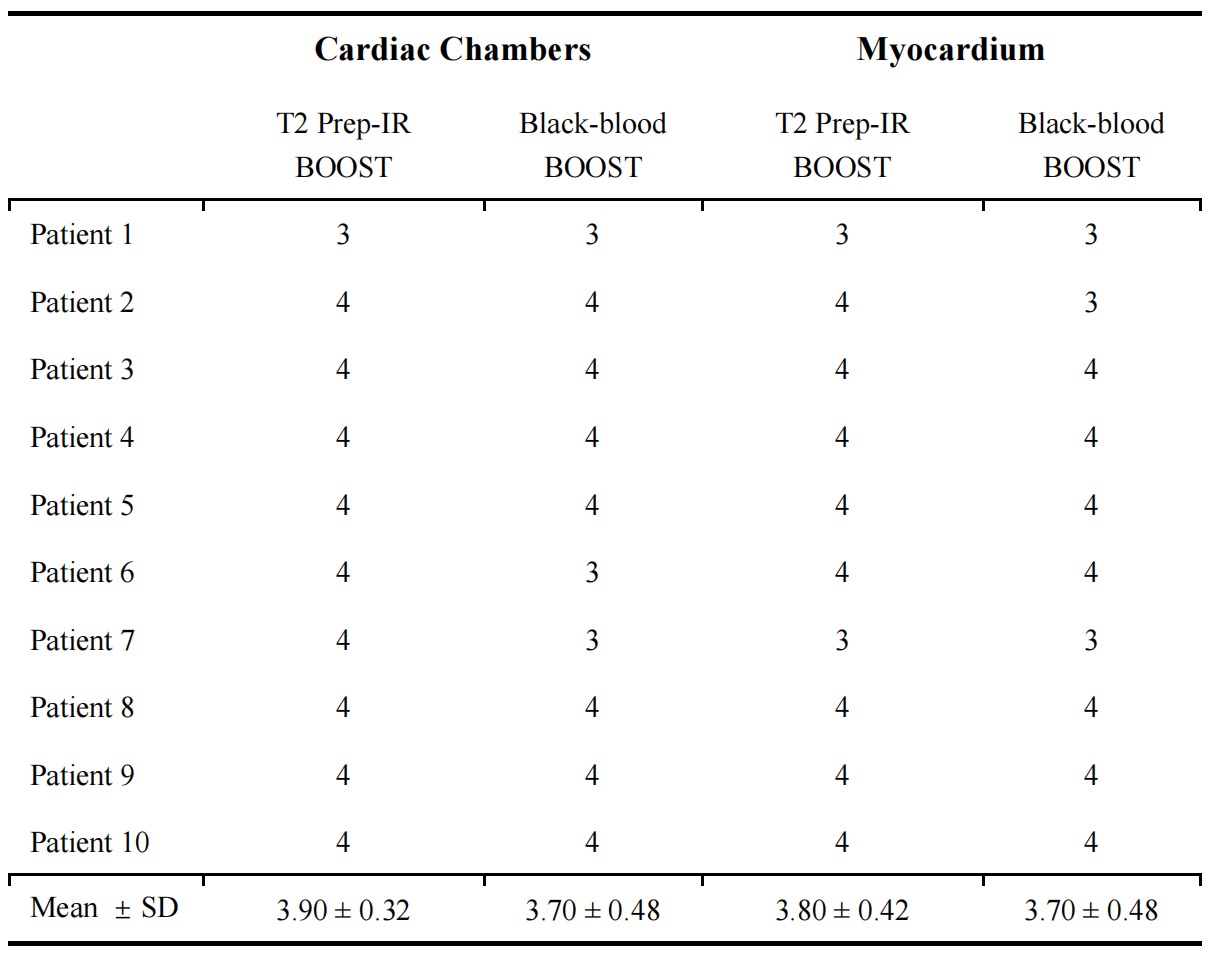
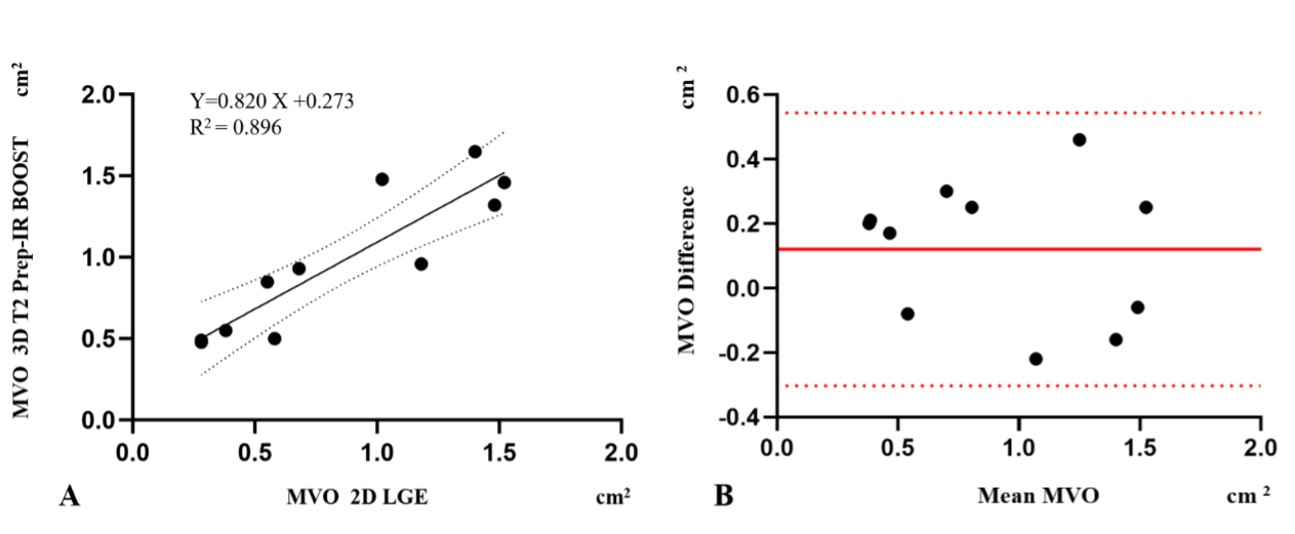
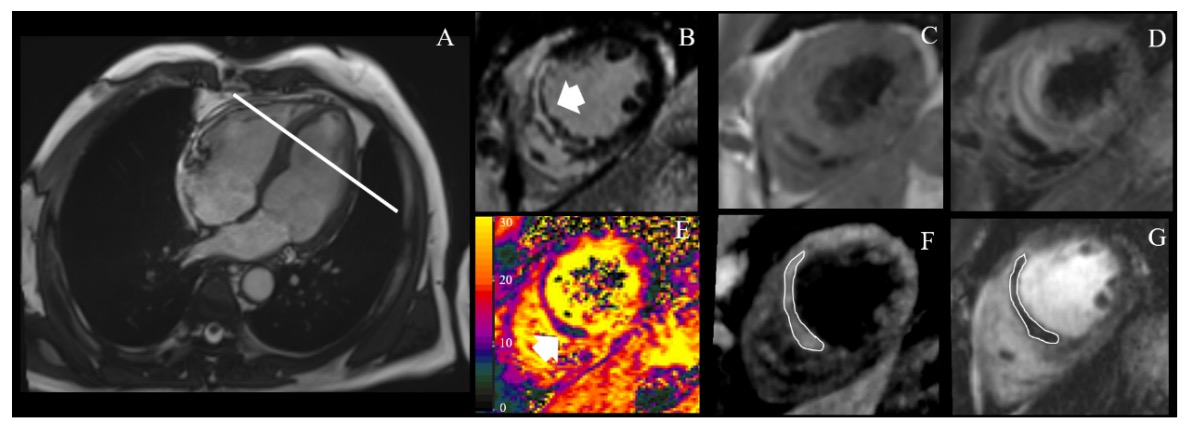
Ten patients with STEMI referred for emergency PCI underwent CMR. The patient characteristics are shown in Table 2. A total of 40 3D image sets were scored for image quality. For the cardiac chambers and myocardium T2 Prep-IR bright-blood and black-blood BOOST images were evaluated separately (Table 3).MVO was found at 11 levels (11/99) on the 2D short-axis LGE images of 4 STEMI patients. MVO was also observed on the corresponding 3D T2 Prep-IR BOOST sequence. The MVO area on 3D T2 Prep-IR BOOST was slightly larger than that of conventional LGE (0.97 cm2 vs. 0.85 cm2 p = 0.507). However, there was a strong correlation (Regression line: Y=0.820 X + 0.273; R2 = 0.896, p < 0.001) (Figure 1). Good agreement in MVO visualization was observed between the 3D T2 Prep-IR BOOST sequence and traditional 2D LGE in patients. IMH was found at three levels (3/30) on the 2D short-axis T2* mapping of 3 STEMI patients. IMH was also observed on corresponding 3D black-blood BOOST sequences. Good agreement in the visualization of IMH was observed between the 3D black-blood BOOST sequence and traditional 2D T2* mapping in patients. However, the sample size of IMH needs to be expanded for further statistical verification. Figure 2 shows a representative case.
Discussion and Conclusion
The iT2prep-BOOST sequence provided non-enhanced, multi-contrast 3D whole-heart visualization of the IMH and MVO in patients with STEMI at 3T. Firstly, conventional 2D T2* mapping and LGE images were acquired over multiple breath holds in single image orientations to visualize and quantify IMH and MVO. However, this approach is limited by the need for multiple breath-holds, image misalignment, and anisotropic resolution. A good agreement in the visualization of IMH and MVO was observed between the proposed 3D multi-contrast whole-heart approach and traditional 2D imaging methods in patients. Secondly, in images acquired by T2*-weighted magnetic resonance sequences, the regional signal intensity drops in IMH tissue because of altered molecular magnetic properties of hemoglobin degradation products. However, IMH co-occurs with edema, which significantly changes T2-relaxation resulting in increased T2 values using cardiac relaxometry. Given that T2* values are T2-dependent, the intensity of edema is predicted to impair the ability of T2* to detect IMH. The iT2prep-BOOST sequence (GRE) is sensitive to both T2/T2* (first heart beat) and T1 (second heart beat), thus more myocardial edema may lead to greater signal difference between reperfusion injury lesions and remote myocardial tissue. Future work will investigate improvements in spatial resolution to improve IMH and MVO visualization in a larger cohort of patients. Here, iT2prep-BOOST may obviate the need for gadolinium-based contrast agents in this patient group and may benefit clinical practice.
Acknowledgements
No acknowledgement.References
References
[1] Cannon CP, Gibson CM, Lambrew CT, Shoultz DA, Levy D, French WJ, et al. (2000) Relationship of symptom-onset-to-balloon time and door-to-balloon time with mortality in patients undergoing angioplasty for acute myocardial infarction. Jama 283(22):2941-7. https://doi.org/10.1001/jama.283.22.2941
[2] Yellon DM, Hausenloy DJ (2007) Myocardial reperfusion injury. N Engl J Med 357(11):1121-35. https://doi.org/10.1056/NEJMra071667
[3] Bekkers SC, Smulders MW, Passos VL, Leiner T, Waltenberger J, Gorgels AP, et al. (2010) Clinical implications of microvascular obstruction and intramyocardial haemorrhage in acute myocardial infarction using cardiovascular magnetic resonance imaging. Eur Radiol 20(11):2572-8. https://doi.org/10.1007/s00330-010-1849-9
[4] Kandler D, Lücke C, Grothoff M, Andres C, Lehmkuhl L, Nitzsche S, et al. (2014) The relation between hypointense core, microvascular obstruction and intramyocardial haemorrhage in acute reperfused myocardial infarction assessed by cardiac magnetic resonance imaging. Eur Radiol 24(12):3277-88. https://doi.org/10.1007/s00330-014-3318-3
[5] Symons R, Masci PG, Goetschalckx K, Doulaptsis K, Janssens S, Bogaert J (2015) Effect of infarct severity on regional and global left ventricular remodeling in patients with successfully reperfused ST segment elevation myocardial infarction. Radiology 274(1):93-102. https://doi.org/10.1148/radiol.14132746
[6] Higginson LA, White F, Heggtveit HA, Sanders TM, Bloor CM, Covell JW (1982) Determinants of myocardial hemorrhage after coronary reperfusion in the anesthetized dog. Circulation 65(1):62-9. https://doi.org/10.1161/01.cir.65.1.62
[7] Milotta G, Ginami G, Cruz G, Neji R, Prieto C, Botnar RM (2019) Simultaneous 3D whole-heart bright-blood and black blood imaging for cardiovascular anatomy and wall assessment with interleaved T(2) prep-IR. Magn Reson Med 82(1):312-325. https://doi.org/10.1002/mrm.27734
[8] Fedorov A, Beichel R, Kalpathy-Cramer J, Finet J, Fillion-Robin JC, Pujol S, et al. (2012) 3D Slicer as an image computing platform for the Quantitative Imaging Network. Magn Reson Imaging 30(9):1323-41. https://doi.org/10.1016/j.mri.2012.05.001
Figures