4831
Radiomics of non-contrast bSSFP cine short axis images performs better with end-systolic images in distinguishing infarct and control subjects
Tom Dresselaers1,2, Baptiste Vande Berg1, Sofie Tilborghs3,4, Alexandru Cernicanu5, and Jan Bogaert1,2
1Radiology, UZ Leuven, Leuven, Belgium, 2Dept. of Imaging and Pathology, KU Leuven, Leuven, Belgium, 3Department of Electrical Engineering (ESAT), KU Leuven, Leuven, Belgium, 4Medical Imaging Research Center, UZ Leuven, Leuven, Belgium, 5Philips Benelux, Eindhoven, Netherlands
1Radiology, UZ Leuven, Leuven, Belgium, 2Dept. of Imaging and Pathology, KU Leuven, Leuven, Belgium, 3Department of Electrical Engineering (ESAT), KU Leuven, Leuven, Belgium, 4Medical Imaging Research Center, UZ Leuven, Leuven, Belgium, 5Philips Benelux, Eindhoven, Netherlands
Synopsis
Keywords: Heart, Radiomics
Several studies suggest that radiomics of non-contrast cine balanced steady-state free precession (bSSFP) images allows to detect myocardial infarct patients. Relevant radiomic features vary however without clear knowledge of the underlying causes. Most studies rely on time consuming manual contouring on use end-diastolic images while it was shown that features vary through the heart cycle. In this study we show that radiomics of end-systolic images result in a higher classification accuracy than for end-diastolic images and produce the same result when relying on commercial automated contouring.Introduction
Recently, the diagnostic potential of radiomics of non-contrast cine balanced steady-state free precession (bSSFP) cardiac magnetic resonance (CMR) images has been shown. In particular, the association of radiomics texture features with acute and chronic myocardial infarction (MI)1-6 and presence of microvascular obstruction7 was demonstrated. Most of these studies utilized end-diastolic images to train the classification model. Cine bssfp radiomic features vary however substantially throughout the cardiac cycle in healthy subjects8. In addition, automated contouring is important in a clinical workflow but the reliability of commercial automated segmentation tools require further evaluation. Our first goal was therefore to confirm the feasibility of distinguishing infarct patients from healthy subjects based on a radiomics analysis of standard clinical non-contrast mid short axis (SAX) bSSFP cine images typically acquired during the initial part of a CMR examination and compare most relevant features with previously reported radiomics models. Secondly, compare classification models trained using end-systole radiomics features with end-diastole features. Thirdly, evaluate results derived from automated contouring using commercial software with manually corrected contours.Methods
Non-contrast midventricular single slice SAX bSSFP images of 99 consecutive ST-segment elevation acute MI patients and 49 control subjects were used. In 83 patients (84%) the SAX covered the infarcted myocardium as visualized at late gadolinium-enhanced CMR. Images were recorded at 1.5T (Ingenia, Philips) using following parameters: TR=3.7ms, TE=1.7ms, flip angle=60°, accel. fact. 2, matrix 160 × 256; FOV 300 mm, pixel size 1.6×1.6mm; slice thickness 8mm, 30 phases). End diastolic (ED) and end systolic (ES) SAX frames were first automatically segmented (Neosoft suiteHEART®). Next, an in-house tool (matlab R2019) was used to further exclude residual blood pool pixels (threshold: mean left ventricular blood pool signal intensity – 1SD). Then, a radiologist blinded to patient type manually corrected masks when required (3D Slicer9) and scored cine images for presence of an infarct. Next, radiomic feature extraction was perfomed using PyRadiomics10 (no prior filters; 25 bins). The dataset was then split in a train, validate and test set (50, 25 and 25%, resp.). Next, the top three features were selected using a fast correlation based filter (entropy-based measure, which also identifies redundancy due to pairwise correlations between features). Further selection was based on optimal classification results (train/validate set) using a support vector machine approach (Orange vs3.32; linear kernel, cost =1 regression loss epsilon 0.1) applied to the normalized feature values (µ=0 , σ=1). Finally, classification accuracy (CA) was assessed on the test data. Pearson correlation coefficients were calculated between ED and ES features and for the automated vs manually corrected contours.Results
The three top ranked features for manually contoured ES cine images, RunLengthNonUniformity, ClusterShade and Median, resulted in a high classification accuracy of 85% on the test dataset (Fig 2). For manually contoured ED cine images the top features were RunLengthNonUniformity, Correlation and Skewness which resulted in a lower CA than the ES model (CA= 77%). As a reference, the CA of a visual analysis by a radiologist of the ED and ES images was respectively 65% and 78%. Using the automated ES myocardial masks as input for the radiomics analysis did not reduce the classification accuracy and had one identical feature, ClusterShade, and two different features, SizeZoneNonUniformity and RootMeanSquared (RMS). Both were however strongly correlated with the top features from the model based on the manually contoured myocardium (SizeZoneNonUniformity vs. RunLengthNonUniformity r=0.874; RMS vs. Median:r=0.973 ). In general, correlation between features derived from automated and manual ES contours was good (40/96 ES features had CC >0.9; figure 3). For the ED images automated contours resulted in a worse performance (CA= 72%). In general, ED and ES features were poorly correlated with few exception such as RunLengthNonUniformity (Fig. 4).Discussion
The most relevant feature to distinguish infarct from healthy subjects was RunLengthNonUniformity. This feature was previously reported to be important in characterizing the impact of smoking10 and in differentiation of hypertrophic cardiomyopathy form controls11. Median was also reported to be an important discriminator in diabetes suggesting a global alteration of the myocardial tissue10. A study including only non-acute MI patients reported first order 10perc and variance features to be relevant using ED cine images. In our study on acute MI none of the top feature were correlated with these features (r<0.2) which may be due to the presence of edema. It is yet unclear if partial volume effects, likely to be more relevant in ED than ES, explain the lower CA based on ED feature. Automated contouring at ED resulted in a lower CA vs. manual ED contours, which was not the case at ES. This suggests that ED based radiomics are more sensitive to these partial volumes effects. The reliability of automated contours for radiomics applications needs further validation on a full SAX ES stack of images.Conclusion
Detection of acute MI using radiomics features of non-contrast mid ventricular SAX cine images is feasible and more robust relying on ES than ED images. Automated contouring did not influence the performance of the radiomics model at ES for a mid ventricular slice but needs further evaluation on a full SAX stack.Acknowledgements
No acknowledgement found.References
- Larroza A, López-Lereu MP, Monmeneu JV, et al. Texture analysis of cardiac cine magnetic resonance imaging to detect nonviable segments in patients with chronic myocardial infarction. Med Phys. 2018;45(4):1471-1480. doi:10.1002/mp.12783
- Larroza A, Materka A, López-Lereu MP, Monmeneu JV, Bodí V, Moratal D. Differentiation between acute and chronic myocardial infarction by means of texture analysis of late gadolinium enhancement and cine cardiac magnetic resonance imaging. Eur J Radiol. 2017;92:78-83. doi:10.1016/j.ejrad.2017.04.024.
- Nan Zhang, Guang Yang, Zhifan Gao, Chenchu Xu, Yanping Zhang, Rui Shi, Jennifer Keegan, Lei Xu, Heye Zhang, Zhanming Fan, and David Firmin; Deep Learning for Diagnosis of Chronic Myocardial Infarction on Nonenhanced Cardiac Cine MRI. Radiology 2019 291:3, 606-617.
- Rauseo E, Izquierdo Morcillo C, Raisi-Estabragh Z, et al. New Imaging Signatures of Cardiac Alterations in Ischaemic Heart Disease and Cerebrovascular Disease Using CMR Radiomics. Front Cardiovasc Med. 2021;8:716577. Published 2021 Sep 23. doi:10.3389/fcvm.2021.716577
- Avard E, Shiri I, Hajianfar G, et al. Non-contrast Cine Cardiac Magnetic Resonance image radiomics features and machine learning algorithms for myocardial infarction detection. Comput Biol Med. 2022;141:105145. doi:10.1016/j.compbiomed.2021.105145
- Baessler B, Mannil M, Oebel S, Maintz D, Alkadhi H, Manka R. Subacute and Chronic Left Ventricular Myocardial Scar: Accuracy of Texture Analysis on Nonenhanced Cine MR Images. Radiology. 2018;286(1):103-112. doi:10.1148/radiol.2017170213
- Peng Y, Wu K, Wang YXJ, Gong J. Association between cine CMR-based radiomics signature and microvascular obstruction in patients with ST-segment elevation myocardial infarction. J Thorac Dis. 2022;14(4):969-978. doi:10.21037/jtd-21-1706
- Alis, D., Yergin, M., Asmakutlu, O. et al. The influence of cardiac motion on radiomics features: radiomics features of non-enhanced CMR cine images greatly vary through the cardiac cycle. Eur Radiol 31, 2706–2715 (2021). https://doi.org/10.1007/s00330-020-07370-y
- 3D Slicer as an image computing platform for the Quantitative Imaging Network. Fedorov A, Beichel R, Kalpathy-Cramer J, et al. Magn Reson Imaging. 2012;30:1323–1341. (12) van Griethuysen JJM, Fedorov A, Parmar C, et al. Computational radiomics system to decode the radiographic phenotype. Cancer Res 2017;77(21):e104–e107.
- Cetin I, Raisi-Estabragh Z, Petersen SE, et al. Radiomics Signatures of Cardiovascular Risk Factors in Cardiac MRI: Results From the UK Biobank. Front Cardiovasc Med. 2020;7:591368. Published 2020 Nov 2. doi:10.3389/fcvm.2020.591368
- Baeßler B, Mannil M, Maintz D, Alkadhi H, Manka R. Texture analysis and machine learning of non-contrast T1-weighted MR images in patients with hypertrophic cardiomyopathy-Preliminary results. Eur J Radiol. 2018;102:61-67. doi:10.1016/j.ejrad.2018.03.013
Figures
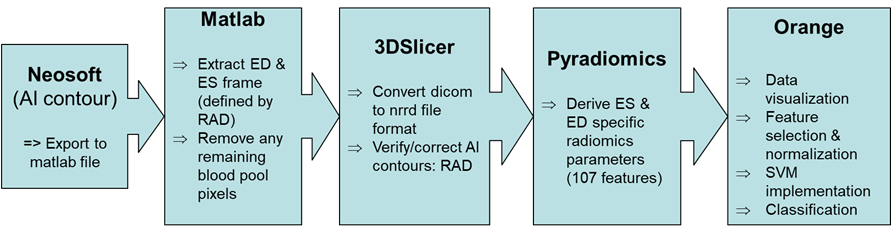
Figure 1: Overview
of the image processing workflow
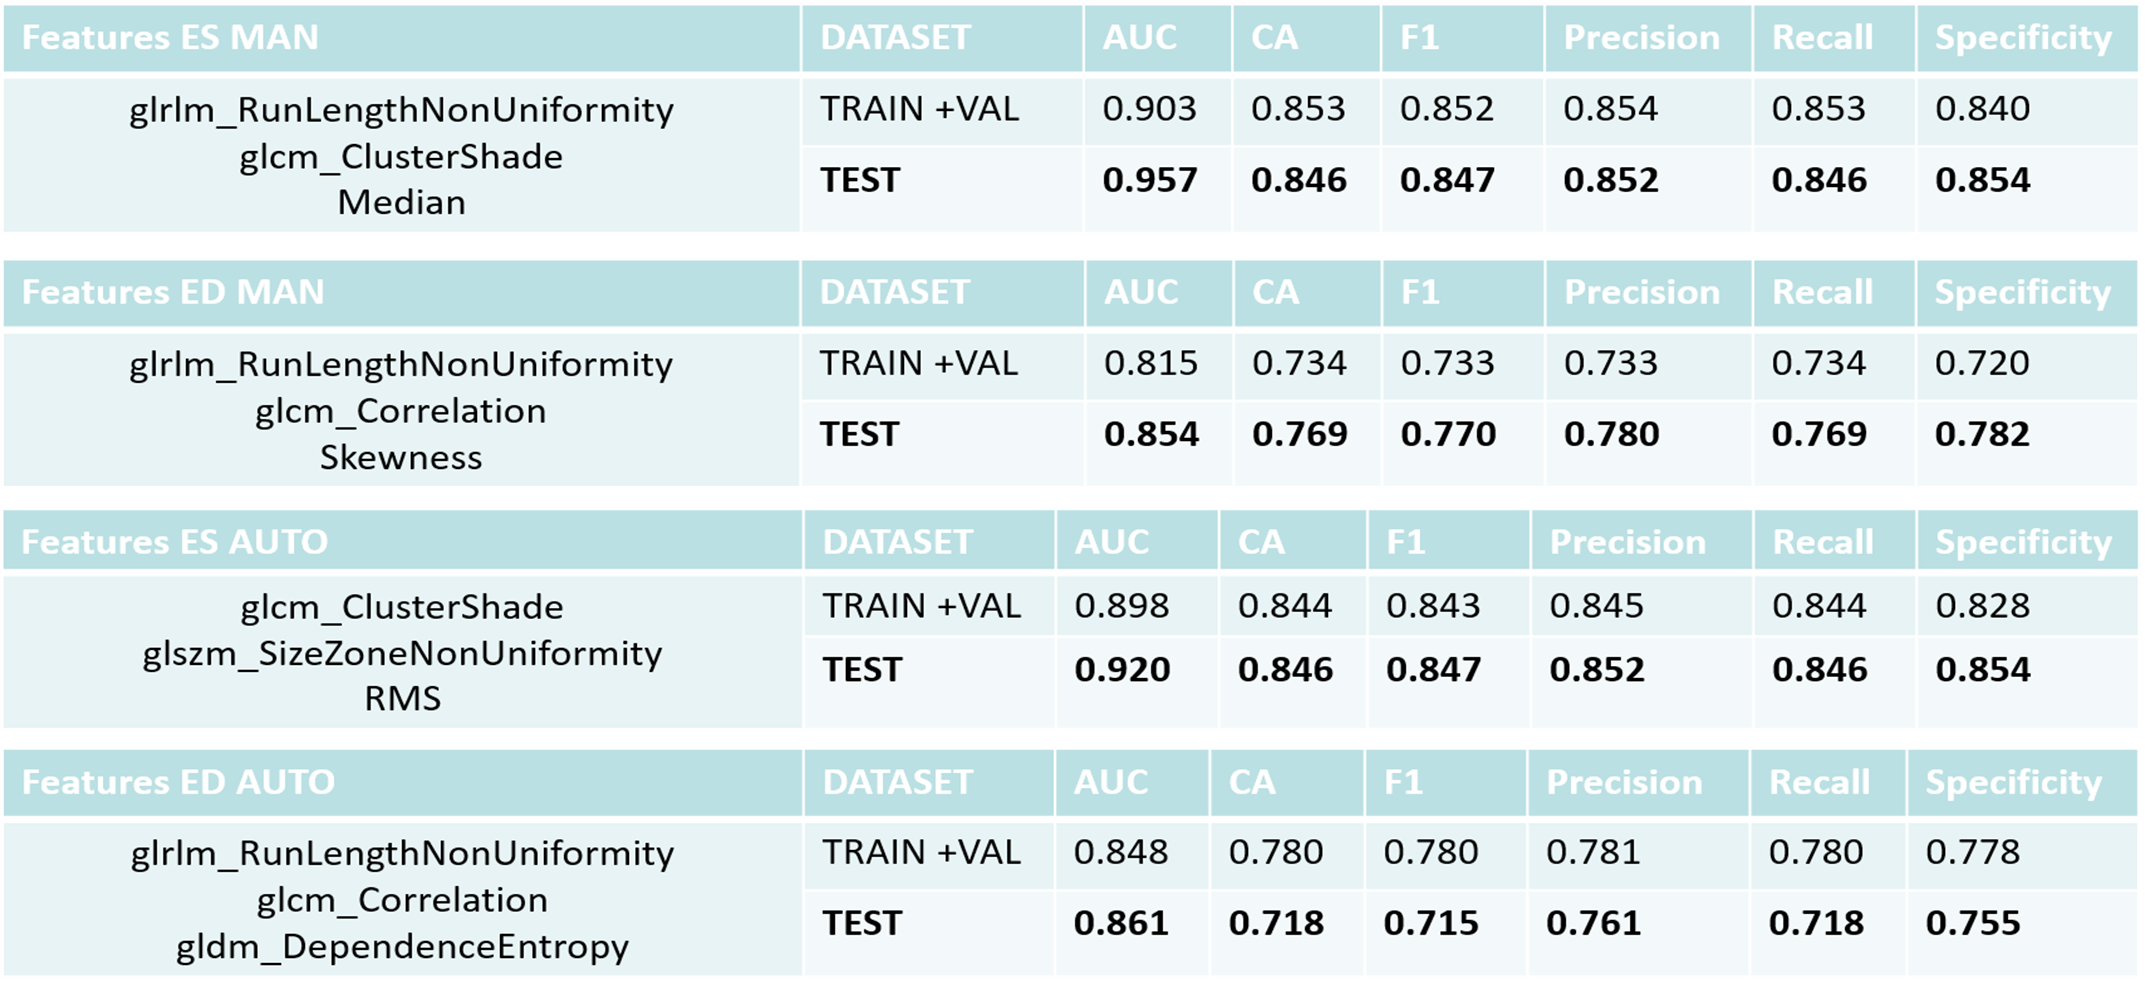
Figure 2:
Overview of classification results for the training and test dataset. Values
correspond to average results for infarct and control subjects.
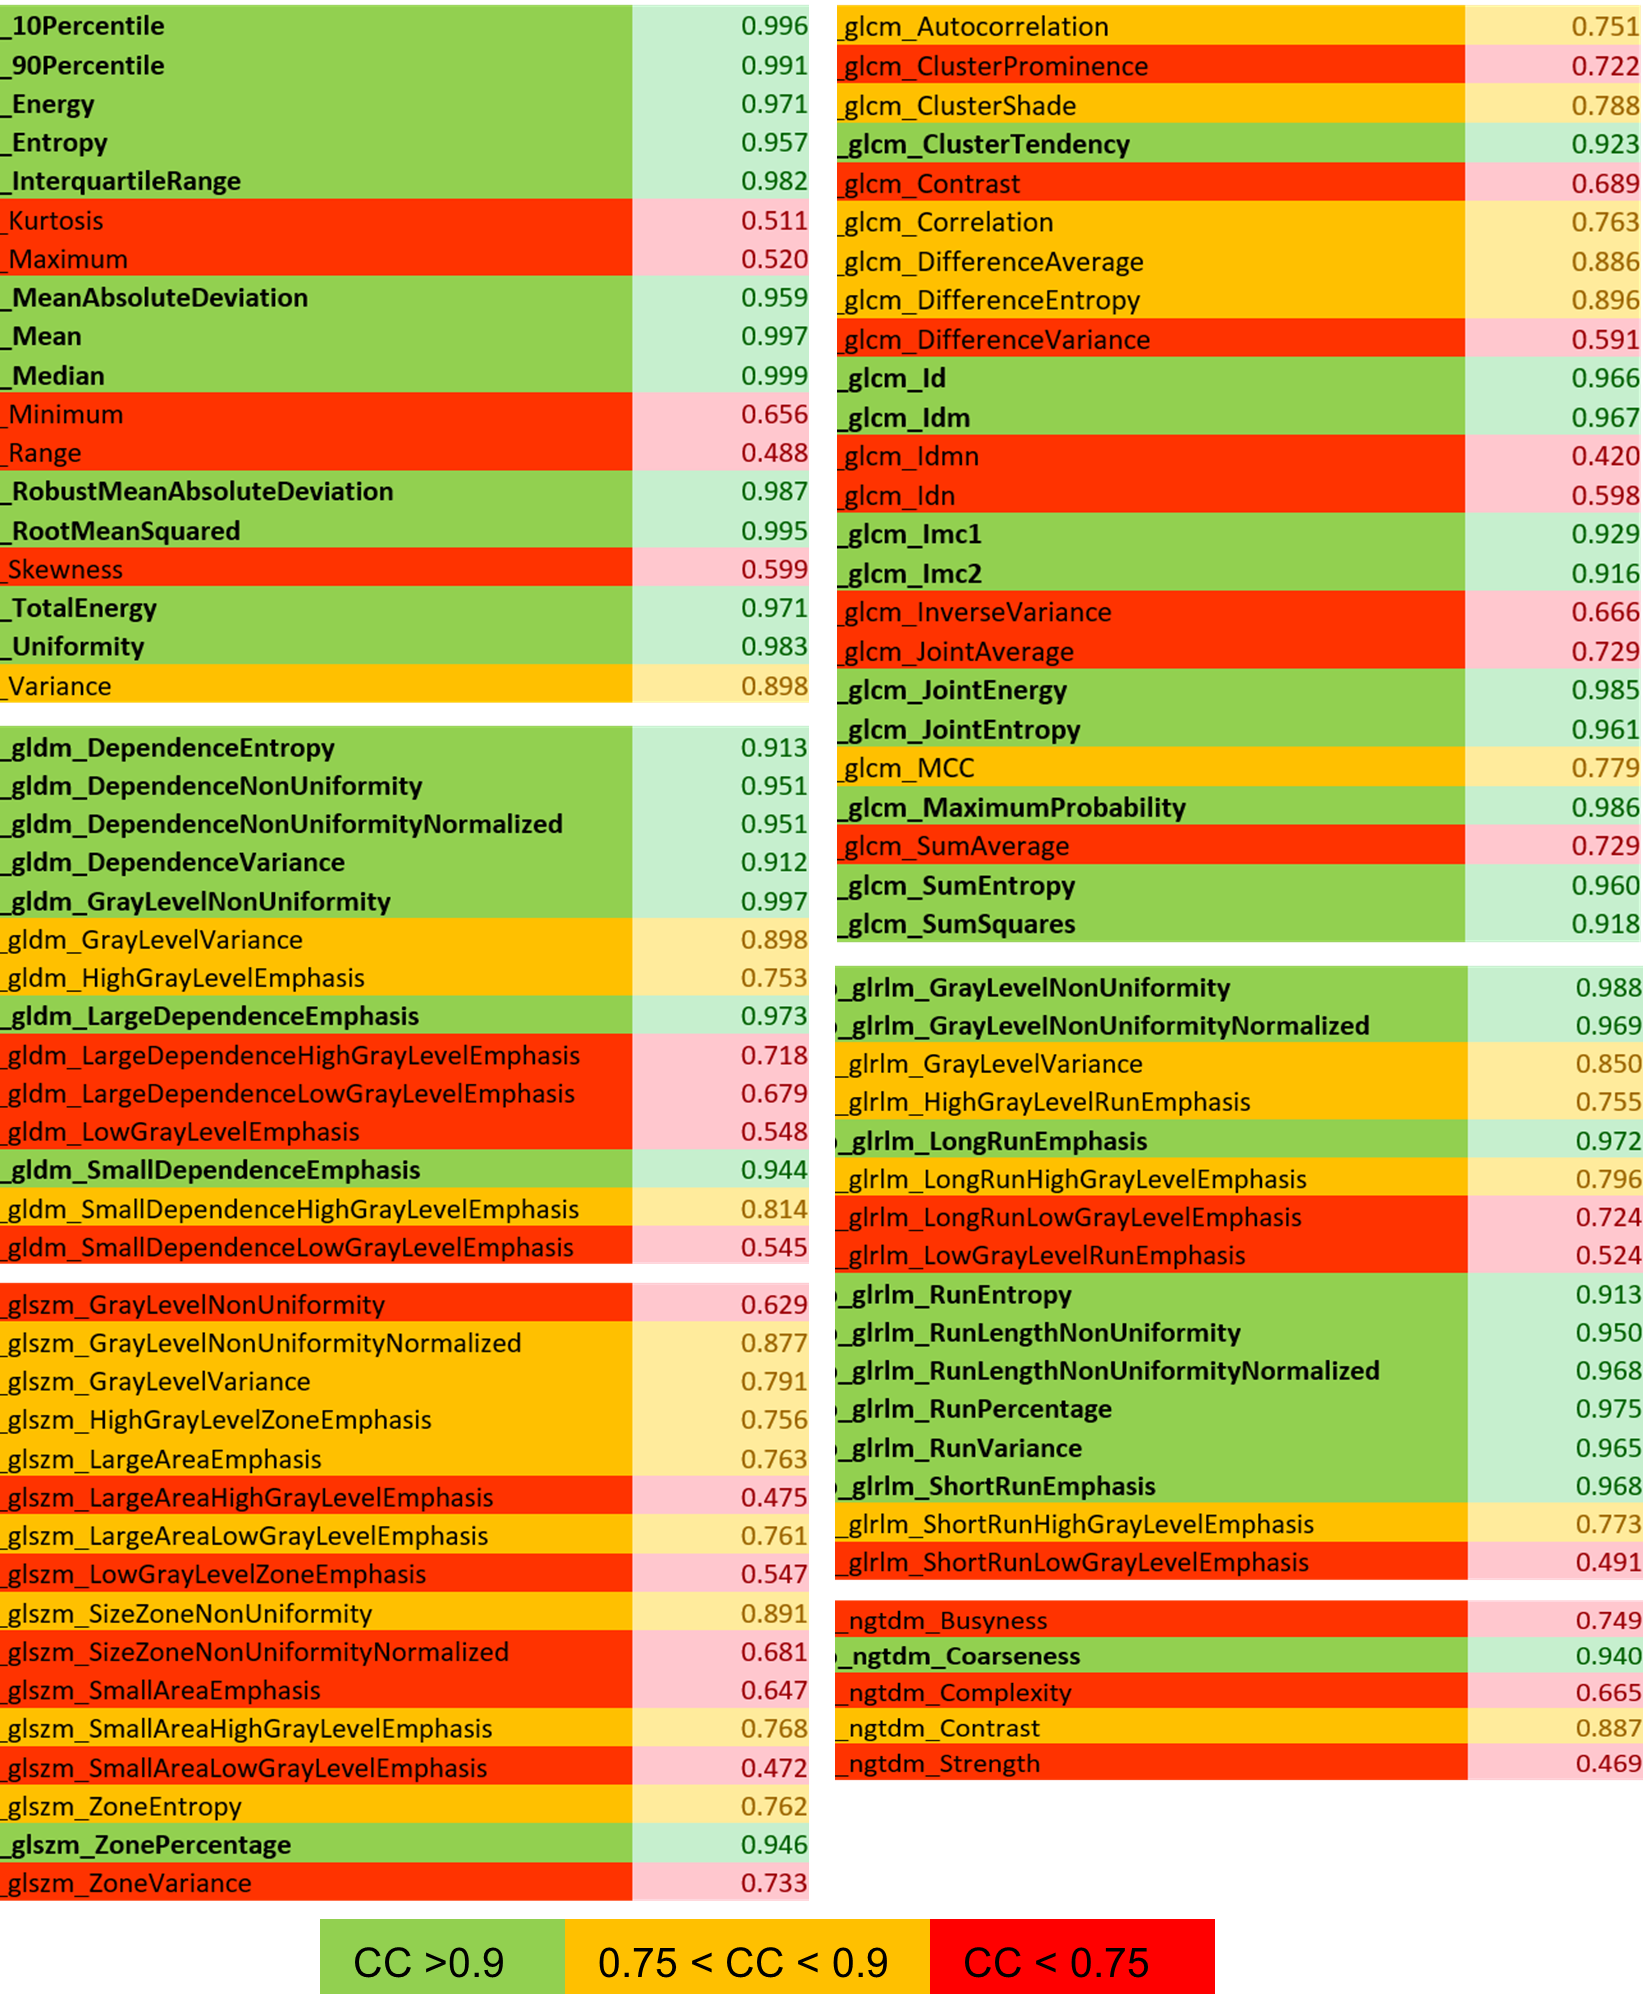
Figure 3: Pearson
correlation coefficient (CC) for manual versus automated ES contours.
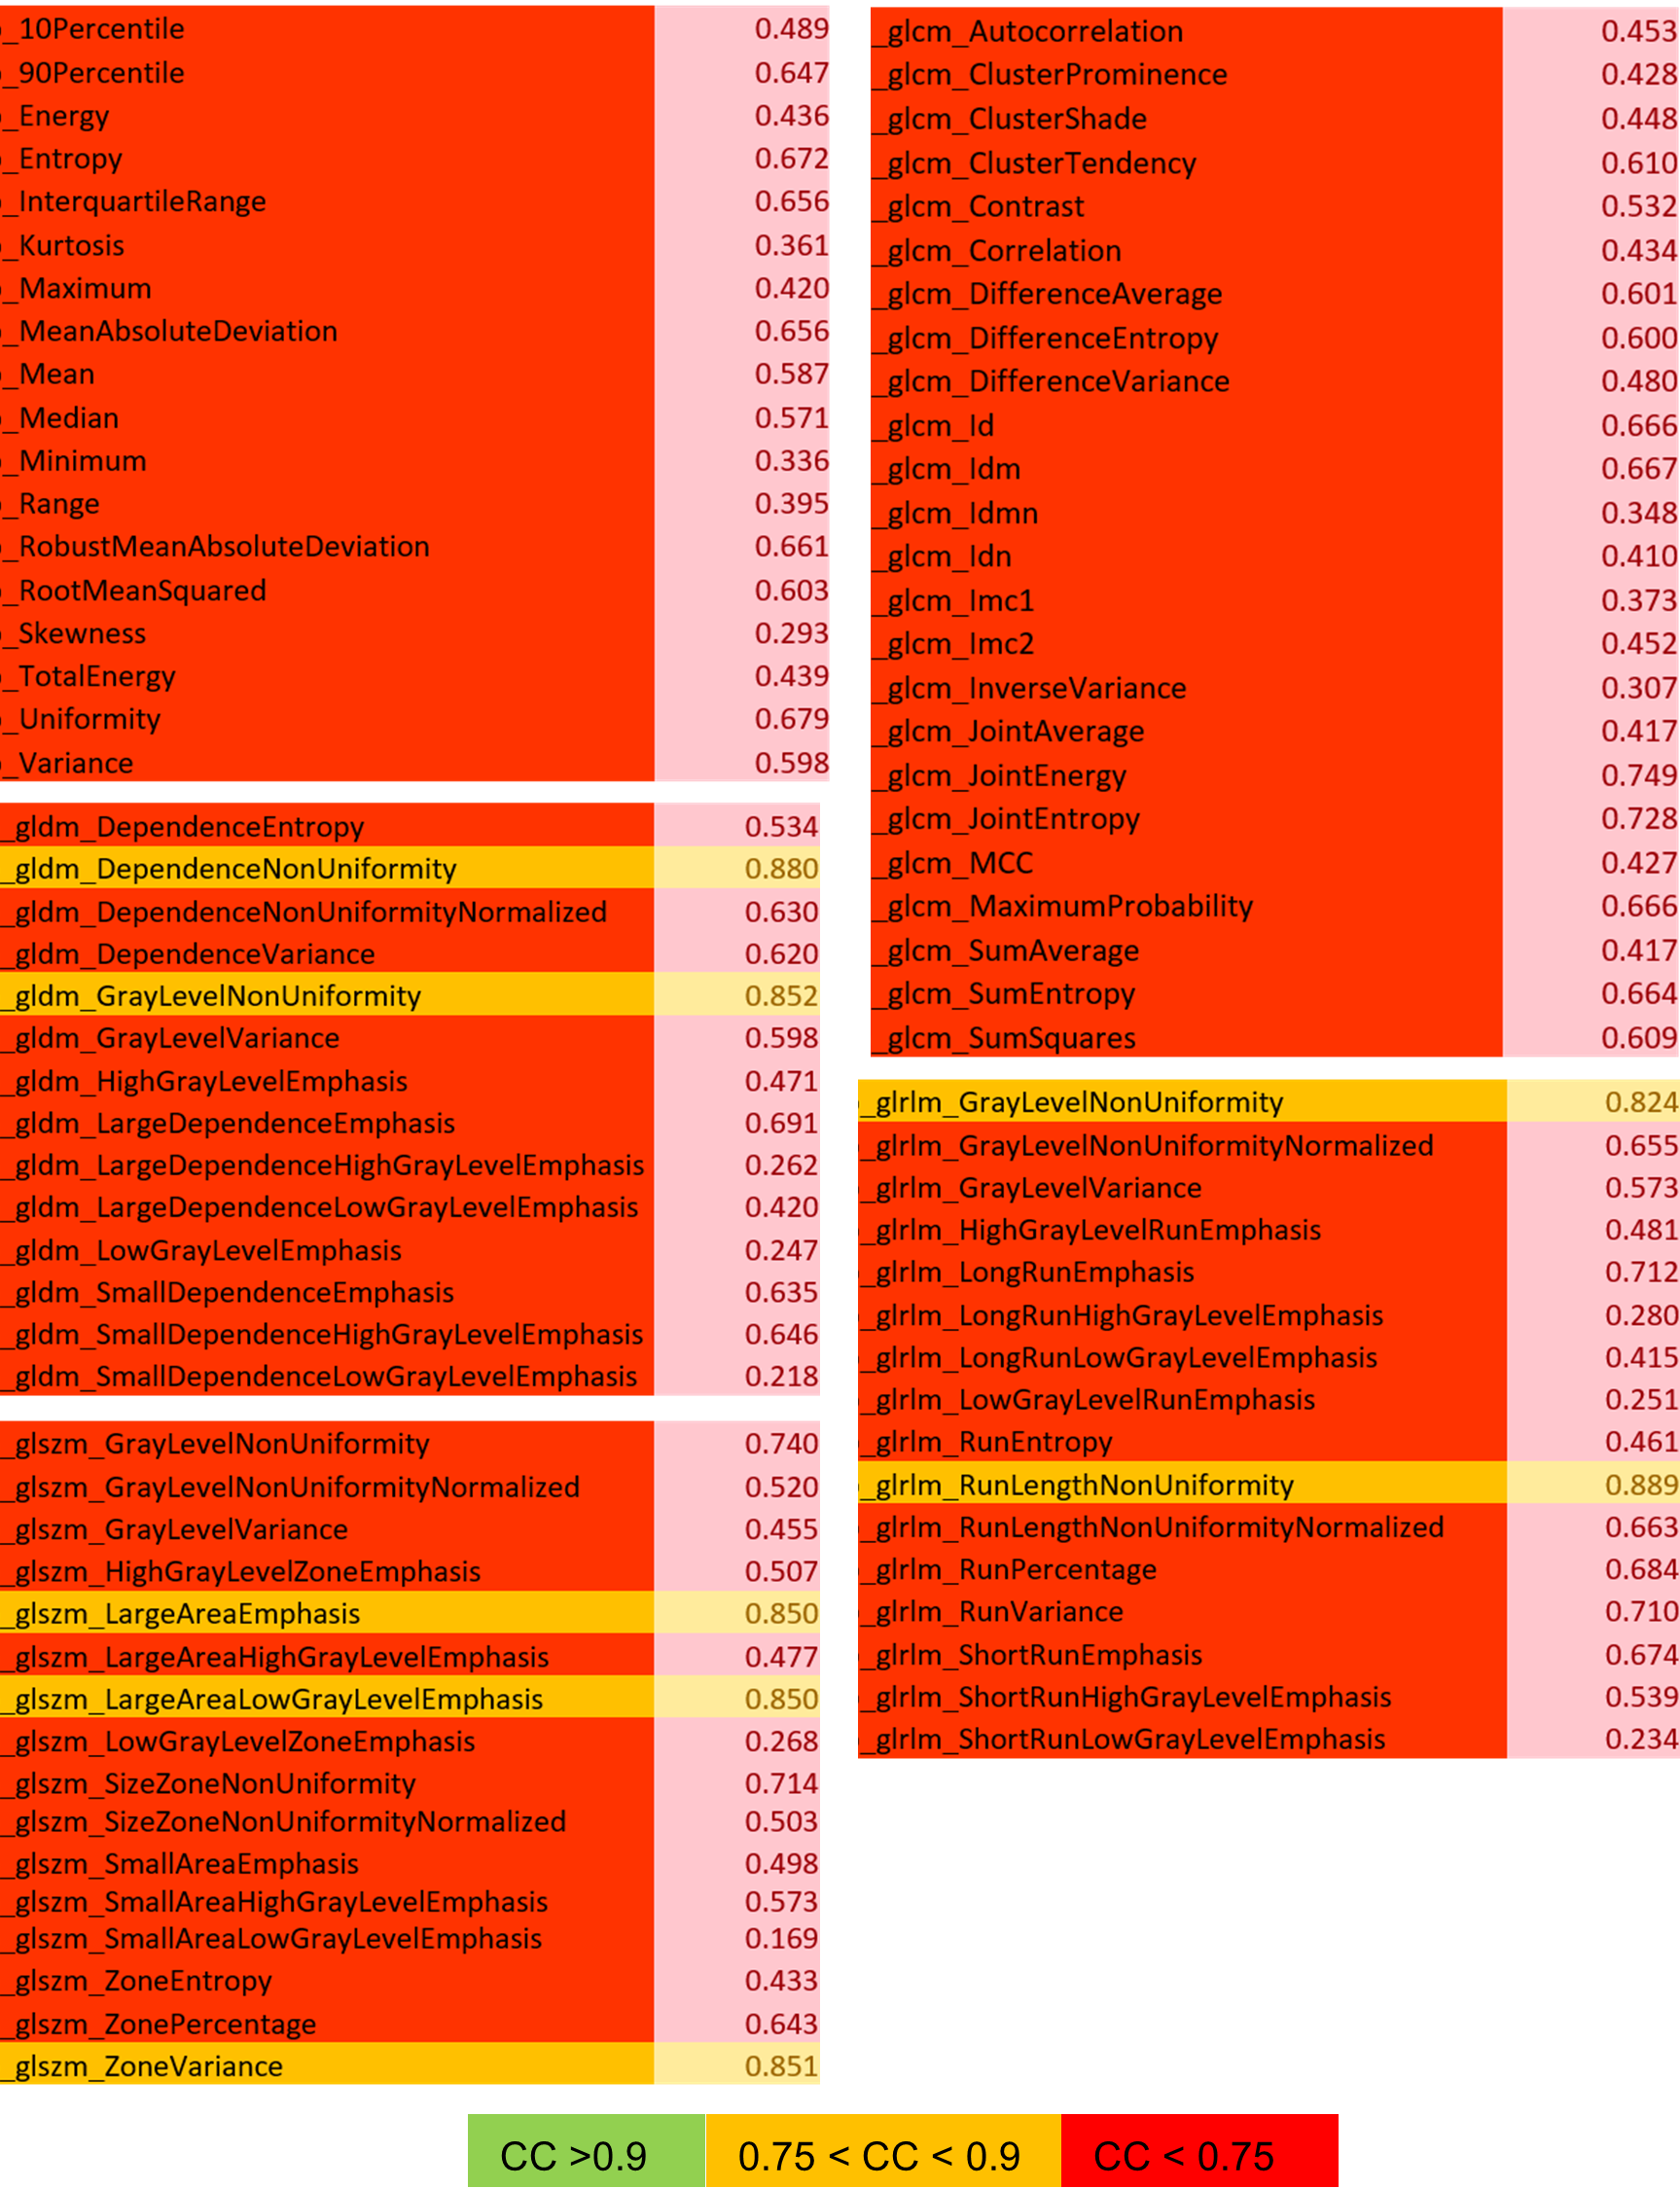
Figure 4: Pearson
correlation coefficients (CC) for ED vs ES features (manual contours).
DOI: https://doi.org/10.58530/2023/4831