4827
Common Carotid Arteries as Surrogate to the Internal Carotid Arteries in the MRI Quantification of Neurovascular Compliance1Department of Radiology, University of Pennsylvania, Philadelphia, PA, United States
Synopsis
Keywords: Vessels, Blood vessels, Neurovascular Compliance
Neurovascular compliance (NVC) is a vascular property involving the intracranial vascular arterial tree expressed as the arterial blood volume in response to a transient systolic blood pressure increase. NVC attracted attention due to its association with neurovascular diseases. We computed the NVC at the common carotid arteries with cine phase-contrast MR. This measure was shown to be significantly correlated with the quantification of the actual NVC in N=17 subjects (r= 0.84; p= 0.00002). Aortic pulse wave velocity, marker of aortic stiffness, was not found to be correlated with any of the two NVC computations.Introduction
Vascular compliance is the degree of elasticity of an artery. It is defined as the change in arterial volume in response to a change in pressure. Vascular compliance allows for the accommodation of increased blood flow and attenuates the propagation of blood pressure pulsatility to smaller vessels, preventing their damage1. Neurovascular compliance (NVC) refers to the compliance of the arterial tree providing blood to the brain. Several methods have previously been described for quantification of NVC since abnormal values are associated with many neurovascular disorders including some forms of dementia. Here, we applied a technique previously described by Bateman2 but targeting the common carotid arteries (CCA) because of their larger cross-sectional area relative to the internal carotid (ICA) and vertebral (VA) arteries, which are the feeding arteries to brain. This modified method minimizes error in the measurement of blood flow velocity. The work’s aim was to examine the relative agreement between the surrogate NVC computed at the level of the CCA with the actual NVC computed at the level of the ICA and VA. Further, as compliance is inversely related to the stiffness, we hypothesized that the NVC is inversely related to the aortic arch pulse wave velocity (aPWV), a marker of aortic arch stiffness based on the velocity of the pulse wave generated by the left ventricle contraction.Methods
NVC is defined as ΔVa/ΔP, ΔVa being the net arterial pulse volume and ΔP the pulse pressure. ΔVa is the degree of expansion of the neurovascular arterial tree during systole relative to its average volume during the cardiac cycle2 (Figure 1). ΔVa was estimated as the pulse volume via measurement of time-resolved blood flow rate through retrospective ECG-gated phase-contrast MRI with the following parameters: flip angle: 15°; TR: 11.54 ms; TE: 3.25 ms; FOV: 176 x 176 mm2; Matrix: 192 x 192; Bandwidth: 449Hz/Px. VENC was adjusted for every subject.Seventeen healthy, non-smoking subjects, ages 23 to 64 years, underwent this protocol at 1.5 Tesla (Siemens Avanto) using a head/neck coil array. Scans assessing NVC and aPWV were performed twice in 11 subjects to examine the method’s reproducibility. Subjects were repositioned between scans. Temporal resolution was around 20ms. Regions of interest were drawn around the CCA, ICA and VA (Figure 2) on magnitude images and transferred to the velocity images to derive the time-resolved blood flow velocity and cross-sectional areas of the arteries. These parameters allowed the computation of a time-resolved blood flow rate. The flow rates in the ICA and VA were added to get the actual NVC (Figure 1). ΔP, defined as the difference between the systolic and diastolic blood pressure, was determined through a brachial pressure measurement using an MRI-compatible sphygmomanometer with the subject laid down on the scanner table.
aPWV was determined as D/δt, D being the path distance traveled by the pulse pressure wave in a period of time δt (Figure 3). It was quantified utilizing a non-triggered MRI sequence3 with the following parameters: flip angle: 20°; TR: 3.27 ms; TE: 1.7 ms; FOV: 256 x 448 mm2; reference matrix: 96 x 224; 1024 repetitions. Body and spine coils were used. Time-resolved velocity determined from velocity-encoded projections at two aortic sites simultaneously, yielding complex difference, which is proportional to velocity. Consequent extrapolation of the wave transit-time δt allowed us to derive aPWV3. The path length D traveled by the wave was determined by drawing free-hand lines on the aortic walls using ImageJ (Figure 3).
Matlab, ImageJ and SPSS were used for image reconstruction, ROI selection and statistical analysis, respectively.
Results and Discussion
The CCA blood flow and the combined ICA and VA flow were significantly correlated (r=0.55; p=0.022). The intra-class correlation coefficient for the actual NVC and surrogate NVC quantifications was 0.719 with a CI=[0.043;0.913]. There was a significant correlation between the actual NVC and the surrogate NVC (r=0.84; p=0.00002) (Figure 4). Significant relationships were not observed between the actual NVC and age (r=0.38; p=0.13) nor between the surrogate NVC and age (r=0.27; p=0.3).The hypothesis was that a higher aPWV, due to a stiffer aorta, results in detrimental effects on peripheral vascular beds and notably a decreased NVC. One potential reason for not observing significant correlations between the aPWV and actual NVC (r=0.27; p=0.3) nor between the aPWV and surrogate NVC (r=0.19; p=0.47) could be the fact that those effects take time to manifest, and the majority of our subjects are young (11 subjects aging between 23 and 33 years old). Meanwhile, the aPWV was shown to increase with age (Figure 5) (r=0.74 and p=0.0007), indicating an increase in arterial stiffness with aging and agreeing with the literature4.Intra-class correlation coefficients for the test-retest of the actual NVC (0.954, CI=[0.843;0.987]), surrogate NVC (0.87, CI=[0.569;0.964]) and aPWV (0.895, CI=[0.666;0.971]) yielded a measure of reproducibility of the two methods.
Conclusion
The data suggest the NVC computed at the level of the CCA to be a valid surrogate measurement of actual NVC. A larger number of older subjects would be required to evaluate a possible association between aPWV and NVC.Acknowledgements
References
1. Li Y, Lim C, Schär M, et al. Three-dimensional assessment of brain arterial compliance: Technical development, comparison with aortic pulse wave velocity, and age effect. Magn Reson Med. 2021;86(4):1917-1928.2. Bateman GA, Levi CR, Schofield P, et al. Quantitative measurement of cerebral haemodynamics in early vascular dementia and Alzheimer's disease. J Clin Neurosci. 2006;13(5):563-568.
3. Langham MC, Li C, Magland JF, et al. Nontriggered MRI quantification of aortic pulse-wave velocity. Magn Reson Med. 2011;65(3):750-755.
4. Soulat G, Gencer U, Kachenoura N, et al. Changes in segmental pulse wave velocity of the thoracic aorta with age and left ventricular remodelling. An MRI 4D flow study. J Hypertens. 2020;38(1):118-126.
Figures
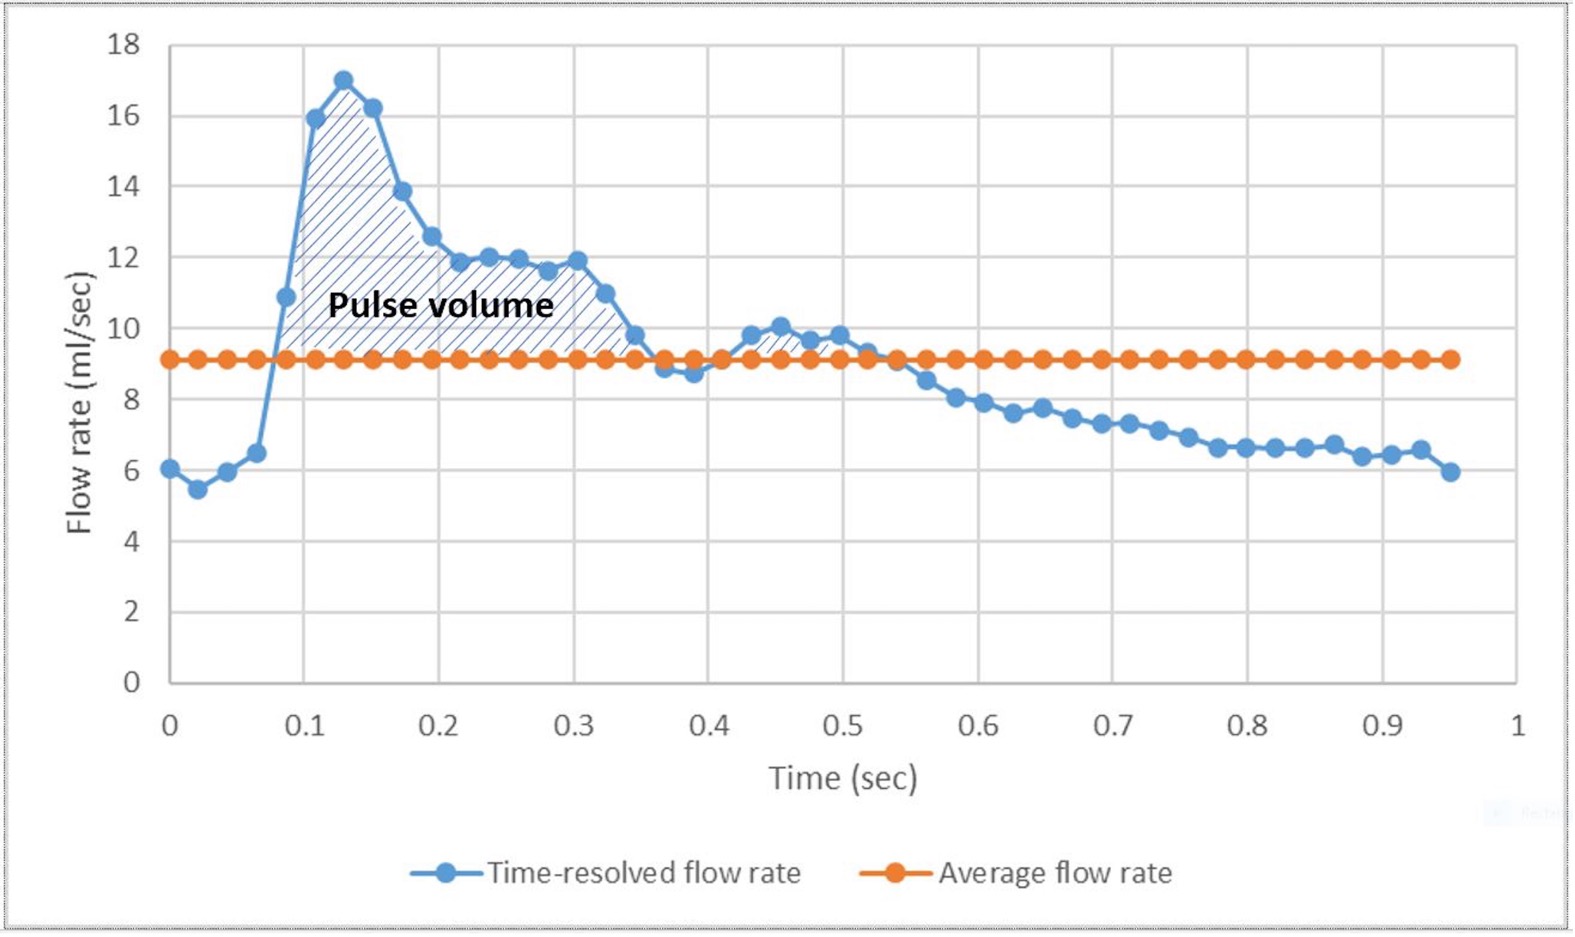
Figure 1 – Computation of the actual NVC: The blue line represents the time-resolved total blood flow rate (in the ICA and VA combined), the orange line the mean total blood flow rate over the entire cardiac cycle. The shaded area in between the blue and orange lines represents the net arterial pulse volume, ΔVa.
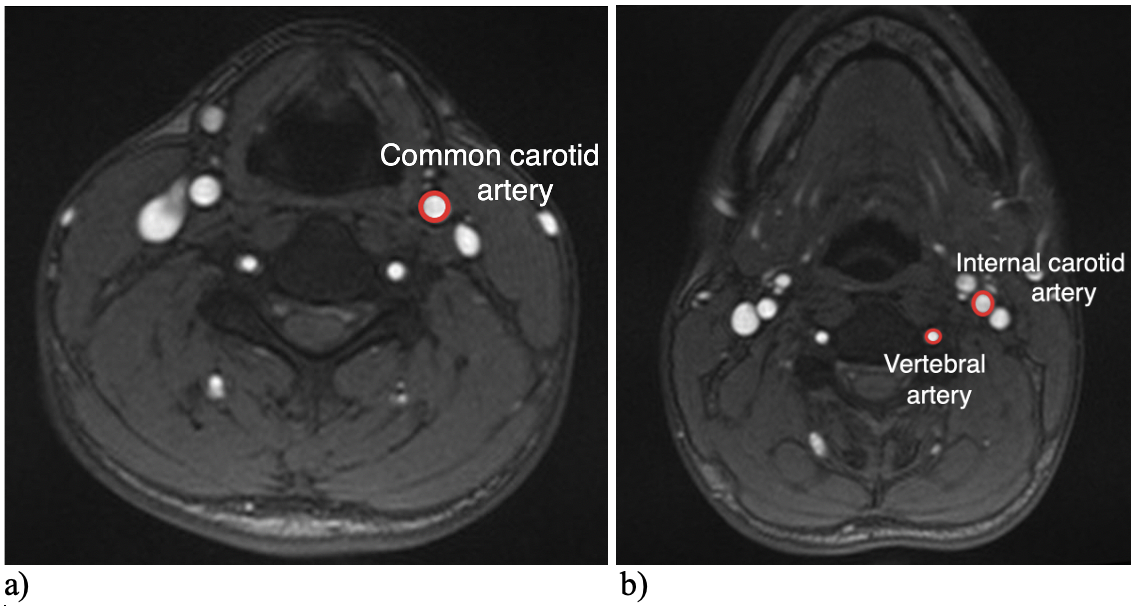
Figure 2-
a) Region of interest determining the cross-sectional area of the CCA used for the computation of the surrogate NVC.
b) Regions of interest determining the cross-sectional area of the ICA and VA used for the computation of the actual NVC.
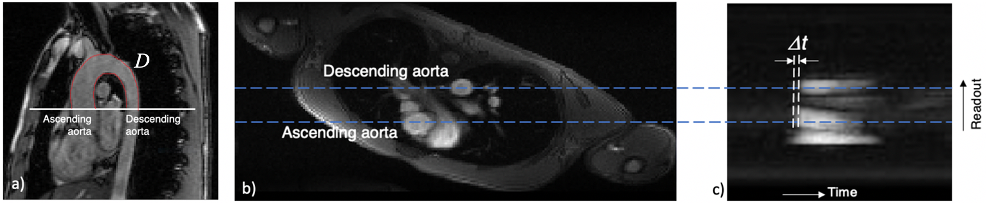
Figure 3 –
Measurement of aPWV:
a) Oblique sagittal view of the aortic arch for measurement of the path length D of the flow wave between the ascending and descending aorta;
b) rotated axial image showing the major vessels;
c) signal intensity of complex difference between the velocity-encoded projections versus time, yielding δt, the time shift in the velocity wave between the ascending and descending aorta from which the pulse-wave velocity is computed.
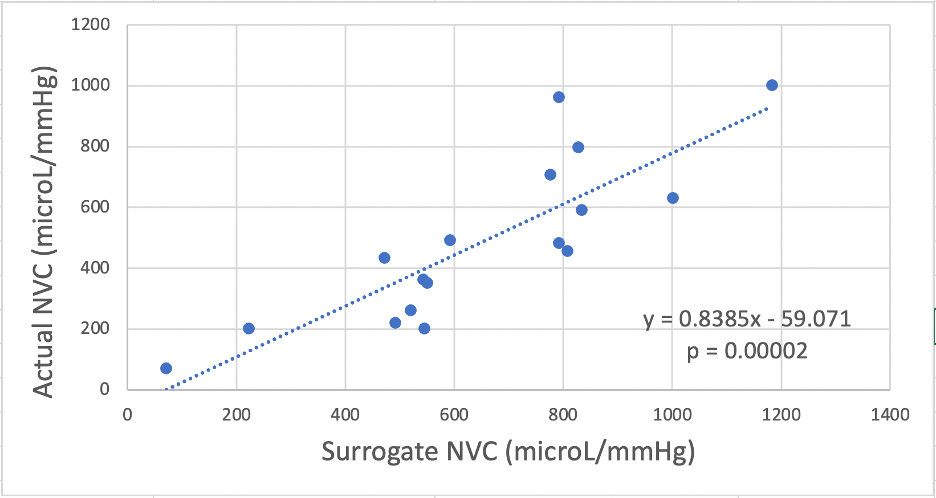
Figure 4 – Scatter plot showing the correlation between the actual and surrogate NVC (in microL/mmHg).
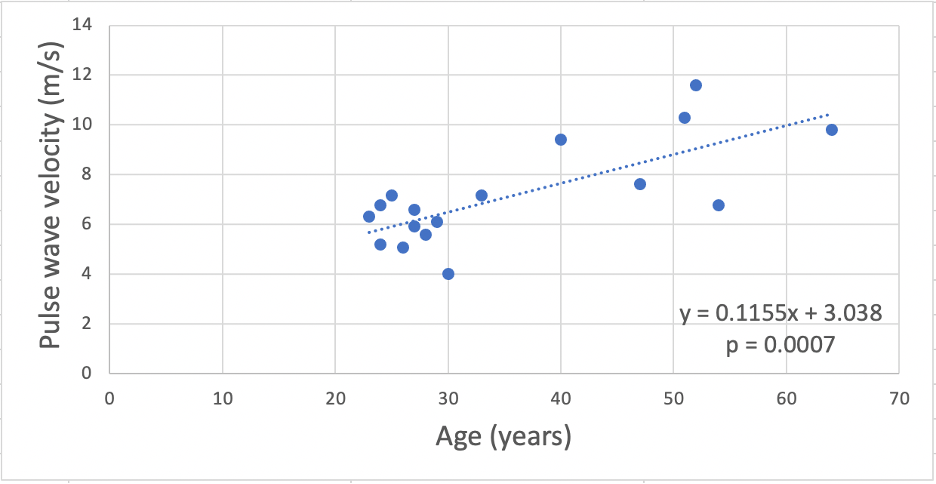
Figure 5 – Scatter plot showing the correlation between the aPWV (in m/s) and age (in years).