4820
Introduction of a Digital Lung Model for Validation and Refinement of Functional Lung Imaging Methods1Institute of Diagnostic and Interventional Radiology, Medical School Hannover, Hannover, Germany, 2Biomedical Research in Endstage and Obstructive Lung Disease Hannover (BREATH), German Center for Lung Research (DZL), Hannover, Germany
Synopsis
Keywords: Lung, Quantitative Imaging
Functional lung imaging with proton MRI based on acquisition of free-breathing image-time-series gained interest during the last years, as it offers potential for ventilation / perfusion measurements without requirement for high patient compliance or administration of contrast agents. Since these methods rely on indirect surrogate measurements, validation with more direct techniques (e.g. hyperpolarized MRI), is required, which is elaborate, costly and limited. In this study a framework for a digital lung model, including artificial pathologies, is introduced and tested for different ventilation and perfusion measurements. Using the proposed method important differences were found between the methods regarding ventilation defect detection.
Introduction
Recently, several methods were established to utilize dynamic proton MRI measurements of the lung in free breathing, including phase-resolved functional lung imaging (PREFUL)1, Matrix Pencil Decomposition2 or 3D MR spirometry3. Such methods include image registration, which in itself offers possibility to quantify regional ventilation4. Alternatively, registered voxel time series (TS) can be analyzed to derive perfusion and ventilation parameters. In all cases the functional information is derived from indirect surrogate measurements. This leads to the necessity to perform extensive validation of such methods with e.g. hyperpolarized MRI or contrast-enhanced MRI5–7. The validation process is difficult, as it requires access to patient cohorts and extended MRI protocols. Furthermore, even though these methods are considered as a gold standard, a “true” standard remains unknown8.We propose to use a digital lung model as an initial validation method, similar to phantom measurements for sequence design, which includes artificial pathologies at known locations. This model is tested for signal based and registration based ventilation measurement and also for ventilation / perfusion measurement with PREFUL.
Methods
To create a 2D free-breathing digital lung model, the following steps were performed (see also Figure 1):1. A lung boundary in coronal view (matrix 128x128) with two rectangles was created as the initial expiration state.
2. Ten voxel-classes were defined:
1) Background: Pure noise
2) Body: High static signal
3) Normal: Lung tissue with no ventilation or perfusion defect (VD/ QD)
4) VD-1: Lung voxels with ventilation defect (no expansion) and reduced signal (e.g. emphysema)
5) VD-2: Lung voxels with ventilation defect (no expansion) and constant signal at inspiration level (e.g. air-trapping)
6) Infiltrate: Static tissue in the lung with high signal
7) Delayed V: delayed ventilation signal
8) QD: Perfusion defect (no perfusion component)
9) Delayed Q: delayed perfusion signal
10) Vessel: Strong perfusion signal without ventilation
3. Appropriate TS for each voxel were generated using a sine/cosine model described by Bauman et al.9
4. Each lung voxel was prescribed with a defined maximal expansion factor (1.25 normal, 1 ventilation defect).
5. Artificial warp-fields were generated to deform the expiration states to a complete TS with 250 images (each with own noise).
6. Noise was added to each image according to SNR (20 for normal lung voxels) using an artificial coil-combination to simulate realistic distributions of a multi-coil acquisition.10
The obtained image-TS was also pseudo-registrated to expiration using the inverse of the known warpfield to create a reference registration. Additionally the data was registrated with advanced normalization tools (ANTs)11, Daniel Forsberg12,13 package, and a demons algorithm available in MATLAB (R2020b)14. The experiment was repeated for 20 lung model-TS with different random locations of the classes 3)-9).
Ventilation was measured with the signal-based regional ventilation (RVent)4 and secondly, with the Jacobi determinant (J) method, which measures the volume change derived from the warpfields obtained during registration15. Metrics were tested with Wilcoxon-signed-rank-test.
Additionally, PREFUL was used to evaluate the whole image-TS and test detection of all implemented classes, including perfusion defects and delayed lung function.
Results
The best performance was achieved with Forsberg registration, which had a high correlation (r=0.99) of the y-displacement and the lowest mean squared error (MSE) of 26.36 vs. 31.51 (ANTs) and 52.67 (Matlab). The lowest correlation of the displacement was found for Matlab (r=0.63).The mean values of all methods were close to the expected value of 0.25 (expansion-factor-1). On a regional level all registrations showed artifacts at the lung boundary. Examplary results are shown in Figure 2 and 3.
Comparing the VDs retrieved from the different maps, the J method could only detect the infiltrate-class (Figure 4). The highest dice value was reached with Forsberg and Matlab RVent (0.26/0.27).
Forsberg registered data was successfully evaluated with PREFUL. All defects were discernable, but the perfusion delay defect seemed to persist throughout the perfusion cycle. Summary of statistics and PREFUL results are shown in Figure 5.
Discussion
A digital lung model, which mimics the data obtained from 2D MR acquisition of free-breathing data was introduced and used for an exemplary evaluation of different registration algorithms and quantification methods for ventilation.On average all methods showed the expected ventilation value according to the selected expansion. The finding that small ventilation defects were not detected by all registrations can be potentially explained by the fact that registration is performed with regularizations, which penalize abrupt changes in the deformation field. Since a high signal defect region was found by all algorithms, this behaviour seems to be dependent on the signal level (differences) between neighbouring voxels.
Since only one digital lung model was assessed for this study and no parameter optimization was carried out, the results should be taken with caution. Then again, such results can be used in a feedback loop to optimize such methods.
Conclusion
The feasibility of a novel validation framework for functional lung imaging methods was demonstrated. The utility of this approach was exemplarily shown by comparing two different methods for ventilation measurements. Using variations of the model (SNR, defect size, expansions) future studies can assess a variety of scientific questions. Being digital, the model can be easily shared and implemented as a form of standardization and quality control.Acknowledgements
No acknowledgement found.References
1. Voskrebenzev A, Gutberlet M, Klimeš F, et al. Feasibility of quantitative regional ventilation and perfusion mapping with phase-resolved functional lung (PREFUL) MRI in healthy volunteers and COPD, CTEPH, and CF patients. Magn Reson Med. 2018;79(4):2306-2314. doi:10.1002/mrm.26893
2. Bauman G, Bieri O. Matrix pencil decomposition of time-resolved proton MRI for robust and improved assessment of pulmonary ventilation and perfusion. Magn Reson Med. 2017;77(1):336-342. doi:10.1002/mrm.26096
3. Boucneau T, Fernandez B, Larson P, Darrasse L, Maître X. 3D Magnetic Resonance Spirometry. Sci Rep. 2020;10(1):9649. doi:10.1038/s41598-020-66202-7
4. Klimeš F, Voskrebenzev A, Gutberlet M, et al. Free-breathing quantification of regional ventilation derived by phase-resolved functional lung (PREFUL) MRI. NMR Biomed. 2019;32(6):e4088. doi:10.1002/nbm.4088
5. Kaireit TF, Kern A, Voskrebenzev A, et al. Flow Volume Loop and Regional Ventilation Assessment Using Phase-Resolved Functional Lung (PREFUL) MRI: Comparison With 129 Xenon Ventilation MRI and Lung Function Testing. J Magn Reson Imaging JMRI. 2021;53(4):1092-1105. doi:10.1002/jmri.27452
6. Behrendt L, Voskrebenzev A, Klimeš F, et al. Validation of Automated Perfusion-Weighted Phase-Resolved Functional Lung (PREFUL)-MRI in Patients With Pulmonary Diseases. J Magn Reson Imaging. 2020;52(1):103-114. doi:10.1002/jmri.27027
7. Capaldi DPI, Sheikh K, Guo F, et al. Free-breathing Pulmonary 1H and Hyperpolarized 3He MRI: Comparison in COPD and Bronchiectasis. Acad Radiol. 2015;22(3):320-329. doi:10.1016/j.acra.2014.10.003
8. Vogel-Claussen J. Functional Lung MRI: Deep Learning Turns Proton into Helium Ventilation Maps—The Battle Is On! Radiology. 2021;298(2):439-440. doi:10.1148/radiol.2020204069
9. Bauman G, Scholz A, Rivoire J, et al. Lung ventilation- and perfusion-weighted Fourier decomposition magnetic resonance imaging: In vivo validation with hyperpolarized 3He and dynamic contrast-enhanced MRI. Magn Reson Med. 2013;69(1):229-237. doi:10.1002/mrm.24236
10. Dietrich O, Raya JG, Reeder SB, Ingrisch M, Reiser MF, Schoenberg SO. Influence of multichannel combination, parallel imaging and other reconstruction techniques on MRI noise characteristics. Magn Reson Imaging. 2008;26(6):754-762. doi:10.1016/j.mri.2008.02.001
11. Avants BB, Tustison NJ, Song G, Cook PA, Klein A, Gee JC. A Reproducible Evaluation of ANTs Similarity Metric Performance in Brain Image Registration. NeuroImage. 2011;54(3):2033-2044. doi:10.1016/j.neuroimage.2010.09.025
12. Forsberg D, Andersson M, Knutsson H. Extending Image Registration Using Polynomial Expansion To Diffeomorphic Deformations. In: SSBA Symposium on Image Analysis. ; 2012:4.
13. Forsberg D. fordanic/image-registration. Published online 2022. Accessed April 12, 2022. https://github.com/fordanic/image-registration
14. Vercauteren T, Pennec X, Perchant A, Ayache N. Diffeomorphic demons: Efficient non-parametric image registration. NeuroImage. 2009;45(1, Supplement 1):S61-S72. doi:10.1016/j.neuroimage.2008.10.040
15. Kjørstad Å, Corteville DMR, Henzler T, et al. Quantitative lung ventilation using Fourier decomposition MRI; comparison and initial study. Magn Reson Mater Phys Biol Med. 2014;27(6):467-476. doi:10.1007/s10334-014-0432-9
16. Pöhler GH, Klimeš F, Behrendt L, et al. Repeatability of Phase-Resolved Functional Lung (PREFUL)-MRI Ventilation and Perfusion Parameters in Healthy Subjects and COPD Patients. J Magn Reson Imaging. 2021;53(3):915-927. doi:10.1002/jmri.27385
Figures
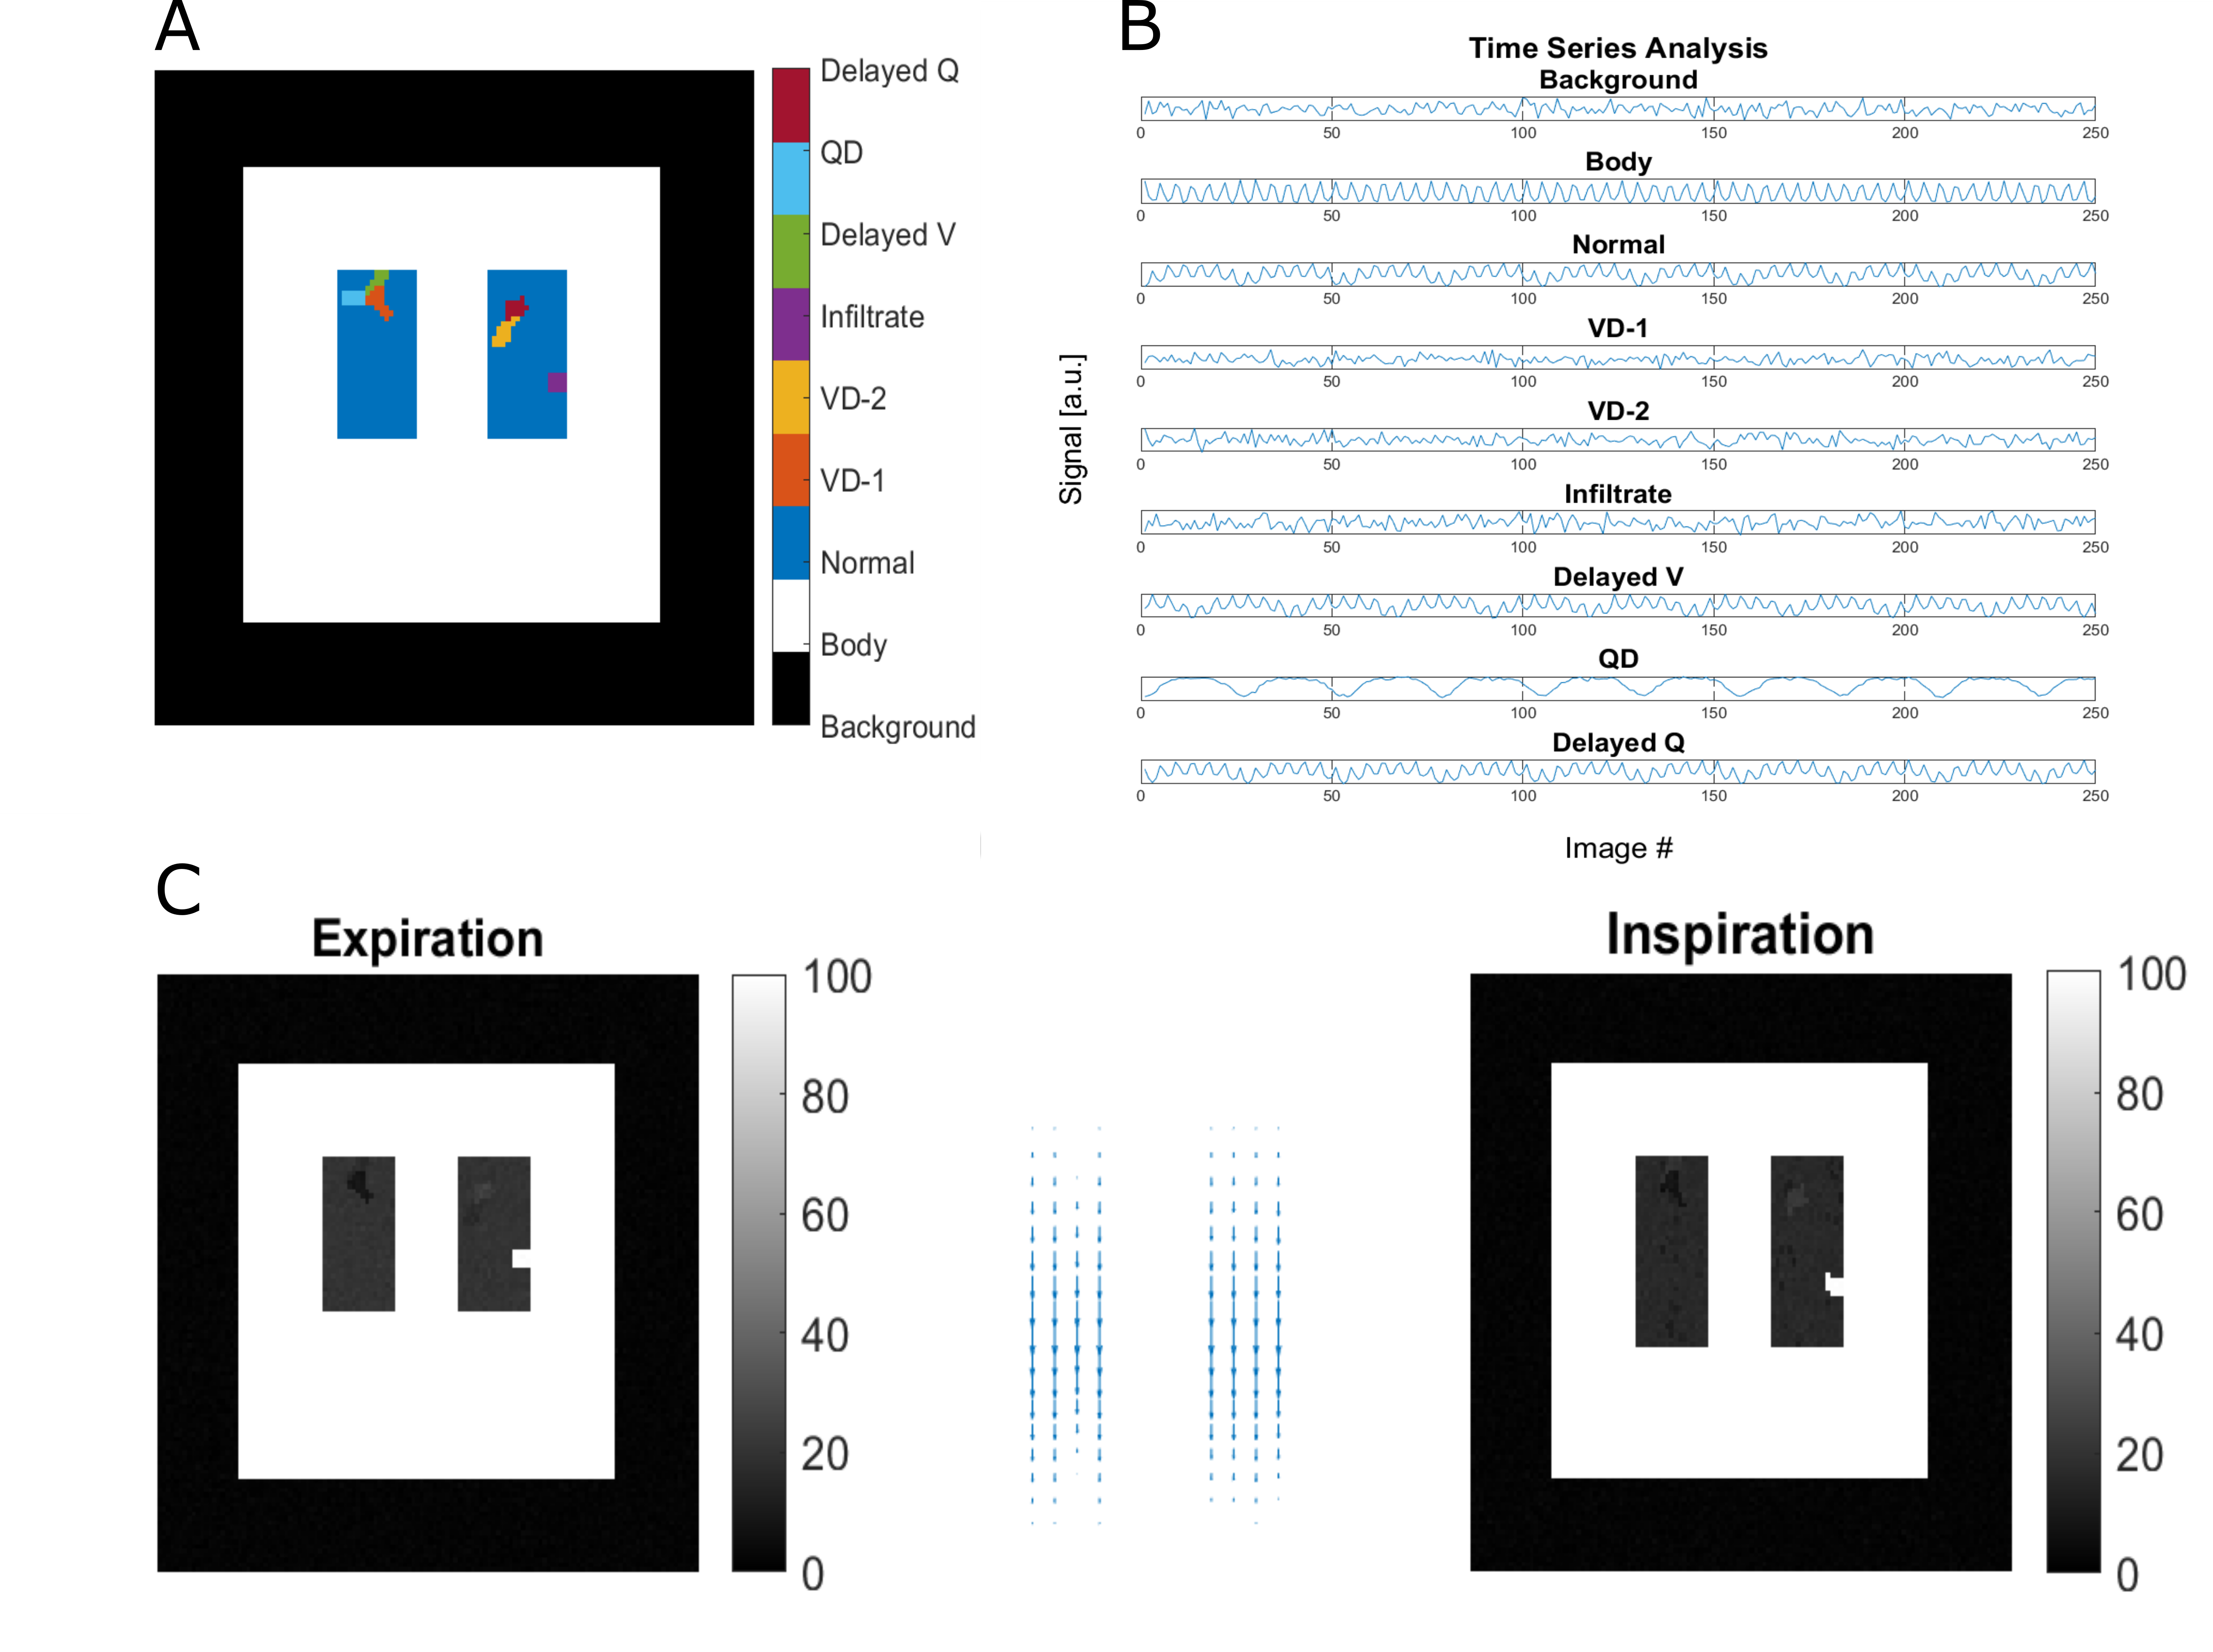
Figure 1: Illustration of the process to create a 2D lung model time-series (TS) with different lung pathologies. Firstly, voxels were assigned to a specific class (see legend A). Secondly, time-series, including noise were generated using a sine/cosine model (B). Thirdly, artificial warpfields (middle C) were utilized to generate different respiration states (C). V – Ventilation; Q – Perfusion; VD – ventilation defect; QD – Perfusion defect;
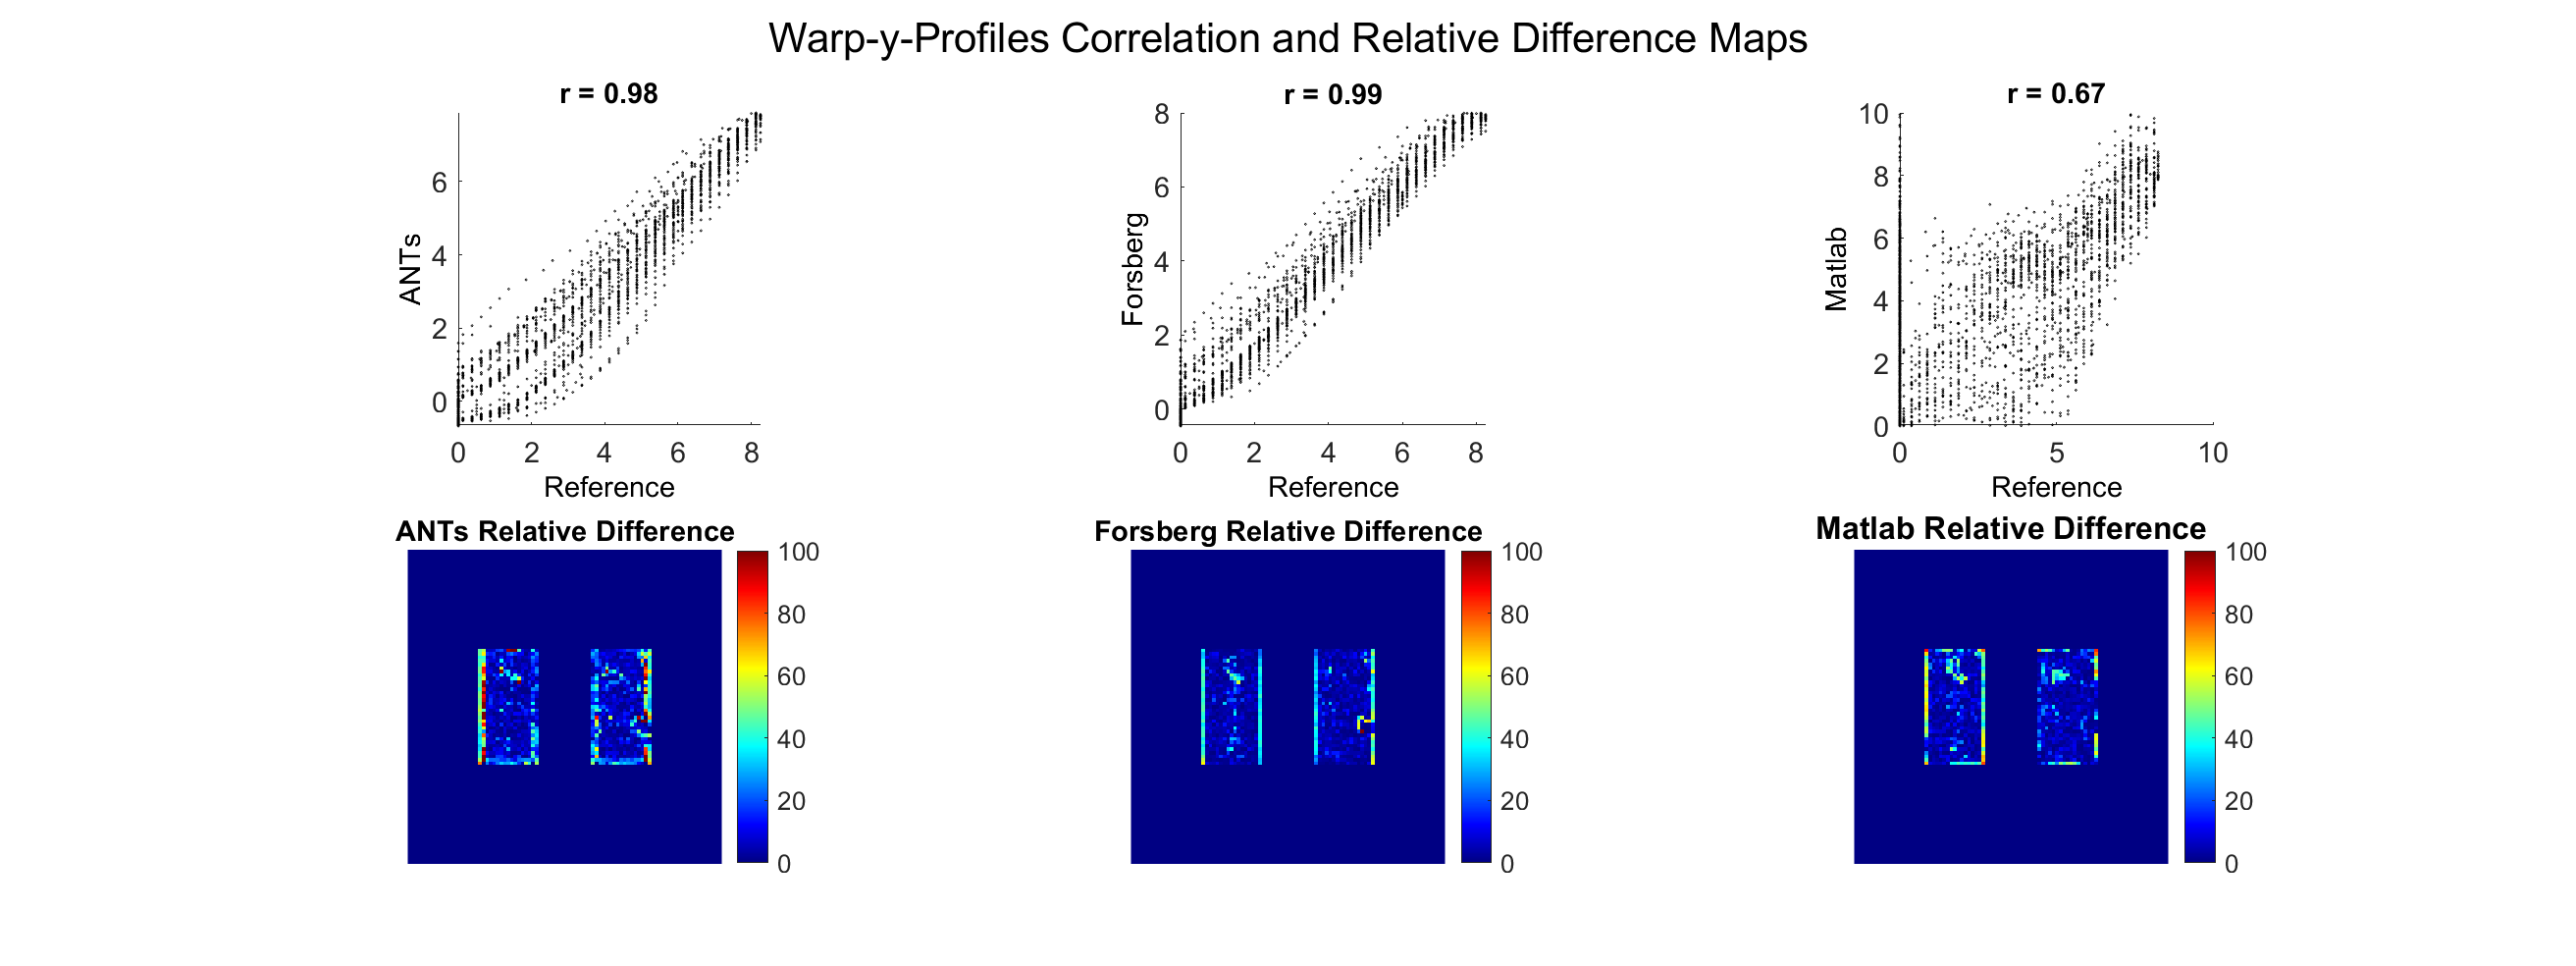
Figure 2: Evaluation of three registration methods against a reference registration, which was obtained by inversion of the generated warpfields: advanced normalization tools (ANTs), Forsberg package and a demons algorithm implemented in Matlab. The first row shows the correlation of y-Displacements. The second row shows the relative difference to reference registration (%) with mean squared error (MSE): ANTs 41.32, Forsberg 24.88, Matlab 59.15.
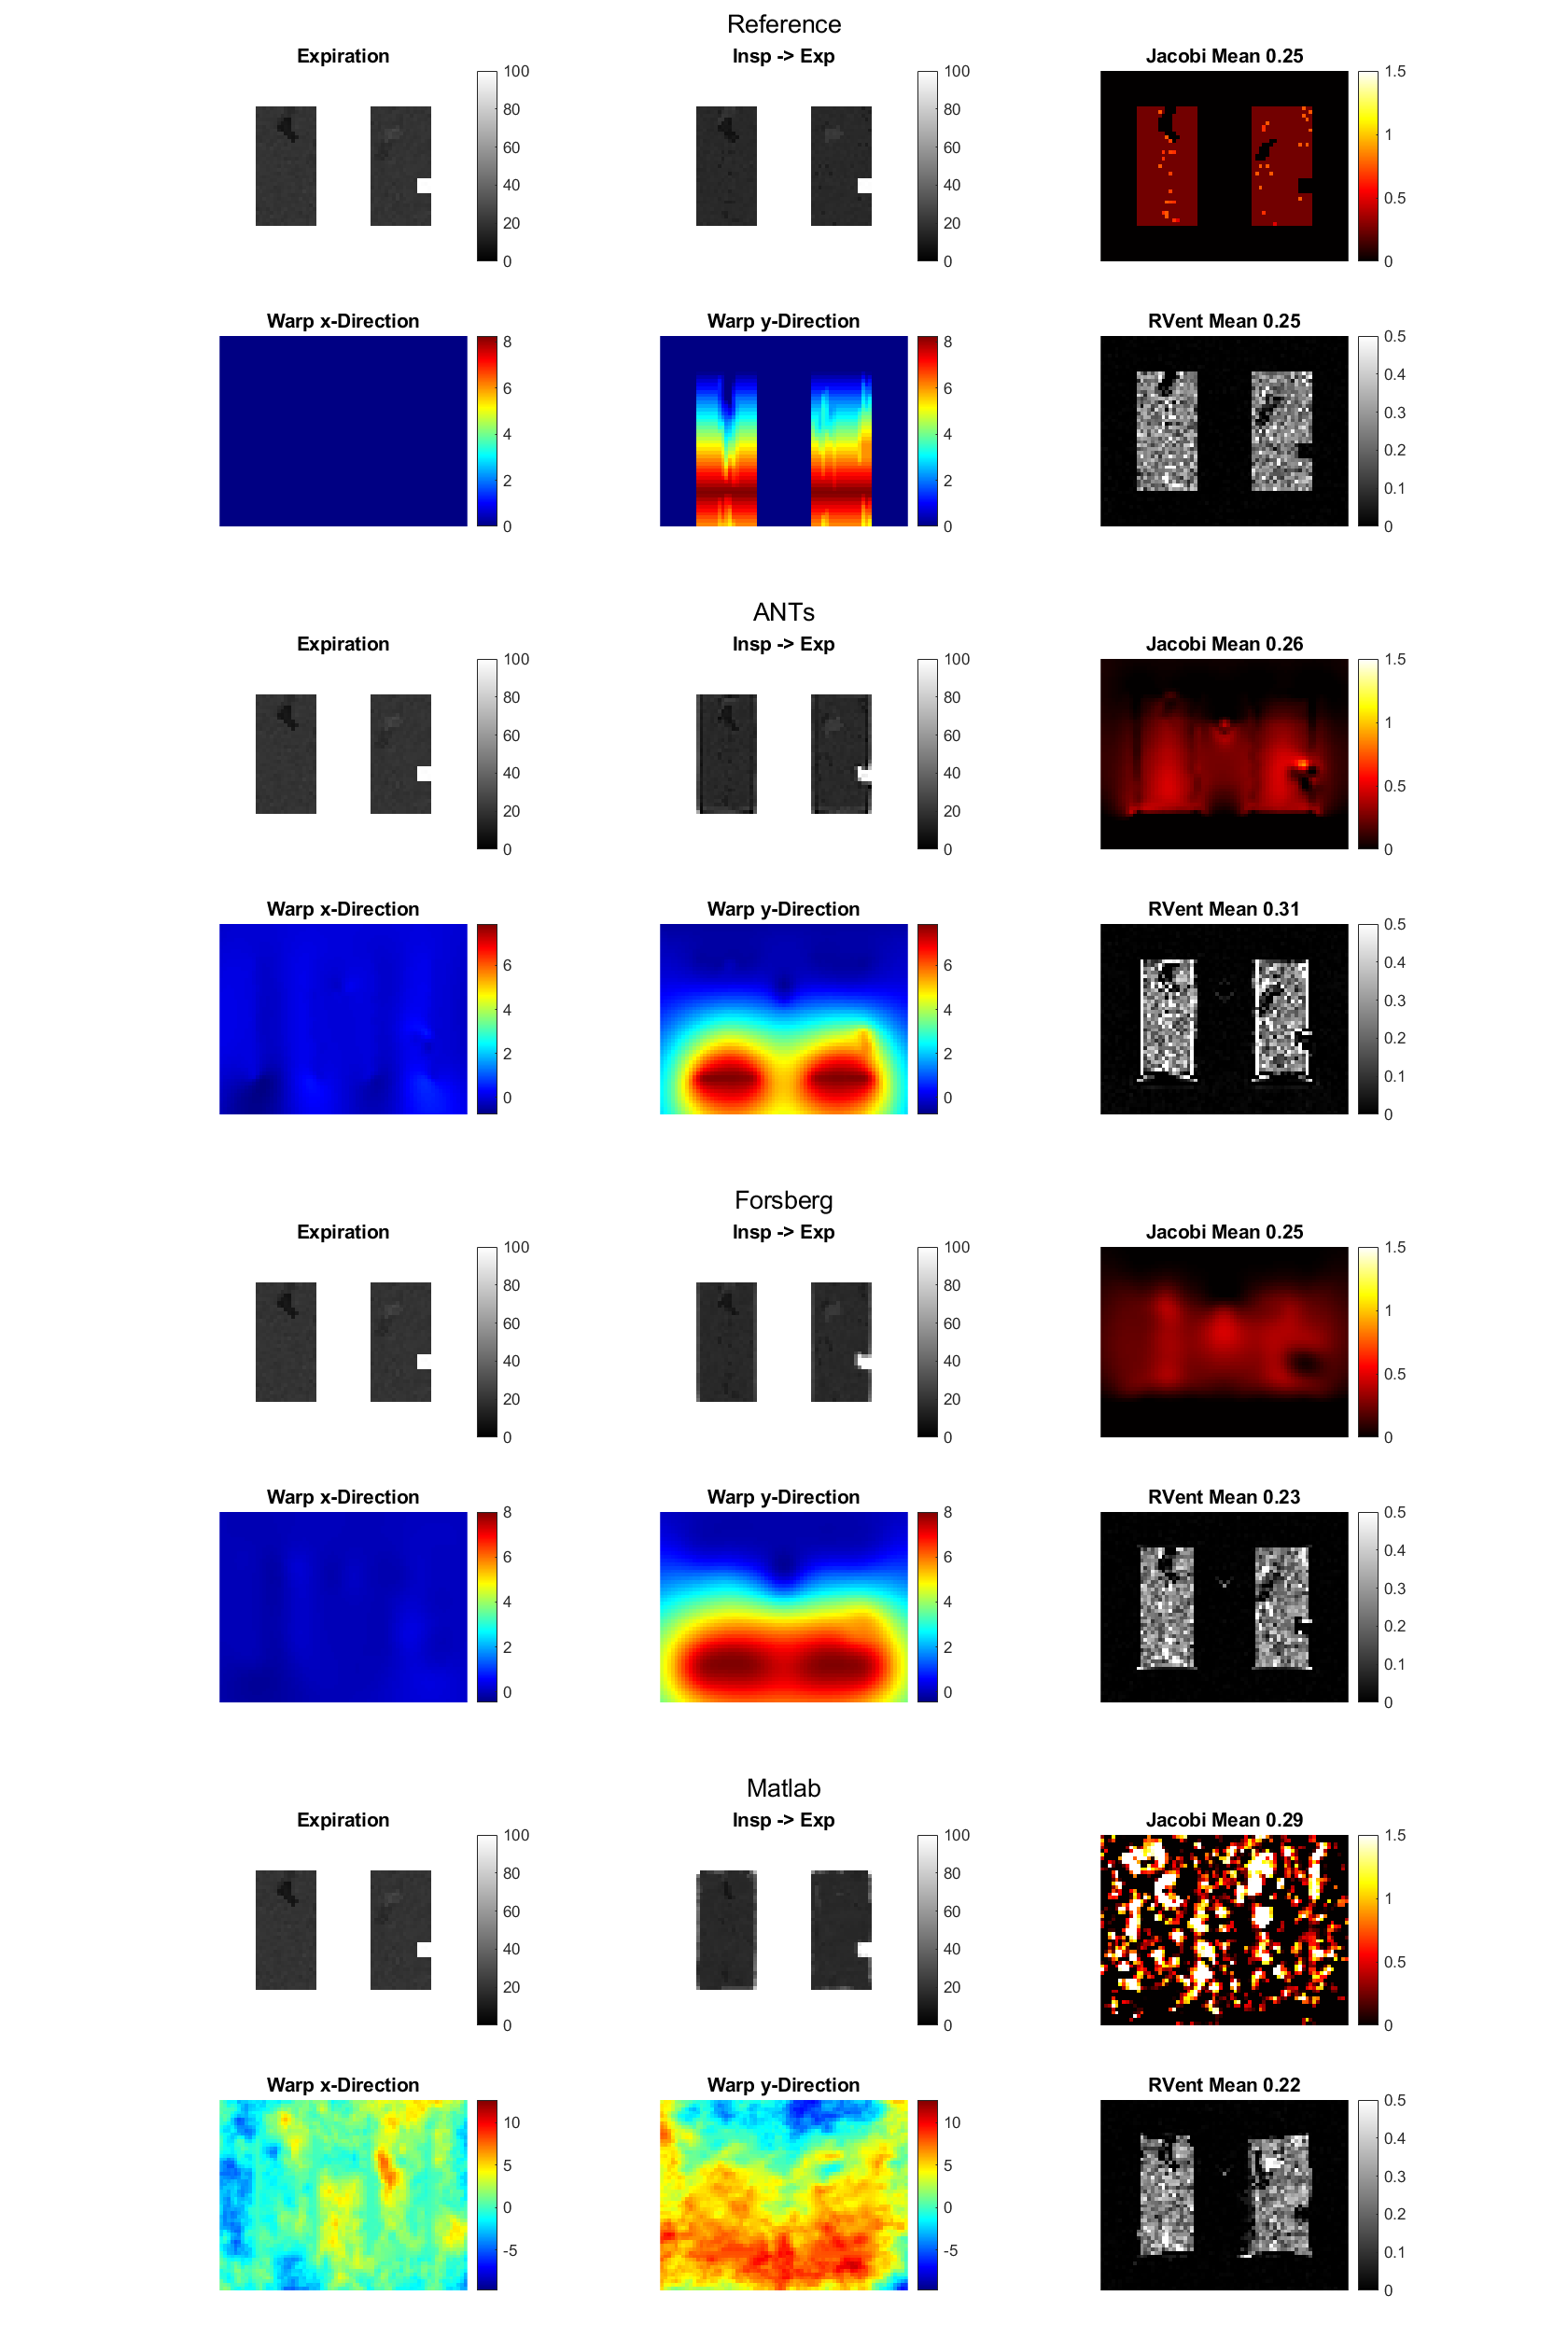
Figure 3: Summary of processing results, including expiration image, registered inspiration image (to expiration), Jacobi (J) determinant, regional Ventilation (RVent) and displacements of the registration in x- and y-direction. Please note that the J values (except for the reference J) only clearly reflect the infiltrate ventilation defect (VD). The average ventilation values are in the range of the expected 0.25 value derived from predefined expansion (1.25).
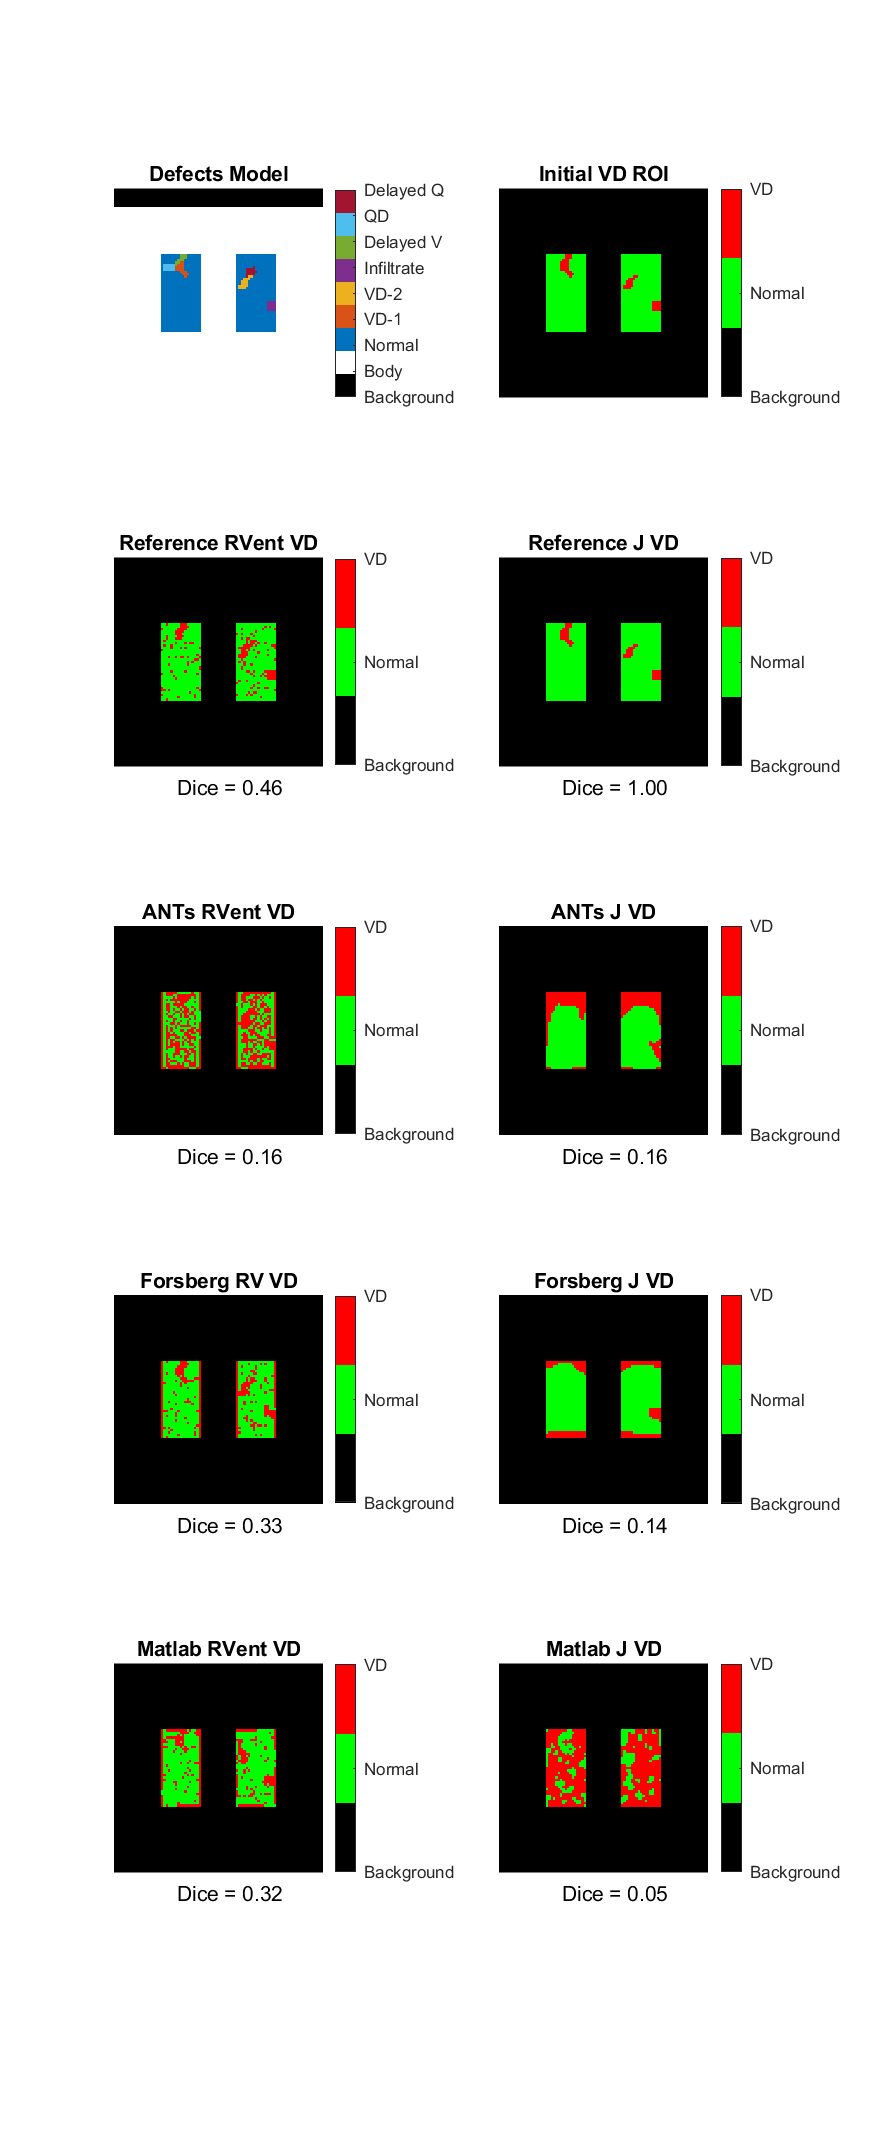
Figure 4: Analysis of VD obtained with RVent and J for different registrations using an adaptive threshold (90% percentile * 0.4)16. The first row provides the complete defects model (left) and summarized VD model (right). Dice values quantify the overlap of VD. Please note that only reference J reached a dice value of 1 in comparison to 0.46 of RVent. This can be explained by the noise, which is present in the signal model, but not included in the reference registration. The high amount of VD in ANTs RVent is probably due to edge artifacts, which increased the threshold.
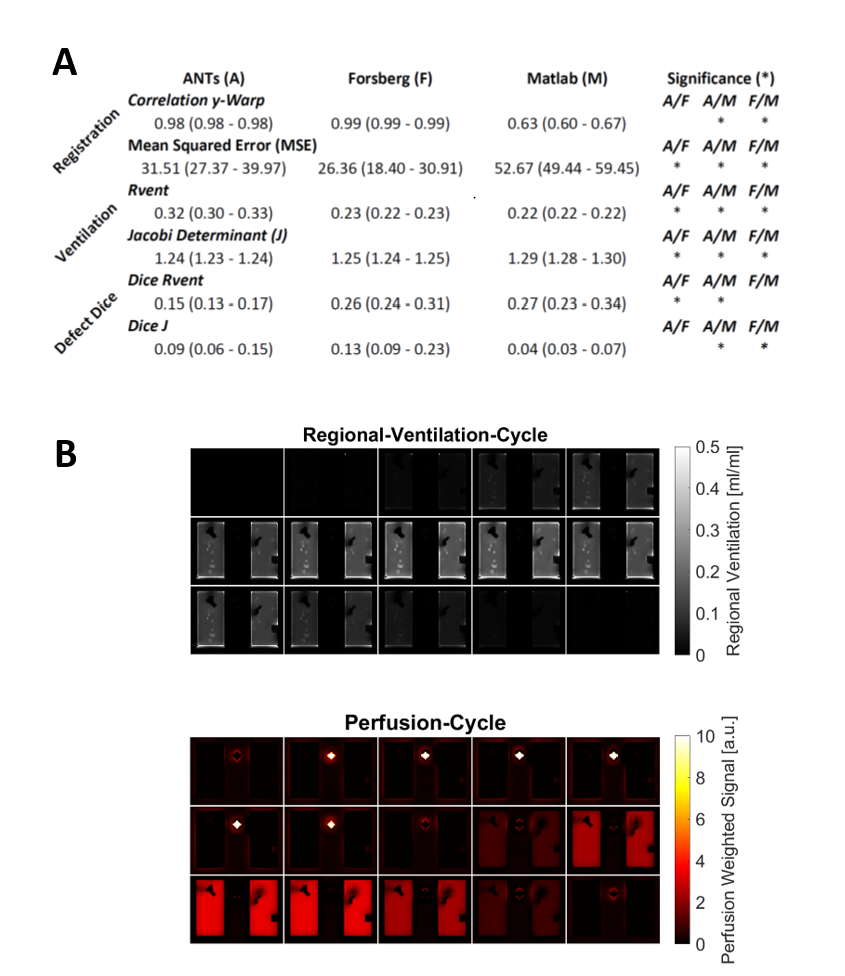
Figure 5: Part A: shows summary of statistics. Part B: Phase-resolved functional lung imaging (PREFUL) analysis of the whole model-TS registered with Forsberg. Please note the isolated perfusion defect (V/Q mismatch) in the upper right next to VD-2 and the slow normalization of the region with delayed ventilation defect on the regional ventilation cycle data. The bright spot in the middle of the perfusion cycle is a vessel with phase shifted signal.