4819
Differentiating patients with asthma and/or chronic obstructive pulmonary disease using lung T1 and M01POLARIS, University of Sheffield MRI Unit, IICD, The University of Sheffield, Sheffield, United Kingdom, 2Priory Medical Group, York, United Kingdom, 33BioPharmaceuticals Medical, AstraZeneca, Gothenburg, Sweden, 4Early Development Respiratory, AstraZeneca, Cambridge, United Kingdom
Synopsis
Keywords: Lung, Lung
Directing treatment based on diagnosis is important in patients suffering with respiratory disease. This work investigated the ability of whole-lung mean T1 and M0, and measures of heterogeneity (median coefficient of variation and its interquartile range) to differentiate between patients with asthma and/or COPD and correlated these metrics with 129Xe ventilation and diffusion MRI and pulmonary function test metrics. Measures of heterogeneity of T1 and M0 correlated with lung function test outcomes and sensitive measures of lung function derived from 129Xe MRI and had the ability to separate patients with asthma+COPD and COPD from patients with asthma alone.Introduction
Airways disease often shares features of both asthma and COPD1. 129Xe MRI is a highly sensitive imaging technique2, 3 which has shown utility in distinguishing these diagnostic subgroups4. This work aimed to assess whether lung T1 and the associated proton spin density (M0), and measures of heterogeneity could distinguish between patients with asthma and/or COPD, and whether they correlated with pulmonary function test (PFT) and 129Xe MRI metrics4.Methods
165 patients (aged 28-82 years) with asthma and/or COPD taking part in the NOVELTY study5 (NCT02760329), were recruited from 2 primary care centres. Patients were divided into three groups (asthma, COPD and asthma+COPD) based on physician-assigned diagnosis.Imaging: Patients were scanned using a 1.5T whole body MRI system (GE HDx) and 8-element cardiac array coil. Spoiled gradient echo (SPGR) variable flip angle (VFA) images were acquired during four separate expiratory breath holds with flip angles (FAs) of 2°, 4°, 10° and 30°. HP 129Xe MRI was acquired and analysed as previously described6, 7 to generate: ventilation defect percentage (VDP), ventilation coefficient of variation (Xe-CV), mean apparent diffusion coefficient (ADC) and mean acinar dimension (LmD).
PFTs: Spirometry, gas transfer and multiple breath washout were performed on the same day as MRI. Forced expiratory volume in 1 second (FEV1), forced mid-expiratory flow (FEF25-75%), lung clearance index (LCI) and the transfer capacity of the lung for the uptake of carbon monoxide (TLCO) are reported here.
T1 and M0 image analysis: The VFA image with FA=4° was the target image to which all other VFA images were co-registered using ANTs8. The same image was segmented semi-automatically using ITK-SNAP9 to exclude major vessels. T1 and M0 were calculated by fitting the signal to the SPGR equation10. Mean and standard deviation (SD) of T1 and M0 and the heterogeneity (median CV and interquartile range CV (IQR CV))11 were calculated.
Statistical analysis: One-way ANOVA or Kruskal-Wallis test with multiple comparison correction assessed differences between groups and Spearman’s correlations12 were performed between proton MRI and 129Xe MRI / PFT output, with the Bonferroni-Dunn method applied for multiple comparisons.
Results
165 patients were scanned. 16 patients were excluded for a lack of analysable VFA imaging (n=4) or having a whole lung mean T1>1500ms13 (n=12). Of the remaining 149 patients, 76 patients had asthma, 50 had asthma+COPD and 23 had COPD.Mean T1 and M0 were higher in patients with asthma when compared to patients with asthma+COPD (p<0.0001 for both) and COPD (p=0.0191 and p=0.0107, respectively) (Figure 1). M0 SD was higher in patients with asthma when compared to patients with asthma+COPD (p<0.0001) and COPD (p=0.0235).
Patients with asthma had lower median CV T1 than patients with asthma+COPD (p=0.0011) and COPD (p=0.0003) (Figure 2) and lower T1 IQR CV than patients with asthma +COPD (p=0.0110) and COPD (p=0.0034). Patients with asthma had lower median CV M0 than patients with asthma+COPD (p<0.0001) and COPD (p<0.0001) and lower M0 IQR CV than patients with asthma+COPD (p=0.0056) and COPD (p=0.0003). Figure 3 shows representative images from each patient cohort, where patients with asthma+COPD and COPD have increased heterogeneity when compared to the patient with asthma.
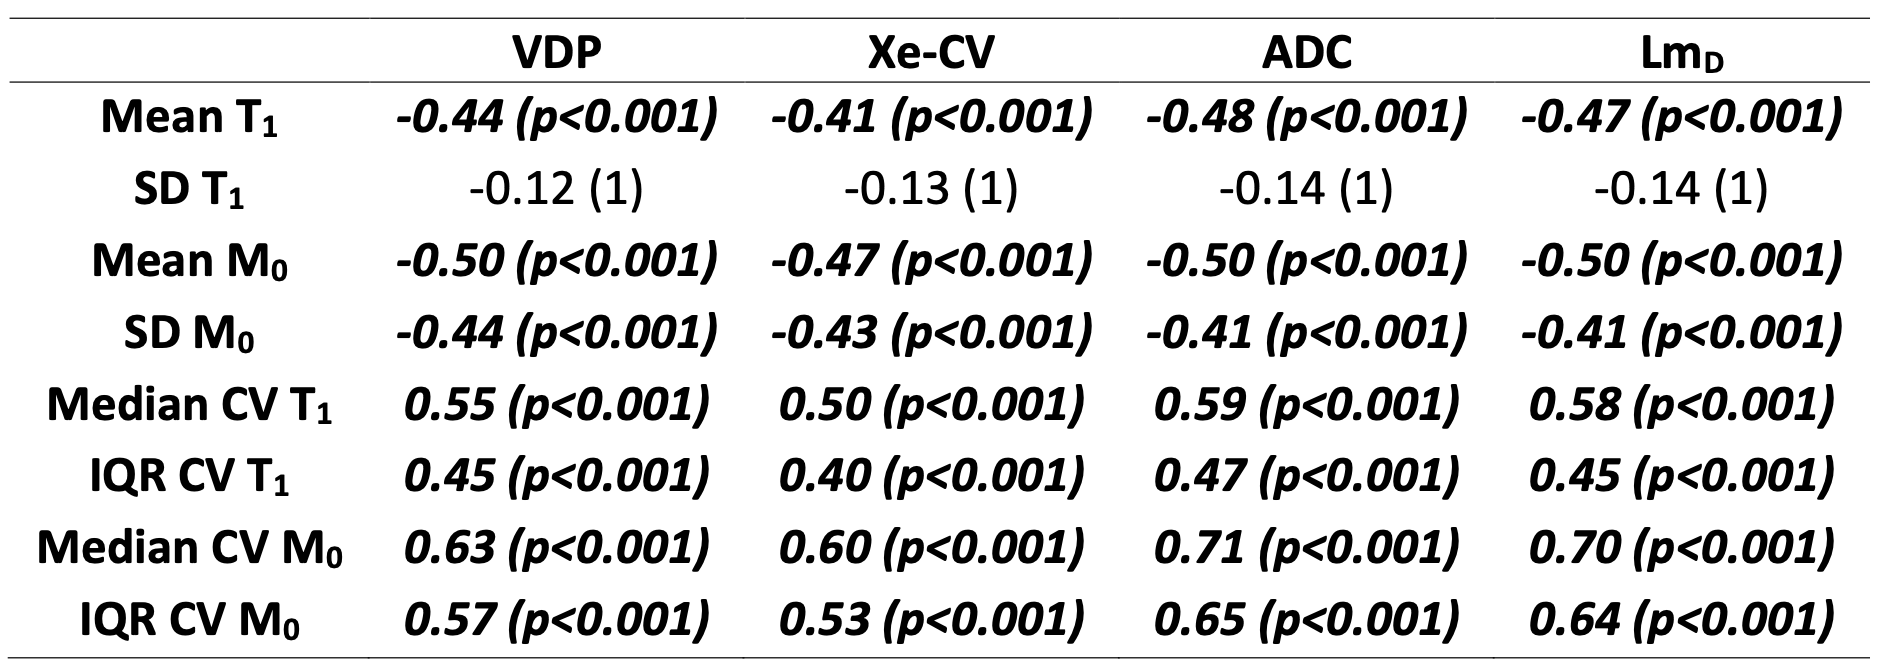
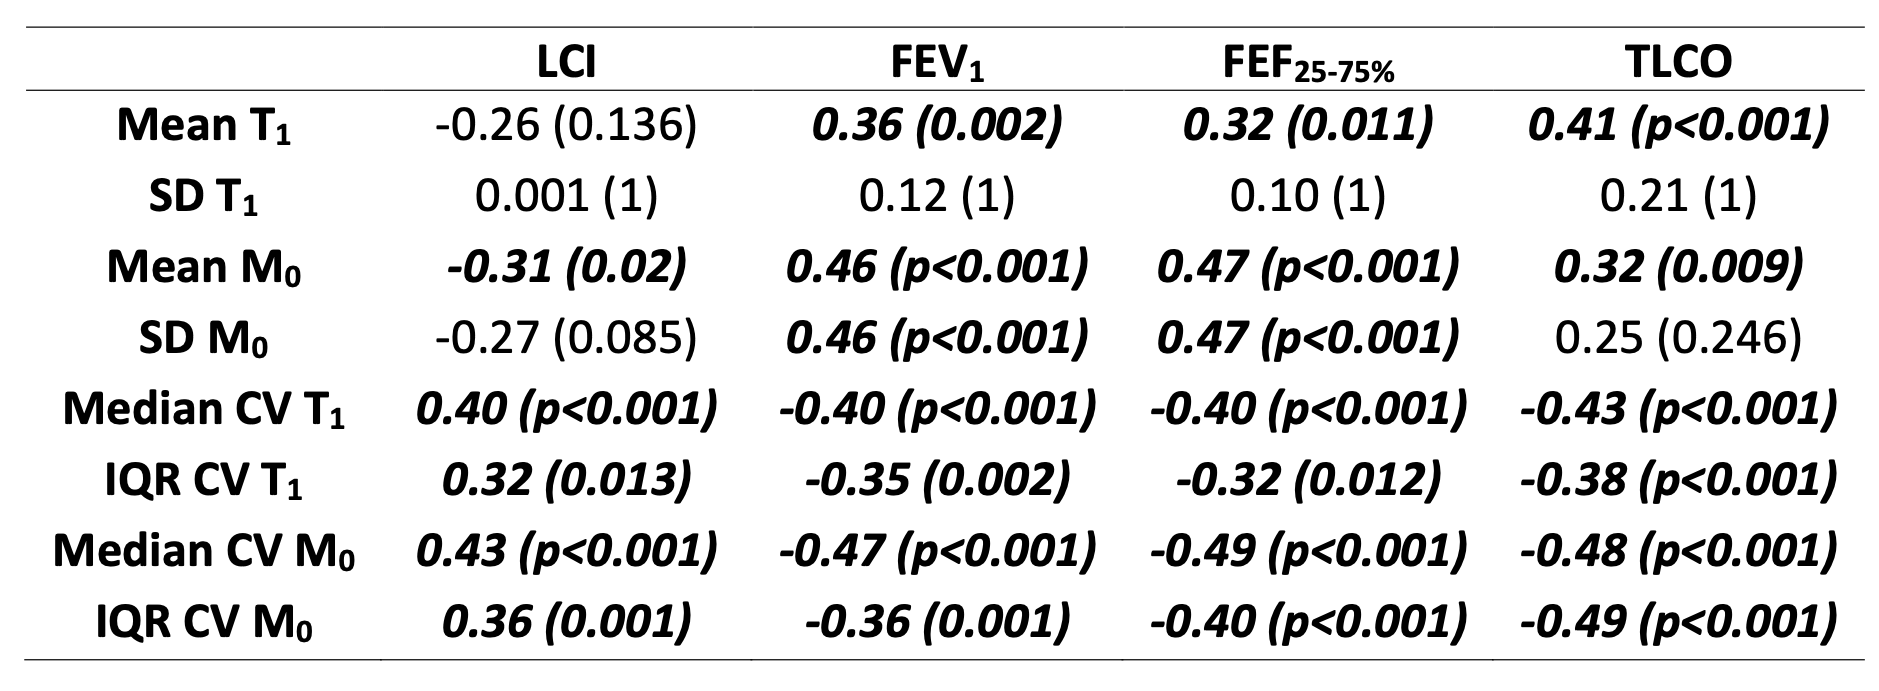
All T1 and M0 metrics (except SD T1) showed moderate-to-strong correlations with Xe-MRI ventilation, ventilation heterogeneity, ADC and LmD (Table 1). M0 median CV and M0 IQR CV had the strongest correlations with Xe-MRI metrics, with the highest correlation between M0 median CV and ADC. T1 and M0 metrics showed weak-to-moderate correlations with LCI, FEV1, FEF25-75% and TLCO (Table 2).
Discussion
Patients with asthma+COPD and COPD had reduced T1 and M0 when compared to patients with asthma. T1 and M0 displayed increased heterogeneity in patients with asthma+COPD and COPD14 when compared to those with asthma, with clearer trends between groups seen when considering the heterogeneity measures compared to mean and SD values. T1 and M0 decreased as ventilation heterogeneity and acinar dimensions increased, and FEV1 and TLCO worsened.The strong correlations between the M0 metrics and ADC are logical given M0 is representative of the lung tissue density and ADC represents an increase in the available air space for diffusion.
Neither T1 nor M0 metrics could distinguish patients with asthma+COPD from those with COPD, suggesting more sensitive biomarkers may be required4. The small number of patients with COPD when compared to asthma/asthma+COPD may contribute to this.
Whilst the variable flip angle method is a relatively quick (four ~14 second breatholds) acquisition strategy for T1 mapping of the whole lung, there was a moderate failure rate of 9.7% in this cohort, with a number of these failures resulting in physiologically unreasonable values of T113 and/or M0.
In conclusion, measures of heterogeneity of T1 and M0 correlate with PFTs and 129Xe MRI and have the ability to separate patients with asthma+COPD and COPD from patients with asthma.
Acknowledgements
This work was sponsored by AstraZeneca.
References
1. A. Senthilselvan and J. Beach, J. Asthma, 2019. 56(11): p. 1129-1137.
2. H. Marshall, et al., Prog Nucl Magn Reson Spectrosc, 2021. 122: p. 42-62.
3. R. L. Eddy and G. Parraga, Eur. Respir. J., 2019.
4. H. Marshall, et al., American Thoracic Society, A2175-A2175, 2022
5. H. K. Reddel, et al., ERJ open research, 2019. 5(1).
6. H. F. Chan, et al., Magn. Reson. Med., 2018. 79(6): p. 2986-2995.
7. G. T. Mussell, et al., ERJ open research, 2021. 7(3).
8. B. B. Avants, et al., Neuroimage, 2011. 54(3): p. 2033-2044.
9. P. A. Yushkevich, et al., Neuroimage, 2006. 31(3): p. 1116-1128.
10. H. L. M. Cheng and G. A. Wright, Magn. Reson. Med., 2006. 55(3): p. 566-574.
11. P. J. Hughes, et al., J. Appl. Physiol., 2018. 126(1): p. 183-192.
12. J. D. Evans,Straightforward statistics for the behavioral sciences,1996
13. O. Dietrich, et al., Eur. J. Radiol., 2017. 86: p. 252-260.
14. D. F. Alamidi, et al., COPD: Journal of COPD, 2016. 13(2): p. 153-159.
Figures
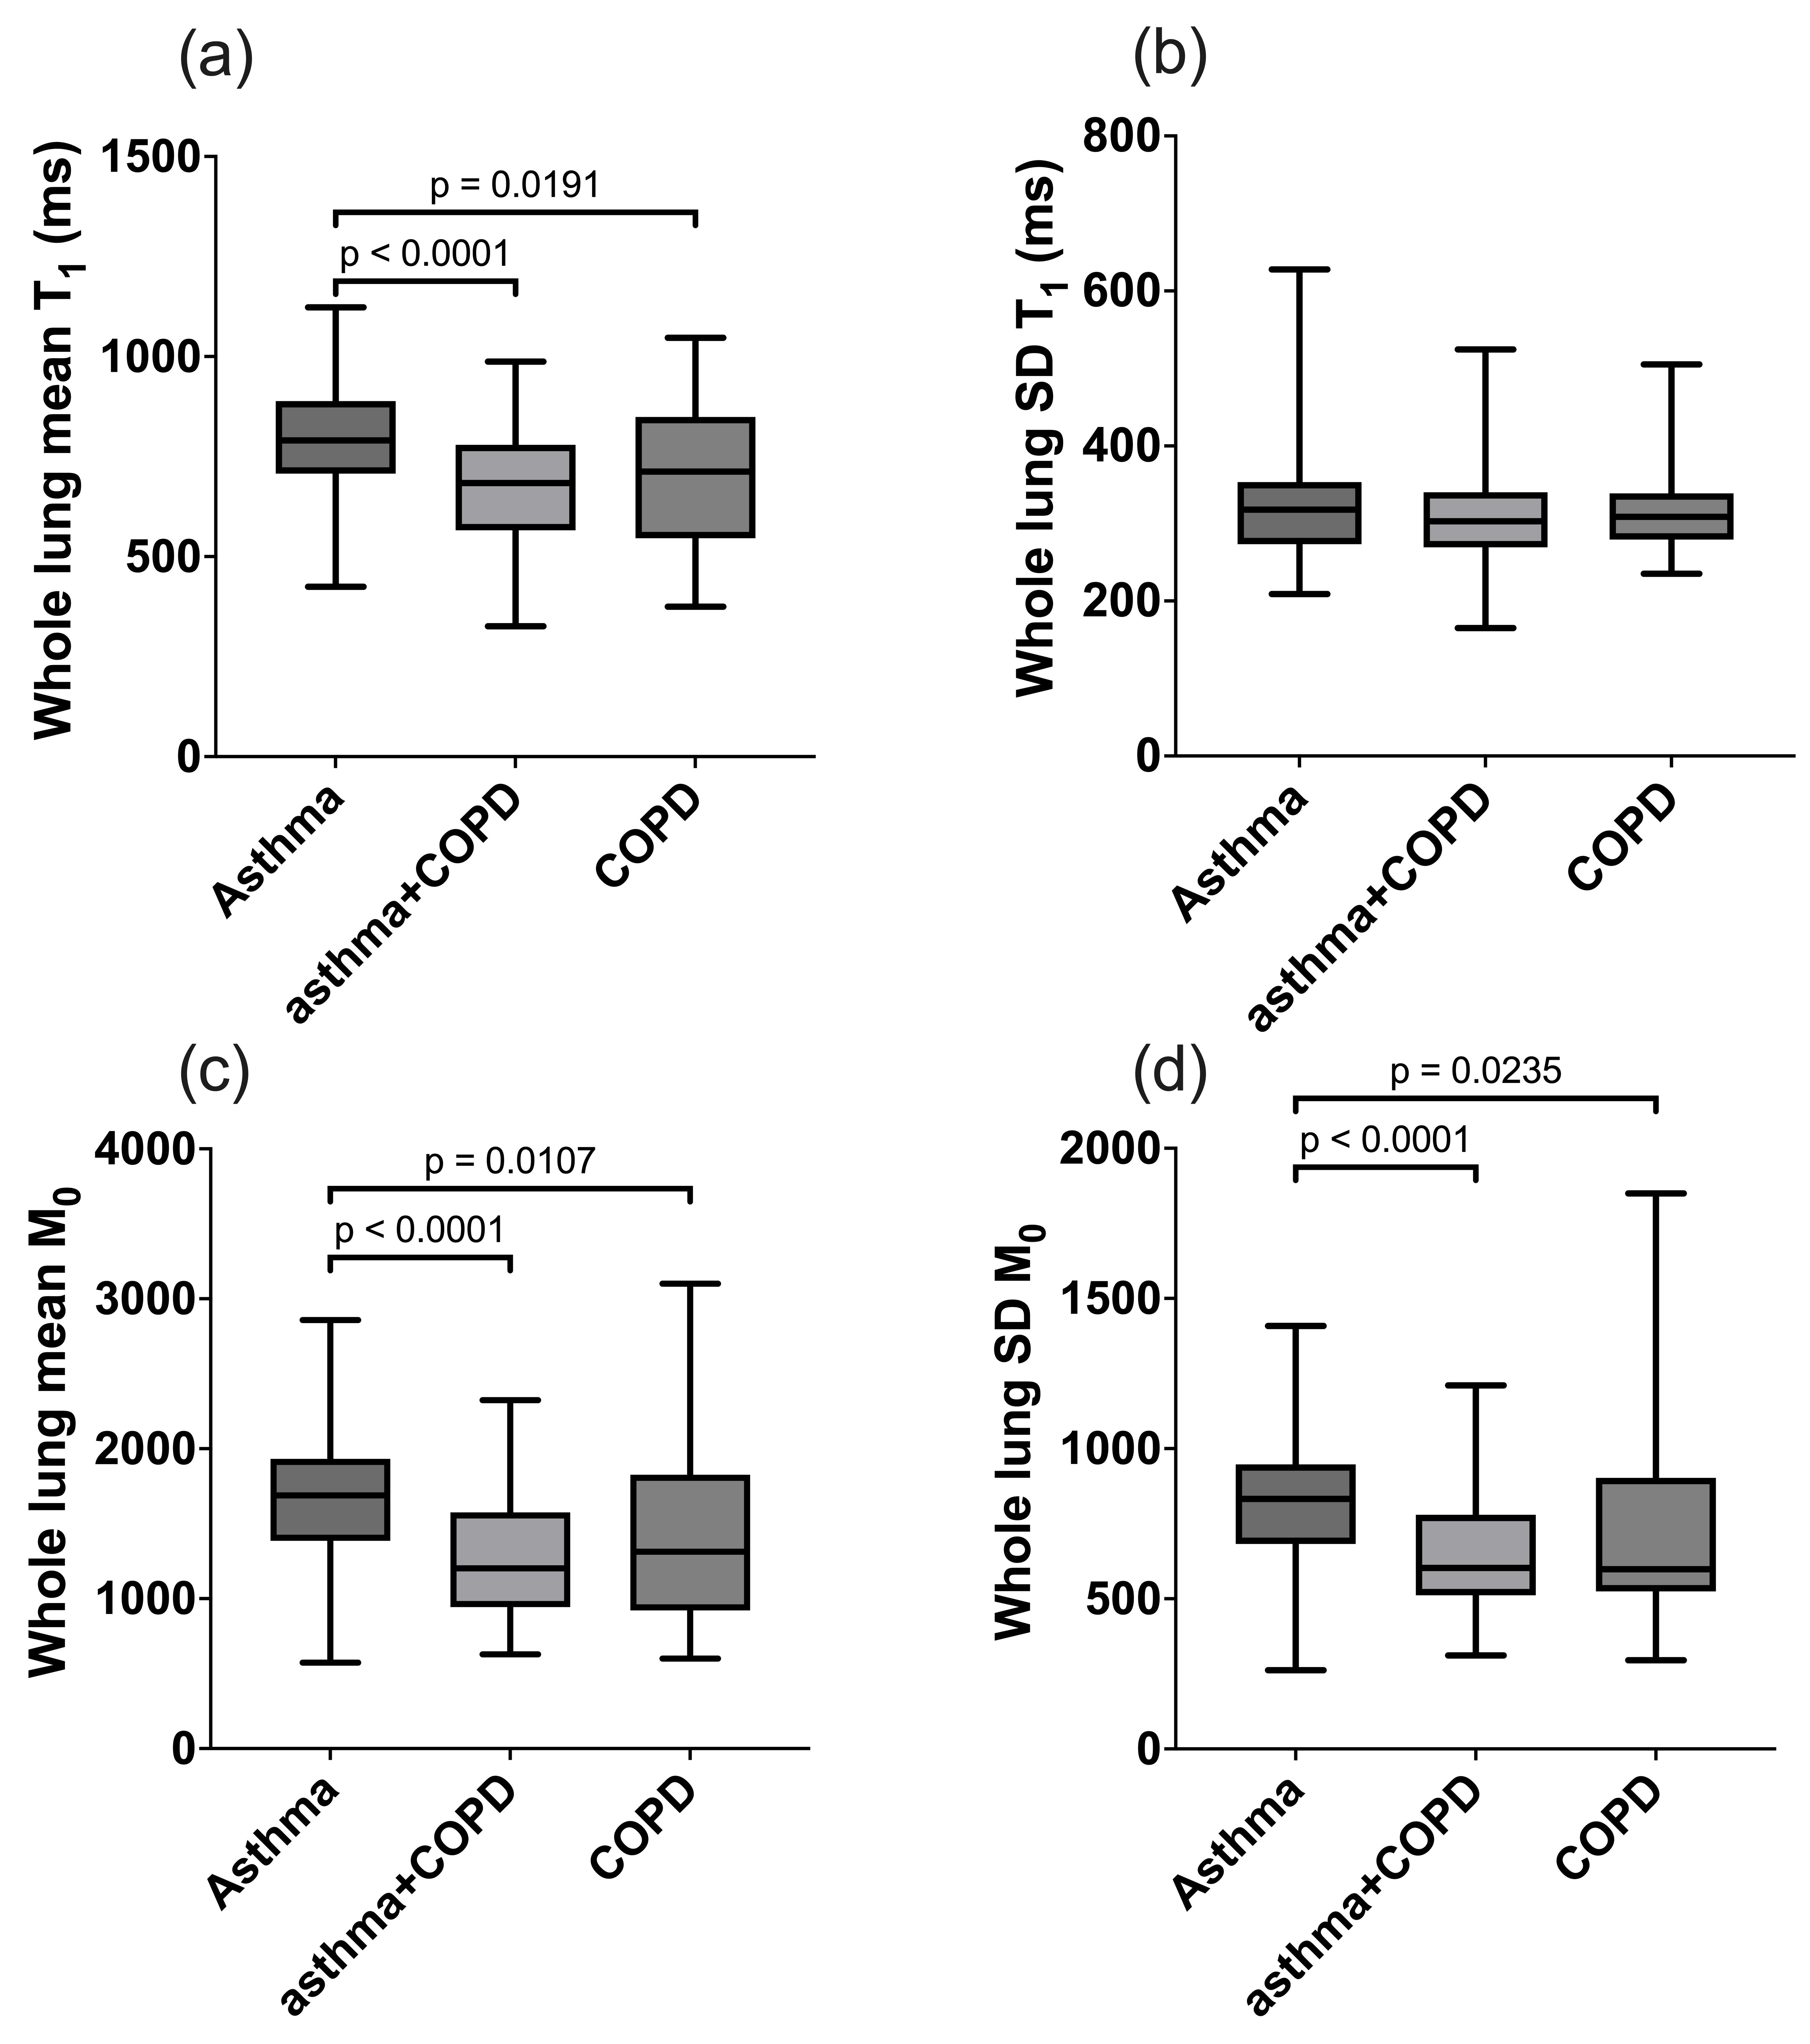
Figure 1 Box and whisker plots showing the mean, minimum and maximum values of the groups for (a) whole lung mean T1, (b) whole lung standard deviation (SD) T1, (c) Whole lung mean M0 and (d) whole lung SD M0. Only significant differences are shown.
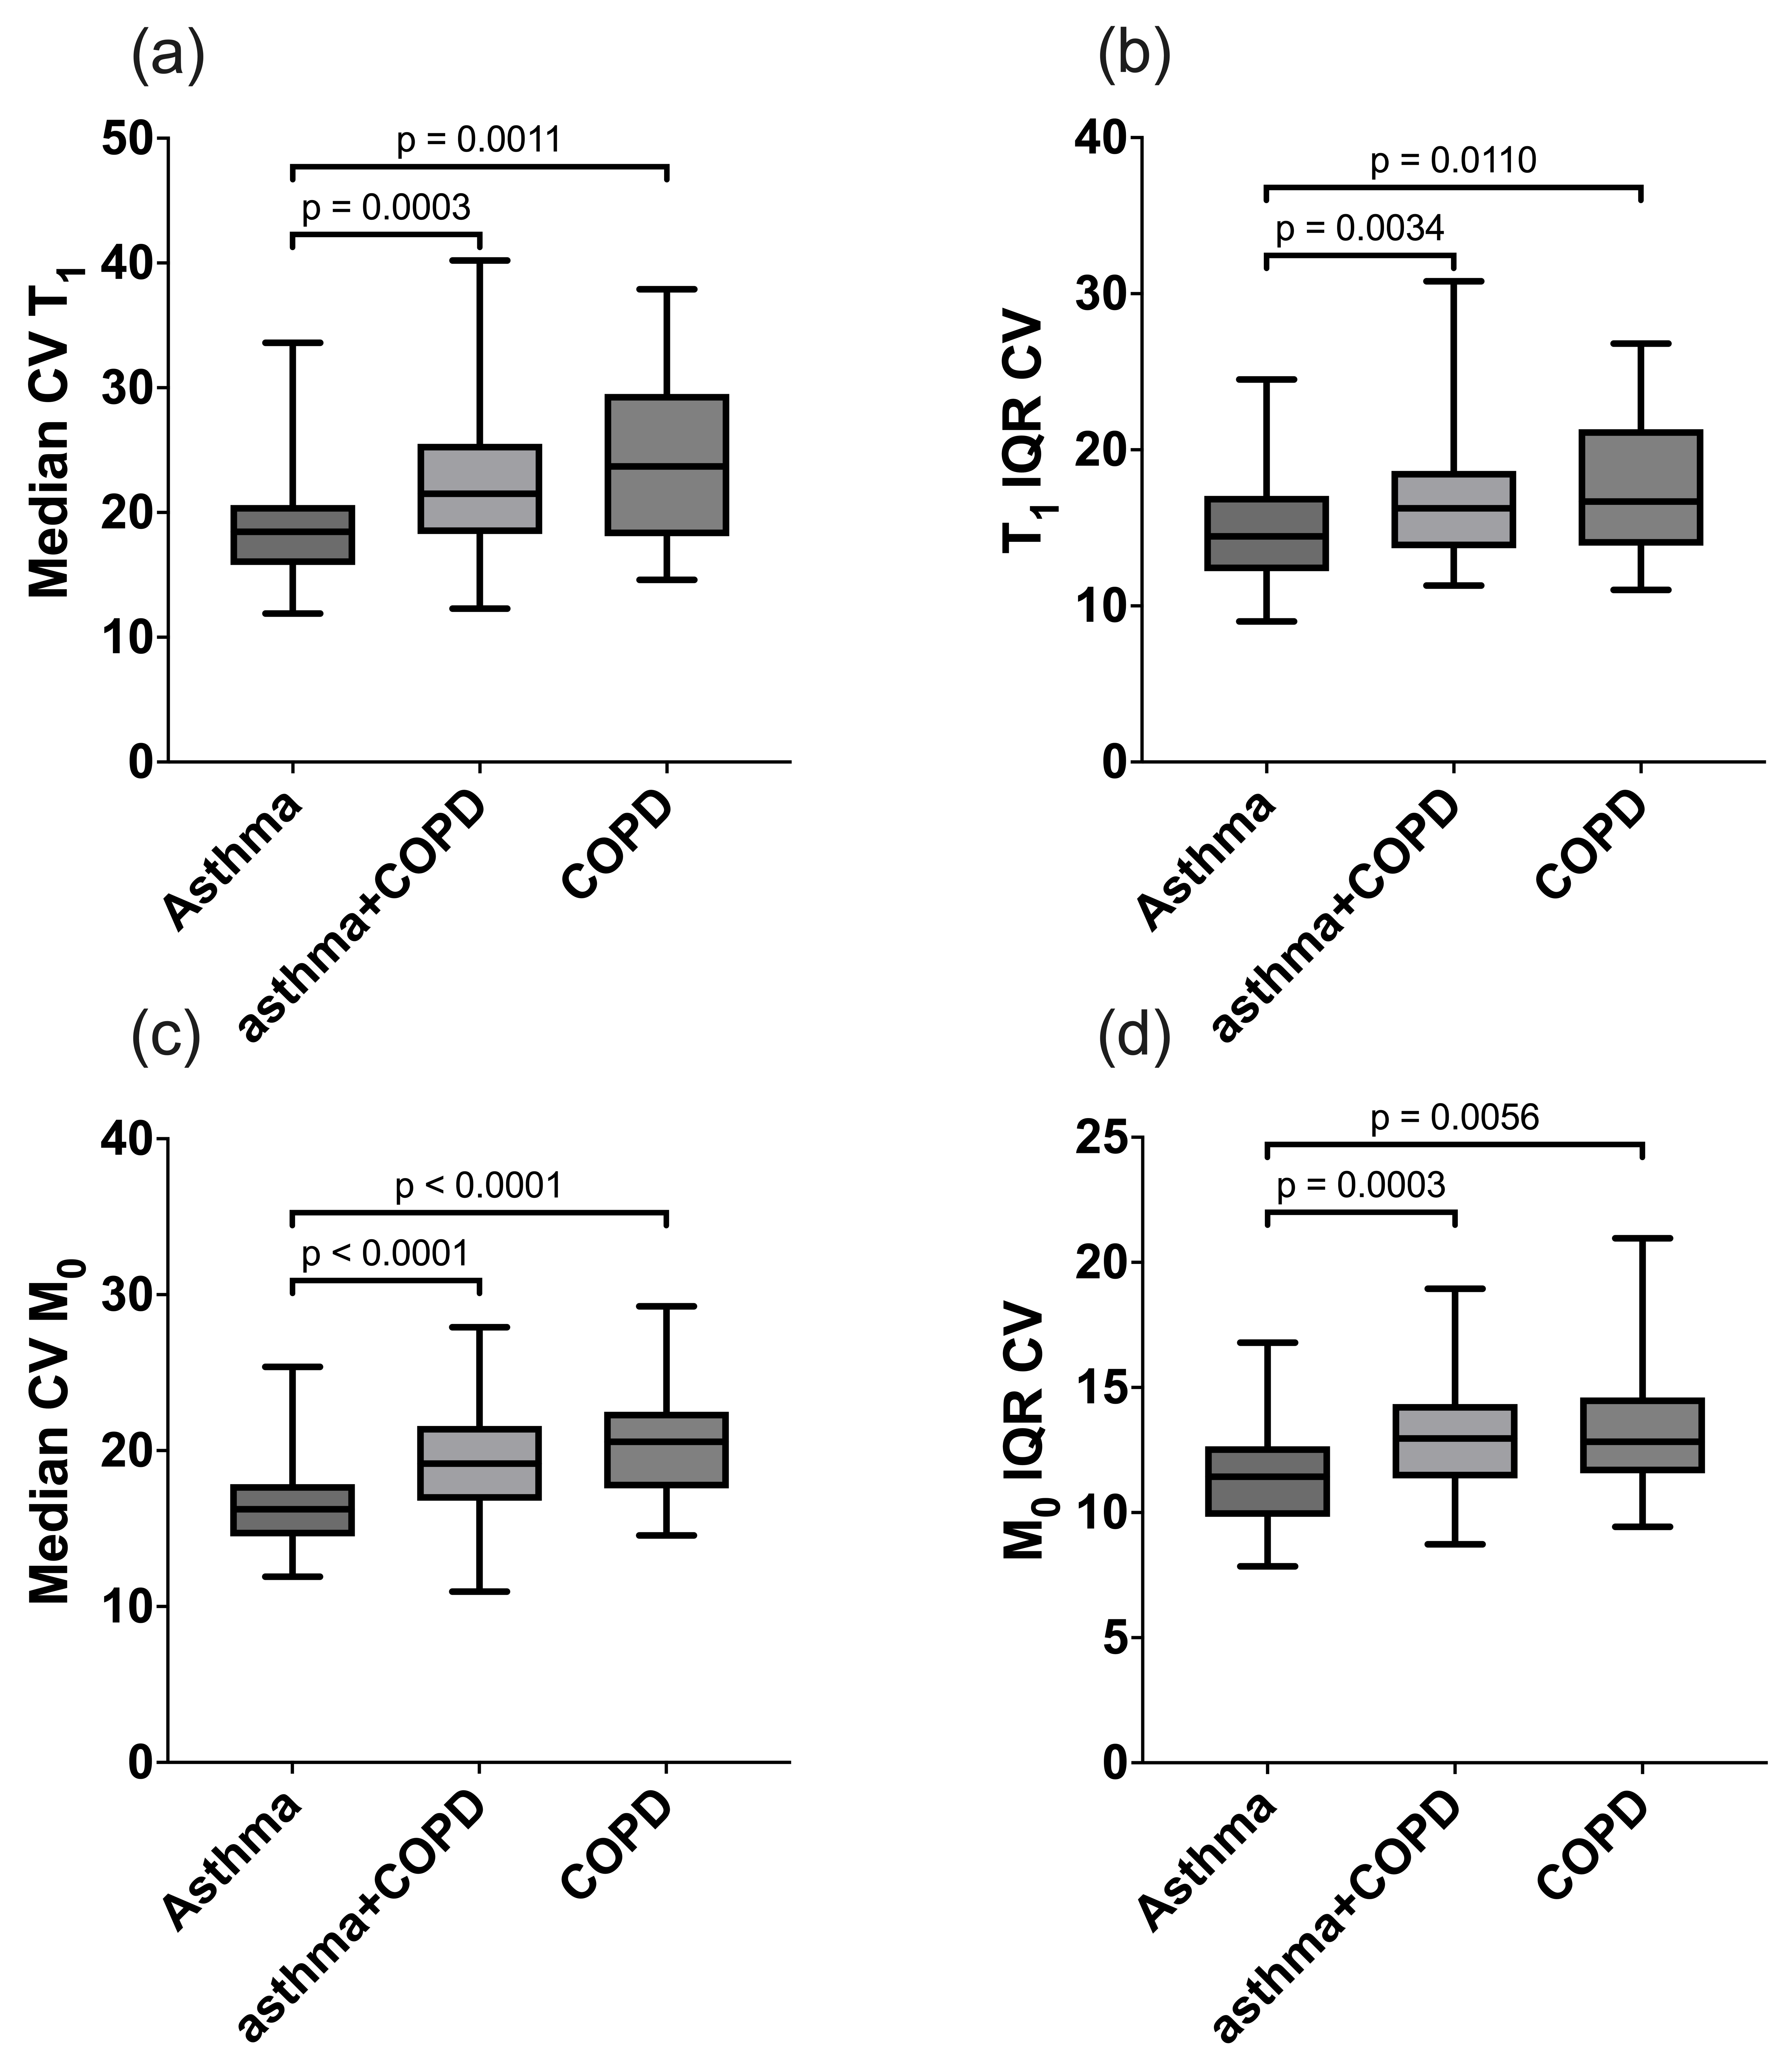
Figure 2 Box and whisker plots showing the mean, minimum and maximum values of the groups for (a) median coefficient of variation (CV) of T1, (b) T1 heterogeneity index, (c) median CV of M0 and (d) M0 heterogeneity index. Only significant differences are shown.
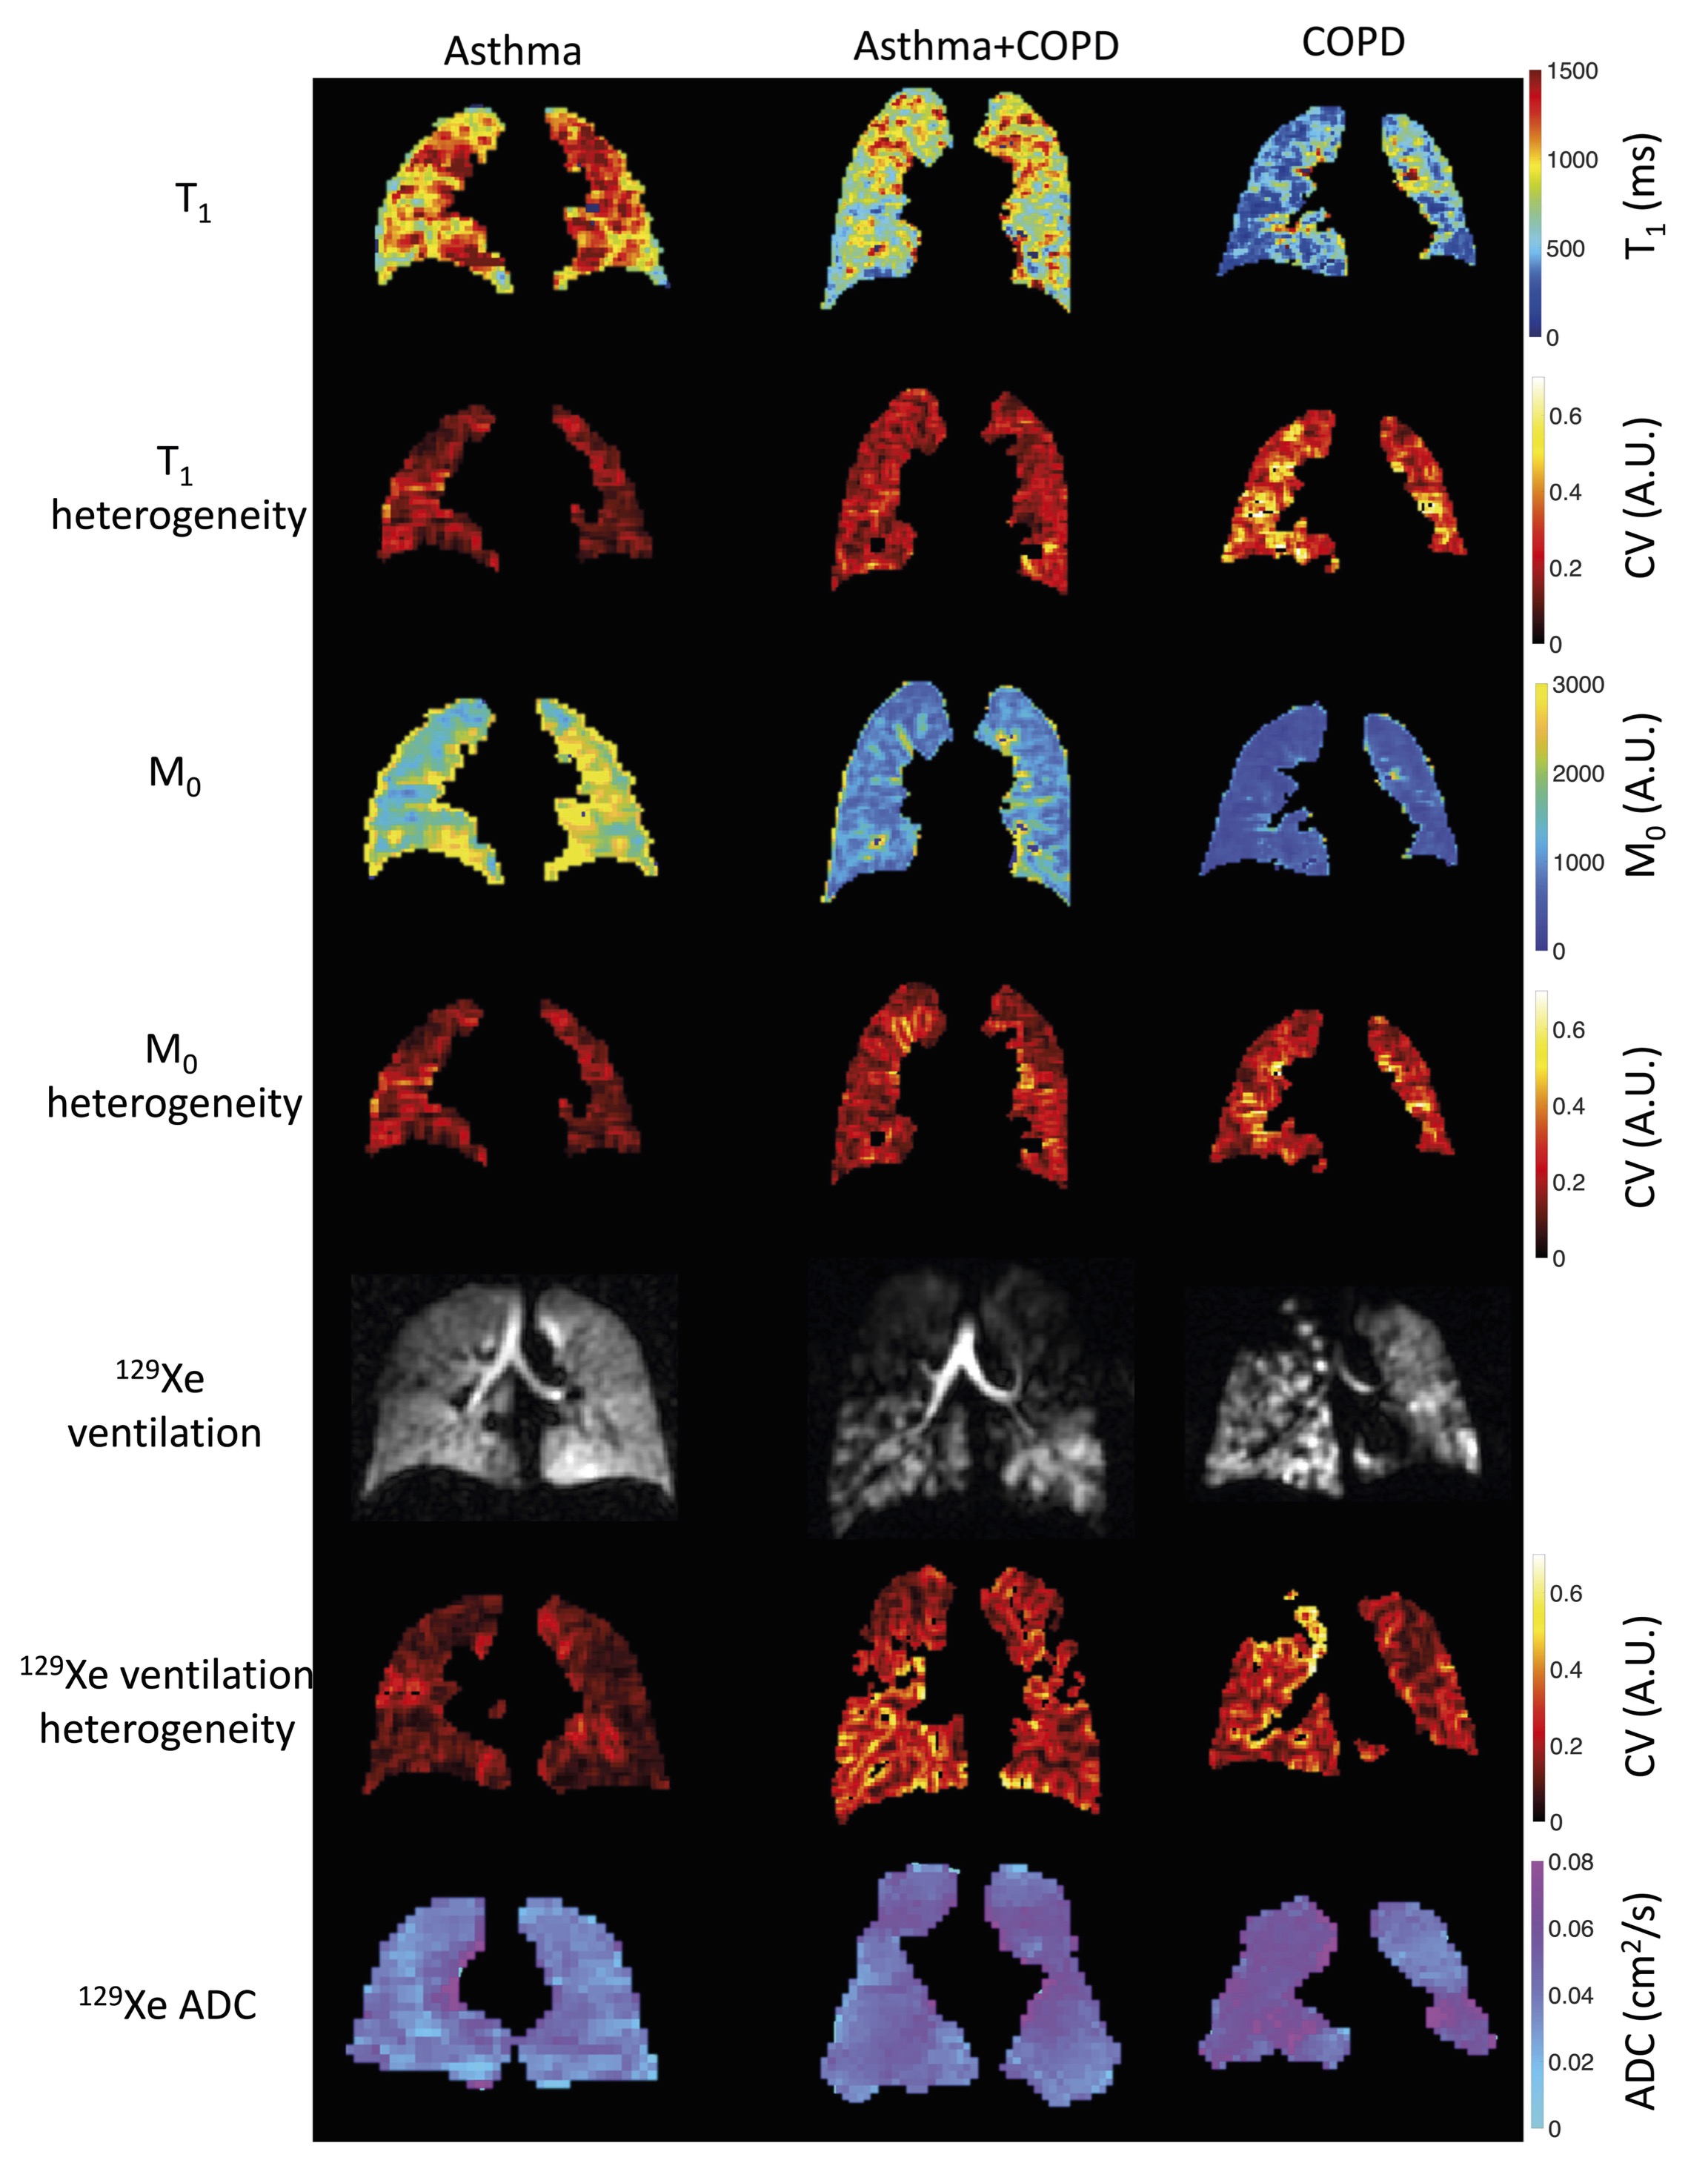
Figure 3 Example slices showing T1 and T1 heterogeneity maps (1st and 2nd rows), M0 and M0 heterogeneity maps (3rd and 4th rows), 129Xe ventilation and heterogeneity (5th and 6th row) and ADC (final row) from a representative patient from each of the groups studied