4811
Pipeline for Robust Functional Lung Imaging with Oxygen-Enhanced MRI (OE-MRI) and Independent Component Analysis (ICA)1Centre for Medical Image Computing (CMIC), Department of Medical Physics & Biomedical Engineering, University College London, London, United Kingdom, 2Bioxydyn Limited, Manchester, United Kingdom
Synopsis
Keywords: Oxygenation, Lung
Analysis of dynamic lung oxygen-enhanced MRI (OE-MRI) is challenging due to the presence of substantial artefacts and poor SNR. Understanding and minimising sources of error is critical for reliable use of the method. We have created a pipeline using independent component analysis (ICA) for the automatic extraction of functional lung information from dynamic lung OE-MRI, for which confounding factors are reduced. The pipeline demonstrated good repeatability when utilised for the analysis of a scan-rescan dynamic lung OE-MRI study at 3.0 T; the algorithmic uncertainty of ICA on the analysis pipeline was found to be minimal.
Introduction
The application of independent component analysis (ICA) to 3T dynamic lung oxygen-enhanced MRI (OE-MRI) with cyclic gas delivery enables the differentiation of the oxygen responses originating in lung tissue and oxygenated blood from artefactual signals, and has shown sensitivity to smoking status, suggesting likely sensitivity to pathology [1]. For future application in clinical studies, it is crucial to ensure that the method is repeatable. We present an analysis pipeline for the robust automatic extraction of functional information from dynamic lung OE-MRI.Methods
8 healthy non-smoker volunteers (mean age 30 years) were scanned twice within a 4–6-week interval (mean 5 weeks) using a 2D coronal multi-slice dual-echo RF-spoiled gradient echo (T1-FFE) sequence on a 3T Philips Ingenia [1,2] (Figure 1A for sequence details). The delivery of medical air and 100 % oxygen followed a cyclic scheme as shown in Figure 1A [1].Processing of the dynamic MRI series included non-rigid motion correction using NiftyReg [3]. Thoracic cavity and lung masks were created by manual segmentation using ImageJ [4] (Figure 1B).
Figure 1C presents the ICA analysis pipeline which was applied separately to each echo. Temporal ICA was applied across thoracic masked slices of the dynamic image series using scikit-learn FastICA [5,6]. The number of independent components included in the analysis can affect the form of the resulting components, and determination of the optimum number of components for ICA to find is in general an unsolved problem. We used correlation analysis to simultaneously identify the ICA component relating to the oxygen-enhancement signal (referred to as the “OE ICA component”) and the number of ICA components to use.
ICA was repeatedly run using an increasing number of independent components from 22 to 72 (51 separate instances). The lower limit of 22 components was chosen as initial experiments showed this lower limit enabled reliable extraction of the OE component by ICA. The Spearman correlation coefficient of a synthetic input function (Figure 1C) to every component from all runs of the ICA instances was calculated using SciPy [7]. The optimal OE ICA component was identified as the component with the greatest correlation with the input function. The OE ICA component was reconstructed and the oxygen-induced percentage signal enhancement (PSE) of the reconstructed OE ICA component was calculated.
Bland-Altman plots and two-way single measure mixed-effects model intra-class correlation coefficient (ICC) with absolute agreement [8,9] were generated to assess repeatability for the median lung OE ICA component PSE values from repeated scans. ICC statistical analysis was performed using IBM SPSS 28.0; ICC > 0.75 was taken to indicate good repeatability [10]. The repeatability of ICA within the pipeline was separately examined by a repeat application of the pipeline to the acquired OE-MRI scans. Bland-Altman analysis and ICC were again calculated.
Results
One subject was excluded due to the presence of substantial diaphragm ghosts in the second scan. The ICA analysis pipeline successfully extracted the OE ICA component for all included subjects. Figure 2 presents good scan-rescan repeatability (ICC of 0.807 for echo 1 and 0.907 for echo 2) with non-significant biases of -0.085 % (echo 1) and -0.023 % (echo 2). The OE ICA component PSE maps produced by the ICA analysis pipeline exhibit sensitivity to the opposite enhancements of oxygenated blood versus lung tissue (Figure 3), which occur at 3T using the OE-MRI method we have developed (due to the dominance of T1 effects versus T2* effects, respectively [1,2]). The repeat application of the ICA analysis pipeline displayed greater repeatability than the scan-rescan analysis (Figure 4, ICC of 0.926 for echo 1 and 0.958 for echo 2) with non-significant biases of -0.075 % (echo 1) and -0.240 % (echo 2).Discussion
Random initialisation of ICA may result in convergence at a local optimum rather than the global optimum producing variations of components – known as algorithmic uncertainty [11,12]. However, the greater ICC, reduced limits of agreement, and improved repeatability coefficient, demonstrate that algorithmic uncertainty is a small component of the overall variance of the ICA OE-MRI experiment. The remaining variance in the scan-rescan study may be due to physiological variation, patient positioning, motion, and noise. Future work will evaluate the reproducibility of the spatial and temporal PSE distributions between scans and within the ICA pipeline, prior to application to subjects with pathologies. Overall, the scan-rescan ICC values indicate good repeatability and suggests that the approach is likely to be suitable for assessment of cross-sectional and longitudinal differences.Conclusion
We have created an ICA pipeline to automatically extract functional information from dynamic lung OE-MRI, enabling the separation of the parenchymal and vascular oxygen-response from confounding factors. The pipeline demonstrates good repeatability when applied to dynamic lung OE-MRI acquired at 3T using a dual-echo gradient echo sequence and a cyclic gas delivery scheme.Acknowledgements
This work is supported by the EPSRC-funded UCL Centre for Doctoral Training in Medical Imaging (EP/L016478/1), by the Cancer Research UK National Cancer Imaging Translational Accelerator (NCITA) award C1519/A28682, and by Innovate UK award 104629. Many thanks to Lucy Caselton and Sumandeep Kaur for their help in acquiring the MR scans.References
1. S. H. Needleman et al., “Functional Lung MRI at 3.0 T using Oxygen-Enhanced MRI (OE-MRI) and Independent Component Analysis (ICA),” Int. Soc. Magn. Reson. Med., p. 0658, 2022.
2. M. Kim et al., “Oxygen-enhanced MRI of the lung at 3 tesla: R2* contrast in smokers and non-smokers,” Int. Soc. Magn. Reson. Med., p. 1481, 2022.
3. Modat, et al. (2010). Fast free-form deformation using graphics processing units. Computer Methods And Programs In Biomedicine,98(3), 278–284. doi:10.1016/j.cmpb.2009.09.002.
4. C. A. Schneider, W. S. Rasband, and K. W. Eliceiri, “NIH Image to ImageJ: 25 years of image analysis,” Nat. Methods, vol. 9, no. 7, pp. 671–675, 2012, doi: 10.1038/nmeth.2089.
5. F. Pedregosa et al., “Scikit-learn: Machine Learning in Python,” J. Mach. Learn. Res., vol. 12, no. 85, pp. 2825–2830, 2011, [Online]. Available: http://jmlr.org/papers/v12/pedregosa11a.html.
6. A. Hyvärinen and E. Oja, “A Fast Fixed-Point Algorithm for Independent Component Analysis,” Neural Comput., vol. 9, pp. 1483–1492, 1997.
7. P. Virtanen et al., “SciPy 1.0: Fundamental Algorithms for Scientific Computing in Python”, Nature Methods, vol. 17, no. 3, pp. 261-272, 2020, doi: 10.1038/s41592-019-0686-2.
8. M. Bland, An introduction to medical statistics. Oxford university press, 2015.
9. D. L. Raunig et al., “Quantitative imaging biomarkers: A review of statistical methods for technical performance assessment,” Stat. Methods Med. Res., vol. 24, no. 1, pp. 27–67, Jun. 2014, doi: 10.1177/0962280214537344.
10. T. K. Koo and M. Y. Li, “A Guideline of Selecting and Reporting Intraclass Correlation Coefficients for Reliability Research,” J. Chiropr. Med., vol. 15, no. 2, pp. 155–163, Jun. 2016, doi: 10.1016/j.jcm.2016.02.012.
11. A. Hyvärinen, “Independent component analysis: recent advances,” Phil. Trans. R. Soc, A.3712011053420110534, 2013. http://doi.org/10.1098/rsta.2011.0534Him
12. J. Himberg et al., "Icasso: software for investigating the reliability of ICA estimates by clustering and visualization," 2003 IEEE XIII Workshop on Neural Networks for Signal Processing (IEEE Cat. No.03TH8718), pp. 259-268, 2003. doi: 10.1109/NNSP.2003.1318025.
Figures
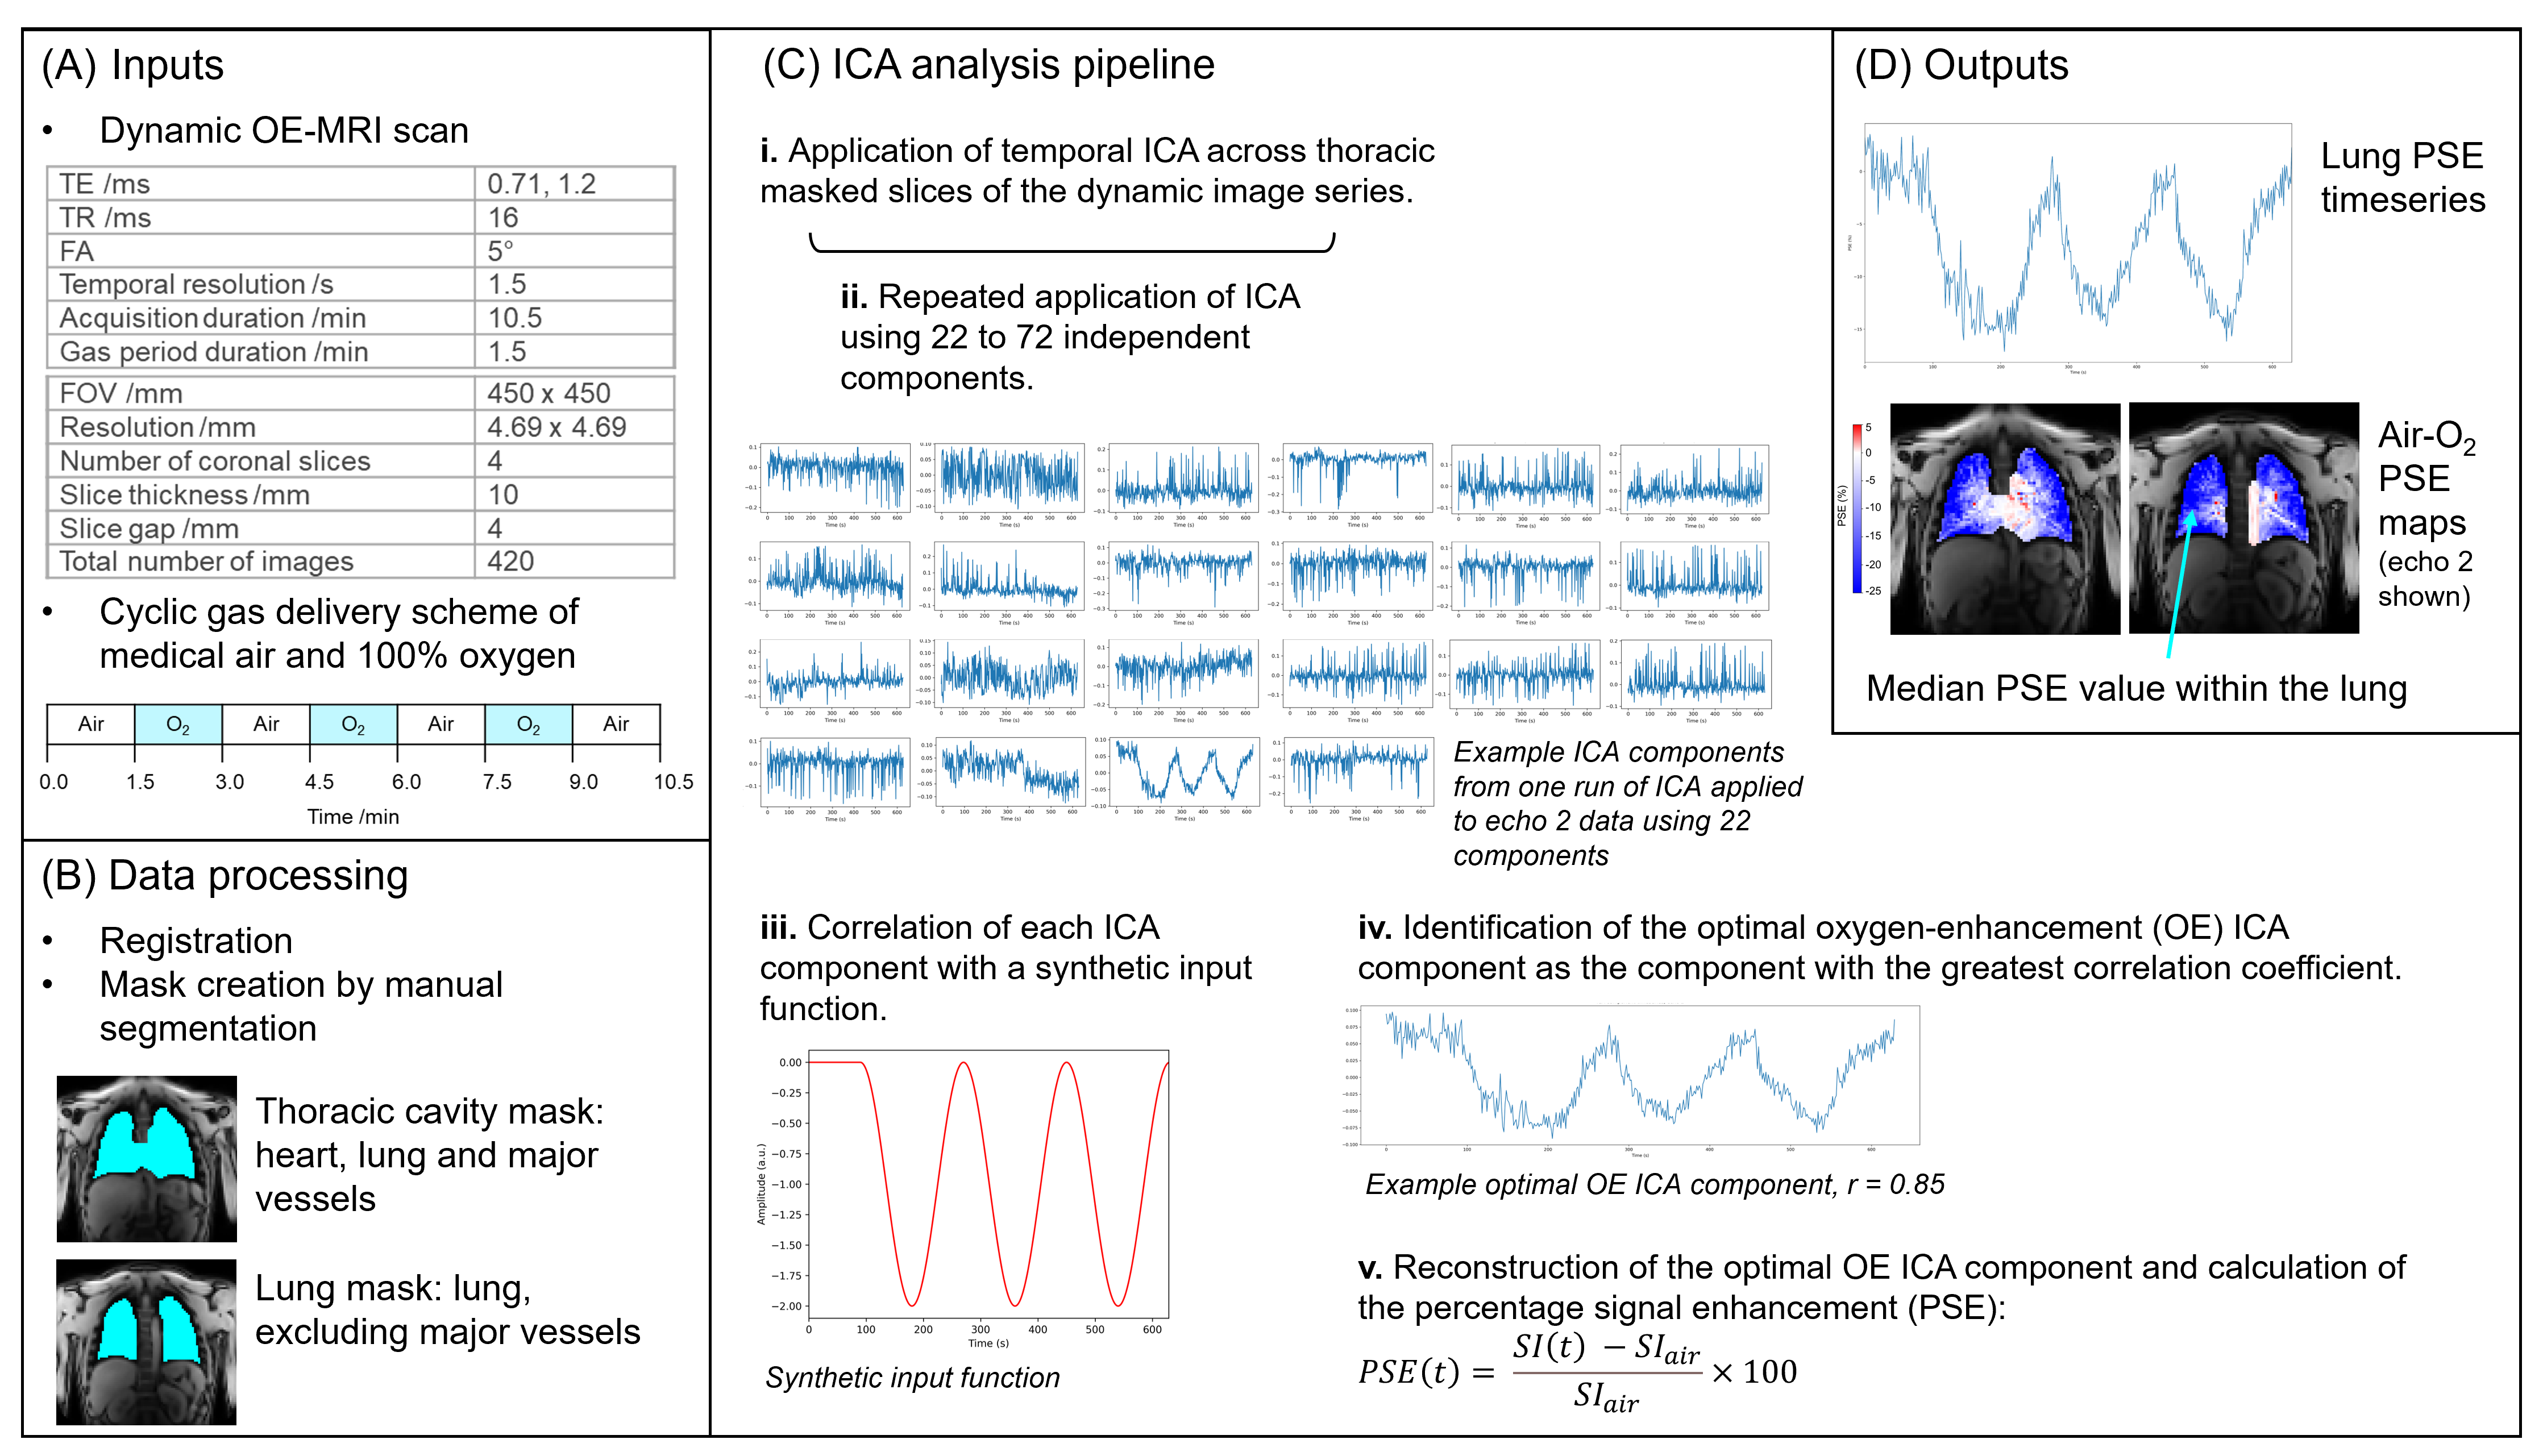
Figure 1: Our ICA analysis pipeline for the extraction of functional information from dynamic lung OE-MRI. (A) provides details of the free-breathing lung OE-MRI sequence and the cyclic gas delivery method involving three periods of 100 % oxygen inhalation. (B) presents the MRI data pre-processing steps prior to application of ICA. The application of ICA, including the approach devised to identify the optimal oxygen-enhancement ICA component, is shown in (C). The outputs of the pipeline providing functional lung information are displayed in (D).
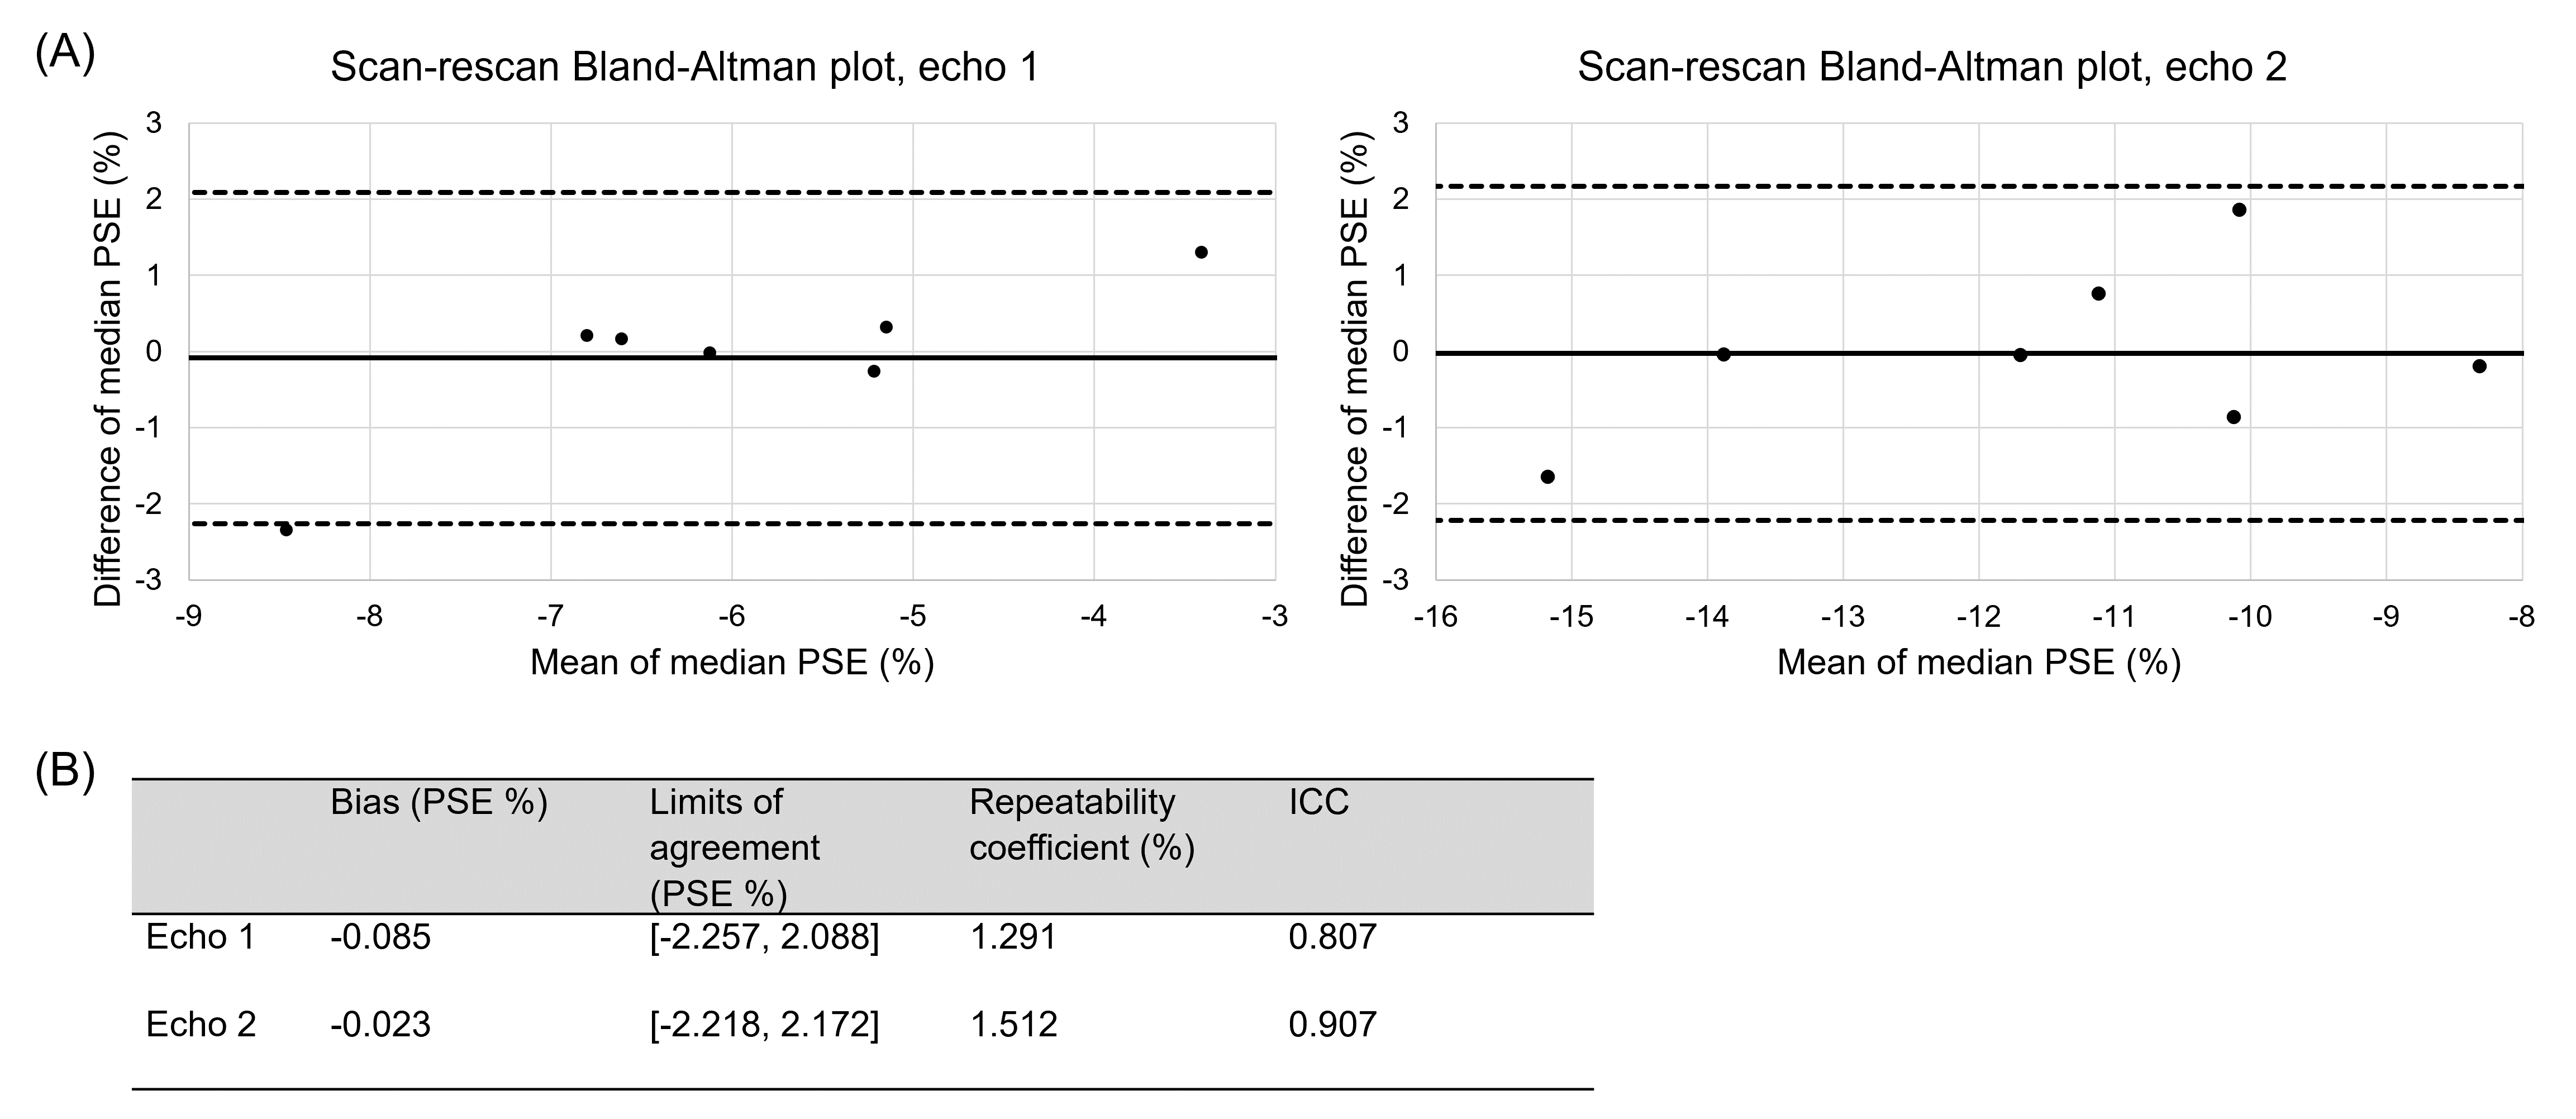
Figure 2: (A) Bland-Altman plot of the median reconstructed oxygen-enhancement (OE) ICA component lung percentage signal enhancement (PSE) values for the scan-rescan study. The solid black line indicates the bias, and the dashed black lines indicate the limits of agreement (LoA). (B) Bland-Altman analysis results and two-way single measure mixed-effects model intra-class correlation coefficient (ICC) with absolute agreement. The ICC values of 0.807 (echo 1) and 0.907 (echo 2) indicated good repeatability.
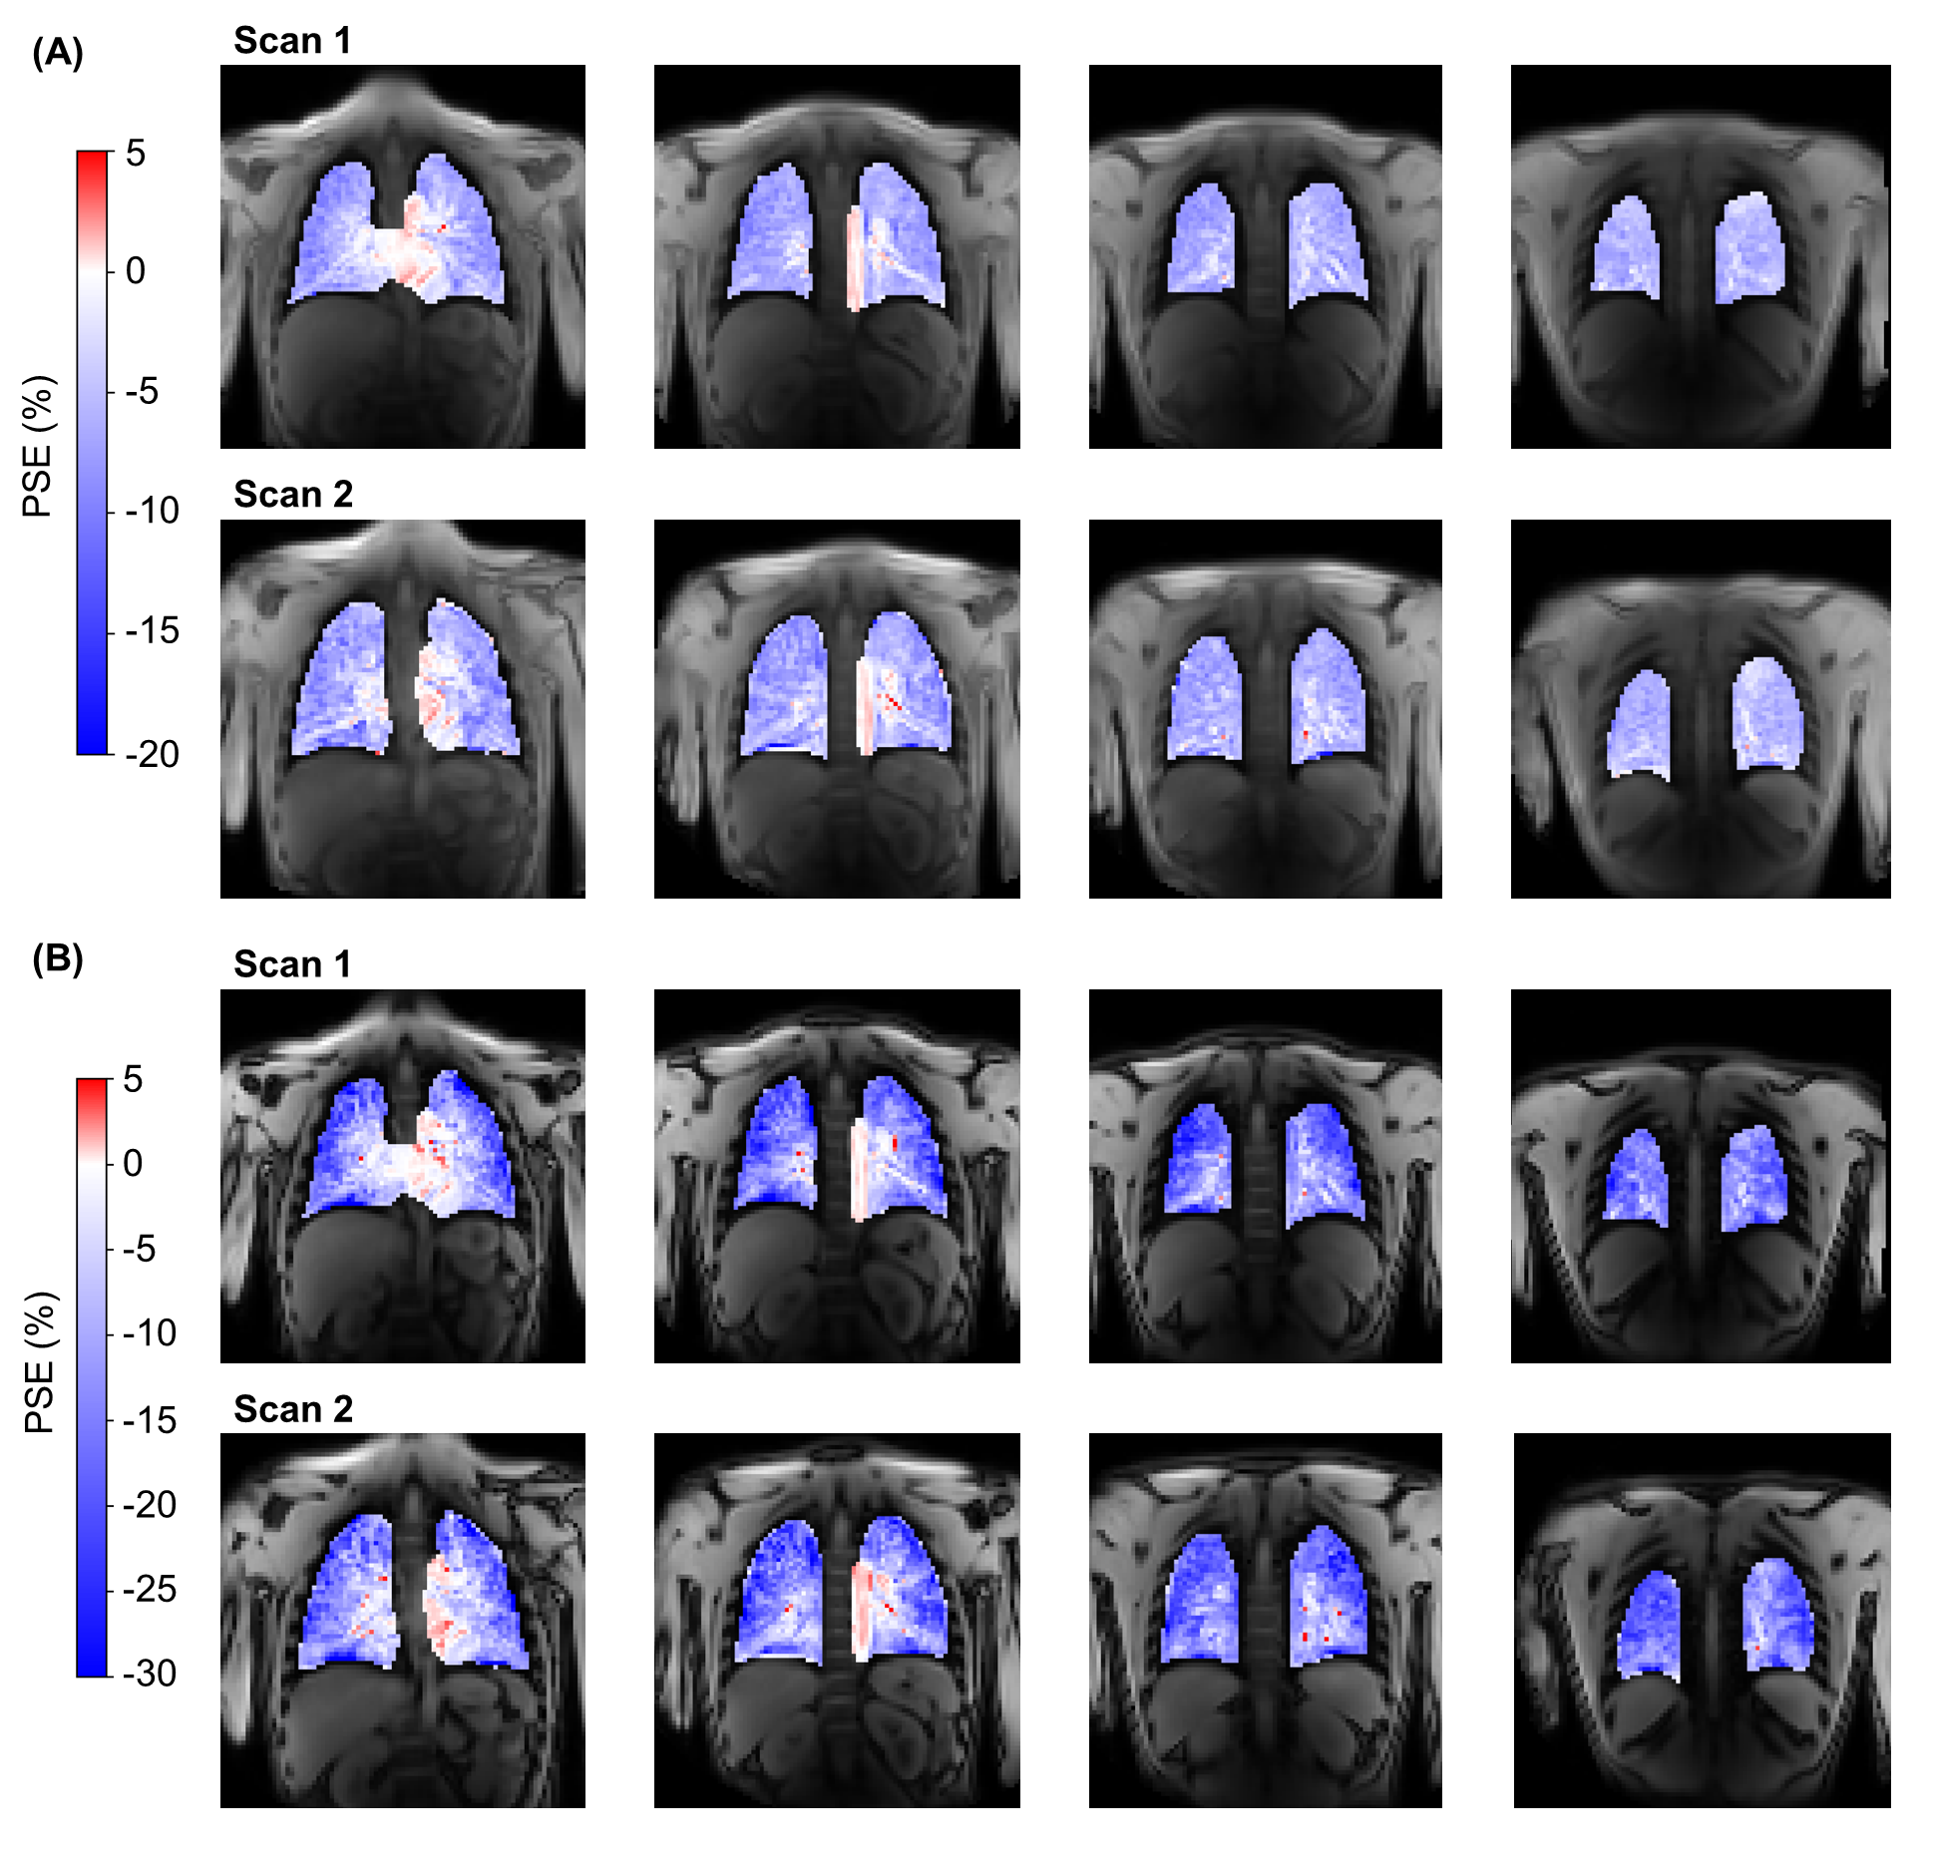
Figure 3: Example reconstructed oxygen-enhancement (OE) ICA component percentage signal enhancement (PSE) maps for a non-smoker scan-rescan study participant. The four slices acquired from both scans are shown for echo 1 (A) and echo 2 (B). Signal enhancements in the lung tissue occurred with a negative PSE whereas the heart and aorta displayed a positive PSE.
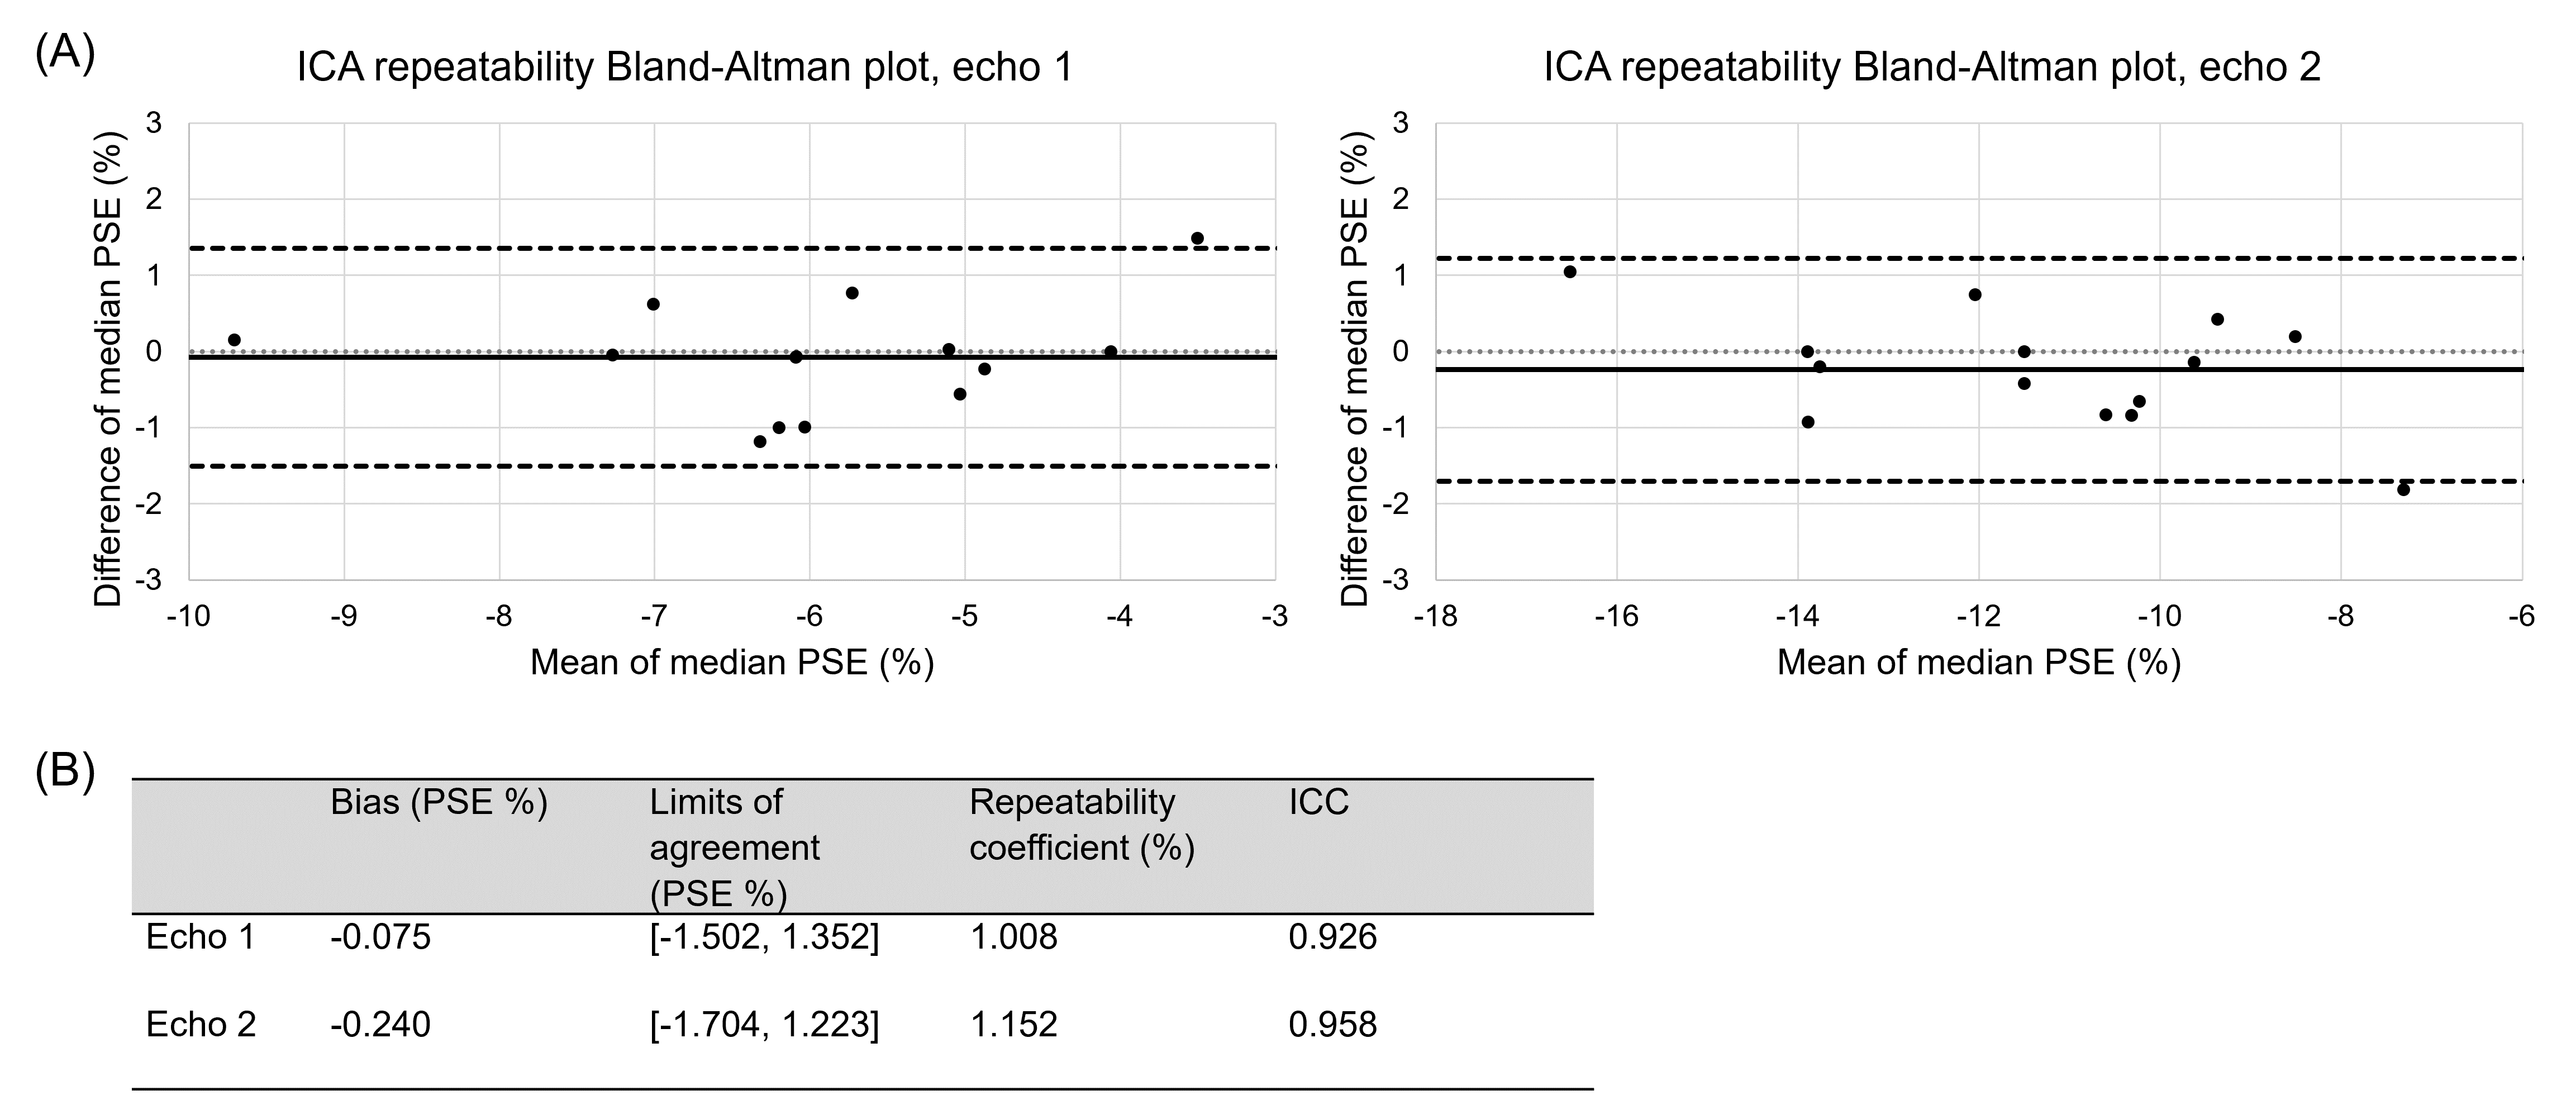
Figure 4: The repeatability of ICA within the OE-MRI ICA analysis pipeline, evaluated by a repeat application of the ICA pipeline without re-scan. (A) Bland-Altman plot of the median reconstructed oxygen-enhancement (OE) ICA component lung percentage signal enhancement (PSE) values produced by the repeat application of ICA. (B) Bland-Altman analysis results and two-way single measure mixed-effects model intra-class correlation coefficient (ICC) with absolute agreement. The ICC values of 0.926 (echo 1) and 0.958 (echo 2) indicated good repeatability.