4809
Reducing scan-time for 3D imaging with undersampled cartesian-radial phase encoding on a point-of-care 46 mT Halbach MRI scanner
Chloé Najac1, Kirsten Koolstra2, Tom O’Reilly1, and Andrew Webb1
1C.J. Gorter MRI Center, Department of Radiology, Leiden University Medical Center, Leiden, Netherlands, 2Philips, Best, Netherlands
1C.J. Gorter MRI Center, Department of Radiology, Leiden University Medical Center, Leiden, Netherlands, 2Philips, Best, Netherlands
Synopsis
Keywords: Low-Field MRI, New Trajectories & Spatial Encoding Methods
Low-field MRI systems (with B0<0.1T) for point-of-care applications are becoming increasingly widespread. Imaging at low-field remains challenging due to the low intrinsic SNR. We evaluated speeding up 3D imaging using radial-based Cartesian undersampled phase-encodings (PEs). In phantoms, we tested different undersampling schemes and compared them to full in-out Cartesian PE in terms of peak SNR (PSNR) to take account of spatial resolution and image SNR. Results suggests that a radial-based Cartesian PE trajectory with an overall acceleration factor of two can be implemented while preserving image quality (PSNR~69dB with R=2 vs. ~70dB with R=1.3 in a discrete spatial resolution phantom).Introduction
Point-of-care (POC) imaging with low-field MRI (<0.1T) has been suggested as an important element in increasing accessibility to healthcare in low and middle income countries1. The main challenge is the intrinsic low SNR2, resulting in trade-off between scan time and image resolution and limiting the minimum detectable size of different pathologies. 3D turbo-spin echo (TSE) readouts are most commonly used2 due to high k-space efficiency and relative insensitivity to B0 inhomogeneities. Nevertheless, the current lack of parallel imaging capability and limited gradient strengths mean that acquisition times are longer than those used on conventional clinical systems. We evaluated the feasibility to reduce acquisition time, while preserving detection-size limits, using a 3D TSE with radial-based Cartesian k-space in the phase-encode (PE) directions (Fig.1). Using compressed-sense reconstruction to correct for undersampling, we found in phantoms that acquisition time can be reduced by a factor of 2 while preserving image quality.Materials and Methods
Hardware: We used a portable 46 mT Halbach array-based magnet (outer/inner diameter=60.0/30.1cm, length=49.2cm, weight=111kg), with custom-built RF amplifier, Bruker gradient amplifiers and a Magritek Kea2 spectrometer3. Imaging was performed using a solenoid or an elliptical spiral-solenoid head coil1-3.Cartesian-Radial PE trajectory implementation: We implemented a 2D radial-cartesian PE trajectory4. The trajectory follows the Cartesian grid but is sampled in a radial pattern. We used an elliptical circumscribed kPE,1-kPE,2 matrix (i.e. not acquiring the corners of k-space), fully sampled in the center and undersampled outside a certain center diameter (Fig.1). The trajectories were created in Python code, and exported as text files to the spectrometer. As represented in Fig.1, we tested different center-diameters (dcenter, varying from 20 to 100% of the full ellipse dimension) and different undersampling factors outside the center area (rout, varying from 2 to 8). Data were compared with a conventional in-out 2D PE trajectory (with and without elliptical windowing).
Discrete spatial resolution phantom: We used a phantom containing capillaries with inner diameters varying from 1mm to 5mm. Capillaries with 1mm diameter were spaced 1mm apart, those with 2mm diameter 2mm apart, etc. Capillaries were filled with oil, resulting in short T1 and T2 relaxation values. Data were acquired with all trajectories described above and using the following acquisition parameters: TR/TE=600/15ms, echo-train-length (ETL)=6, resolution (FE,PE1,PE2)=1x1x1mm3, acquisition bandwidth (BW)=20 kHz. Following Fourier transform along the frequency encoding direction (FE), data from 30 slices were averaged to increase SNR, giving an effective resolution of 1x1x30mm3.
Morphometric brain-like (BrainLo) phantom: BrainLo was 3D printed with Polylactic Acid and filled with different solutions of agarose/copper-sulphate doped-water/deuterated-water to imitate brain tissue relaxation properties. Data were acquired with all trajectories described above (except dcenter=20% and rout=8) using the following acquisition parameters: TR/TE=600/14ms, ETL=6, resolution(FE,PE1,PE2)=1x2x2mm3, BW=20 kHz, no signal averaging. Following Fourier transform along frequency encoding direction (FE), data from 11 slices were averaged to increase SNR, giving an effective resolution of 2x2x11mm3.
Undersampling correction: To correct for undersampling, we used Split Bregman (SB)5 as a non-linear minimization scheme. The regularization parameters were tuned empirically and set to μ=5 and λ=20.
Comparison: We compared all undersampled datasets (in-out with elliptical windowing and radial-based Cartesian PE trajectories) with the fully sampled in-out dataset ($$$u_{ref}$$$). For each reconstruction ($$$u$$$), we calculated the peak SNR (PSNR) defined as $$$20*log_{10}(\frac{max(u_{ref})}{RMSE(u_{ref},u)})$$$. The PSNR represents a measure of both the sharpness and SNR of the image. We measured the PSNR across the entire image (BrainLo phantom), as well as across regions with different capillary diameter in the resolution phantom (Fig.2).
Results and Discussion
Trajectory implementation: Fig.1 and 2 illustrates how k-space was sampled with the various undersampling combinations (different dcenter and rout), the total acceleration factor R and resulting acquisition time. Using these combinations, we could accelerate our acquisition by factors varying from 1.3 to 8.1.Resolution phantom: Fig.3 shows images after undersampling correction. Capillaries with 1mm inner diameter could not be clearly detected with any trajectory including full k-space coverage. Capillaries with diameter 2mm and higher could be separated up to an overall reduction factor of 3-4. When measuring the PSNR (Fig.4) across the entire image, there was a very small loss with acceleration factors up to 2. Looking at capillaries of different sizes, we found that as expected image loss was greater for the smaller capillaries with PSNR being reduced by 2dB with acceleration factors up to 2 and by 10 dB with acceleration factor 8. There were little differences in PSNR when comparing the two different undersampling approaches (reducing the fully sampled center-diameter or increasing the undersampling factor outside the diameter) as long as the overall acceleration factor R was similar.
BrainLo phantom: Fig.5 illustrates the effects on the BrainLo phantom. Although PSNR values remained relatively affected across acceleration factor (~60 dB), images with undersampling all appeared less sharp.
Conclusion
We have shown the potential to use a radial-based Cartesian trajectory with undersampling scheme to reconstruct 3D TSE images on a POC 46mT Halbach MRI scanner. Results in resolution phantom suggest that acceleration factors up to 2 are feasible, while preserving image sharpness and SNR, for feature sizes of ~2mm. Results in a brain-mimicking phantom showed relatively similar results. In future, we will evaluate improvement when combining the radial-based PE with partial Fourier.Acknowledgements
This project has received funding from Horizon 2020 ERC Advanced PASMAR 101021218 and the Dutch Science Foundation Open Technology 18981.References
1Anazado, NMR in Biomed. (2022) ; 2O’Reilly et al., MRM (2021) ; 3O’Reilly et al., MRM (2020); 4Busse et al., MRM (2008); 5Koolstra et al., MAGMA (2021)Figures
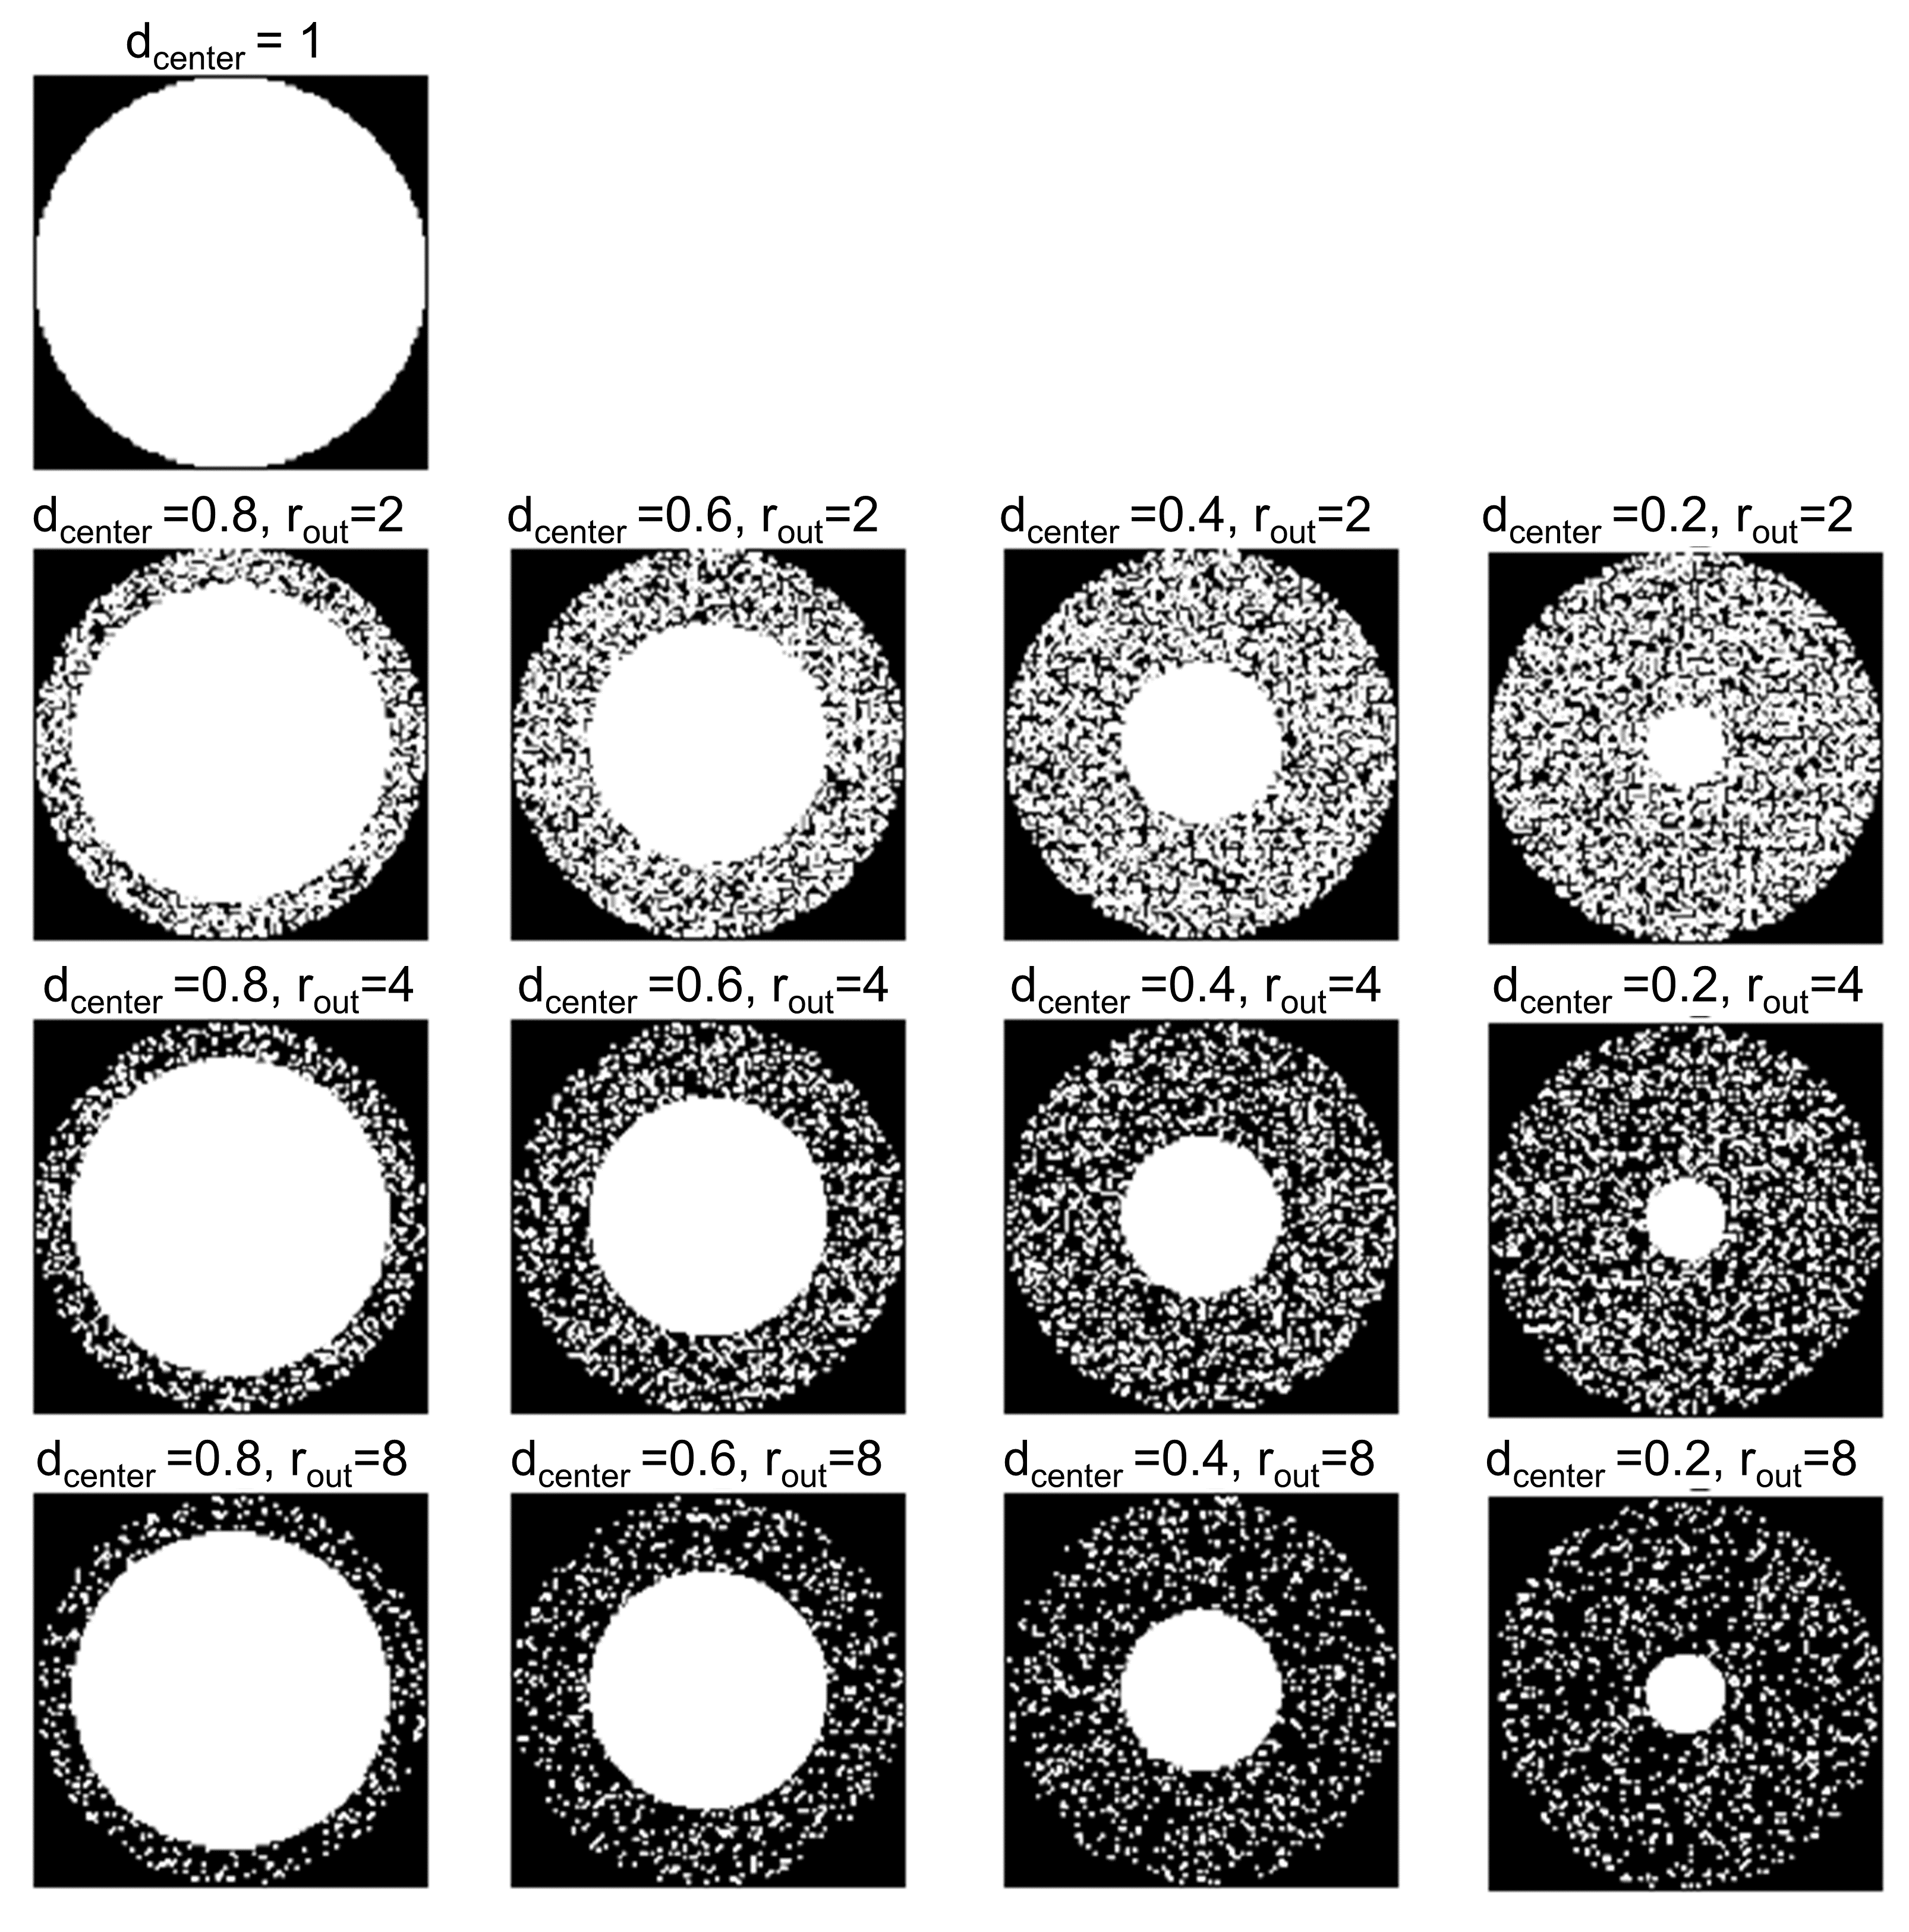
Figure 1 Schematic
representing all k-space patterns that were tested in this study. dcenter
represents the size of the fully sampled center and rout
represents the undersampling factor outside the fully sampled center.
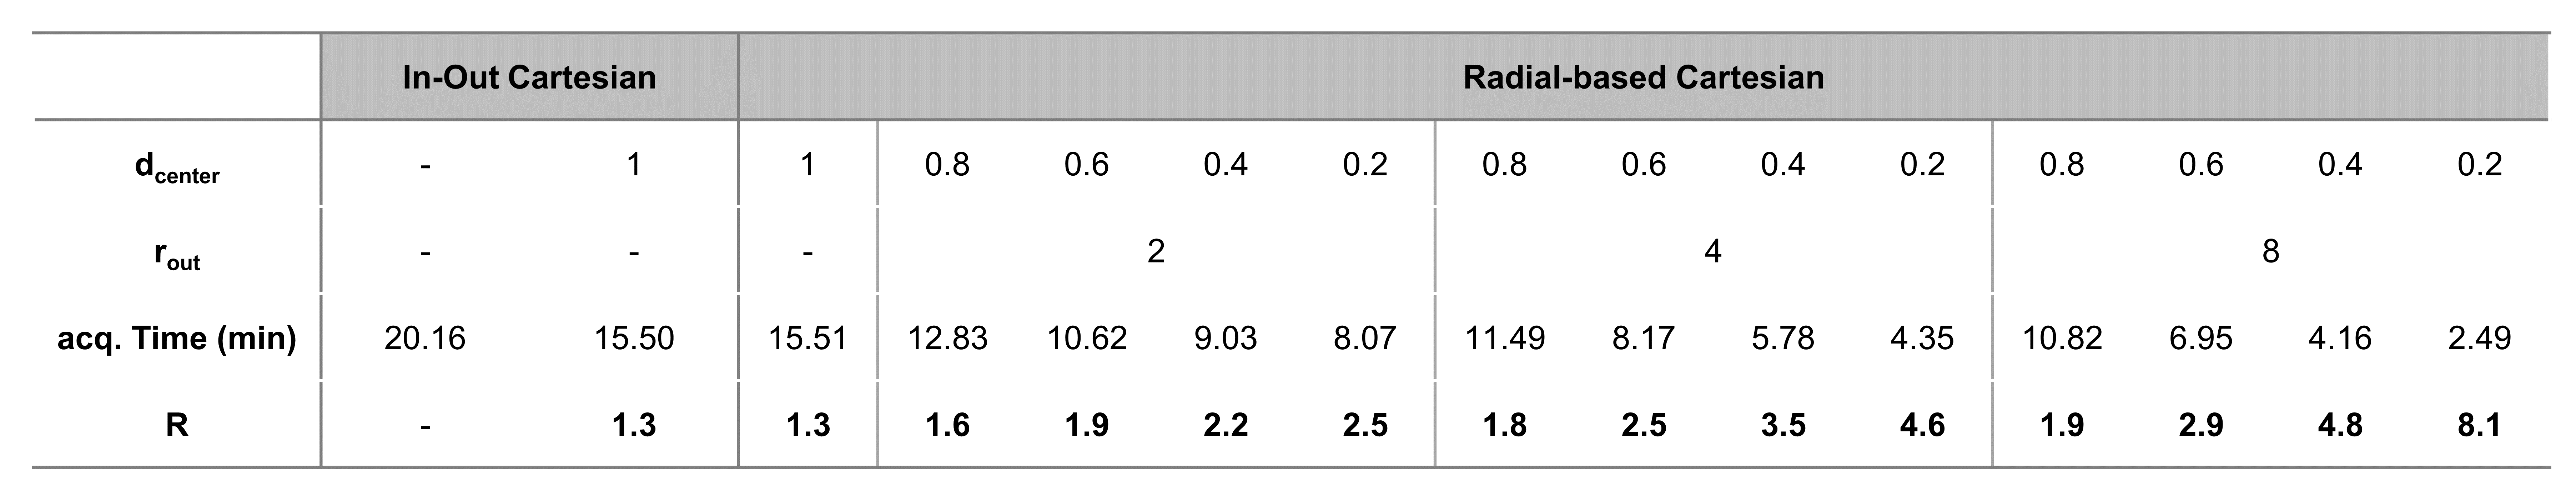
Figure 2 Table summarizing all
trajectories with their respective acquisition time and overall acceleration
factor for experiments on both phantoms.
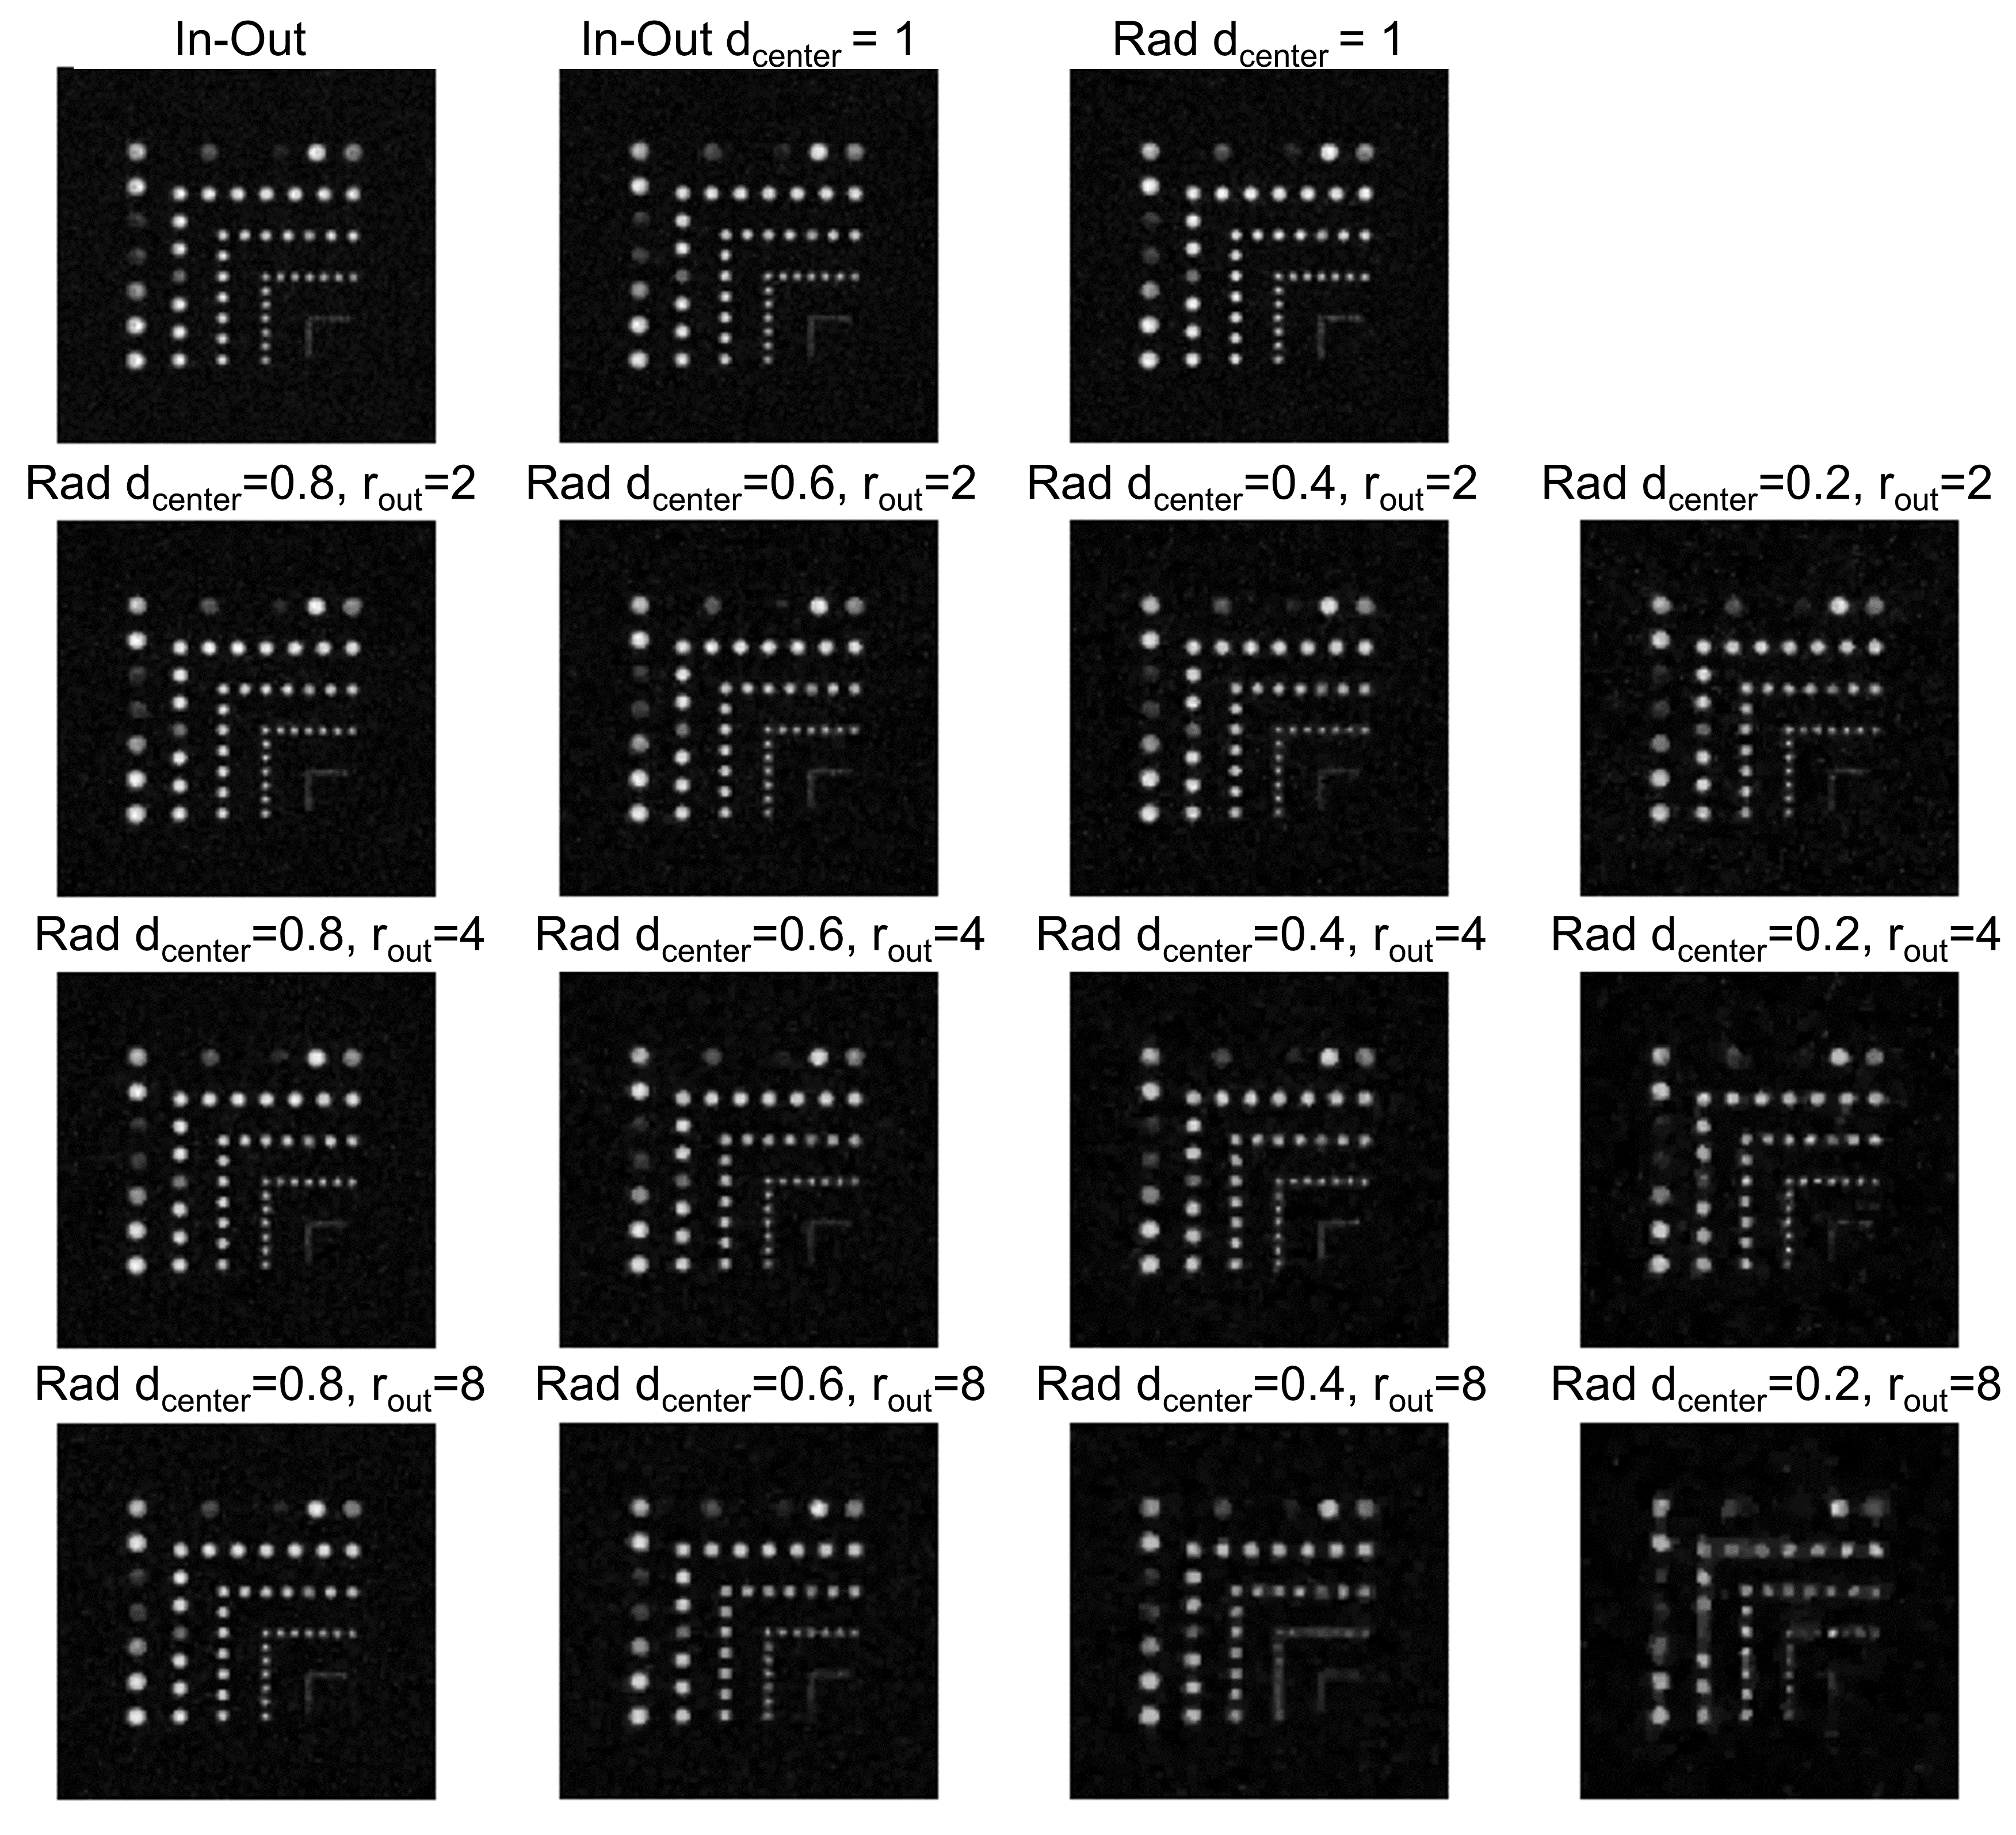
Figure 3 Images obtained after compressed
sensing reconstruction for all trajectories with the resolution phantom.
Capillaries (from 5 to 1mm diameter) were filled with oil. Larger tubes were
5mm in diameter and separated by 5mm, while smaller tubes were 1mm and 1mm
apart. Capillaries with 1mm diameter could not be detected with any trajectory.
Capillaries with 2mm and higher could be seen with overall reduction factors up
to 3-4.
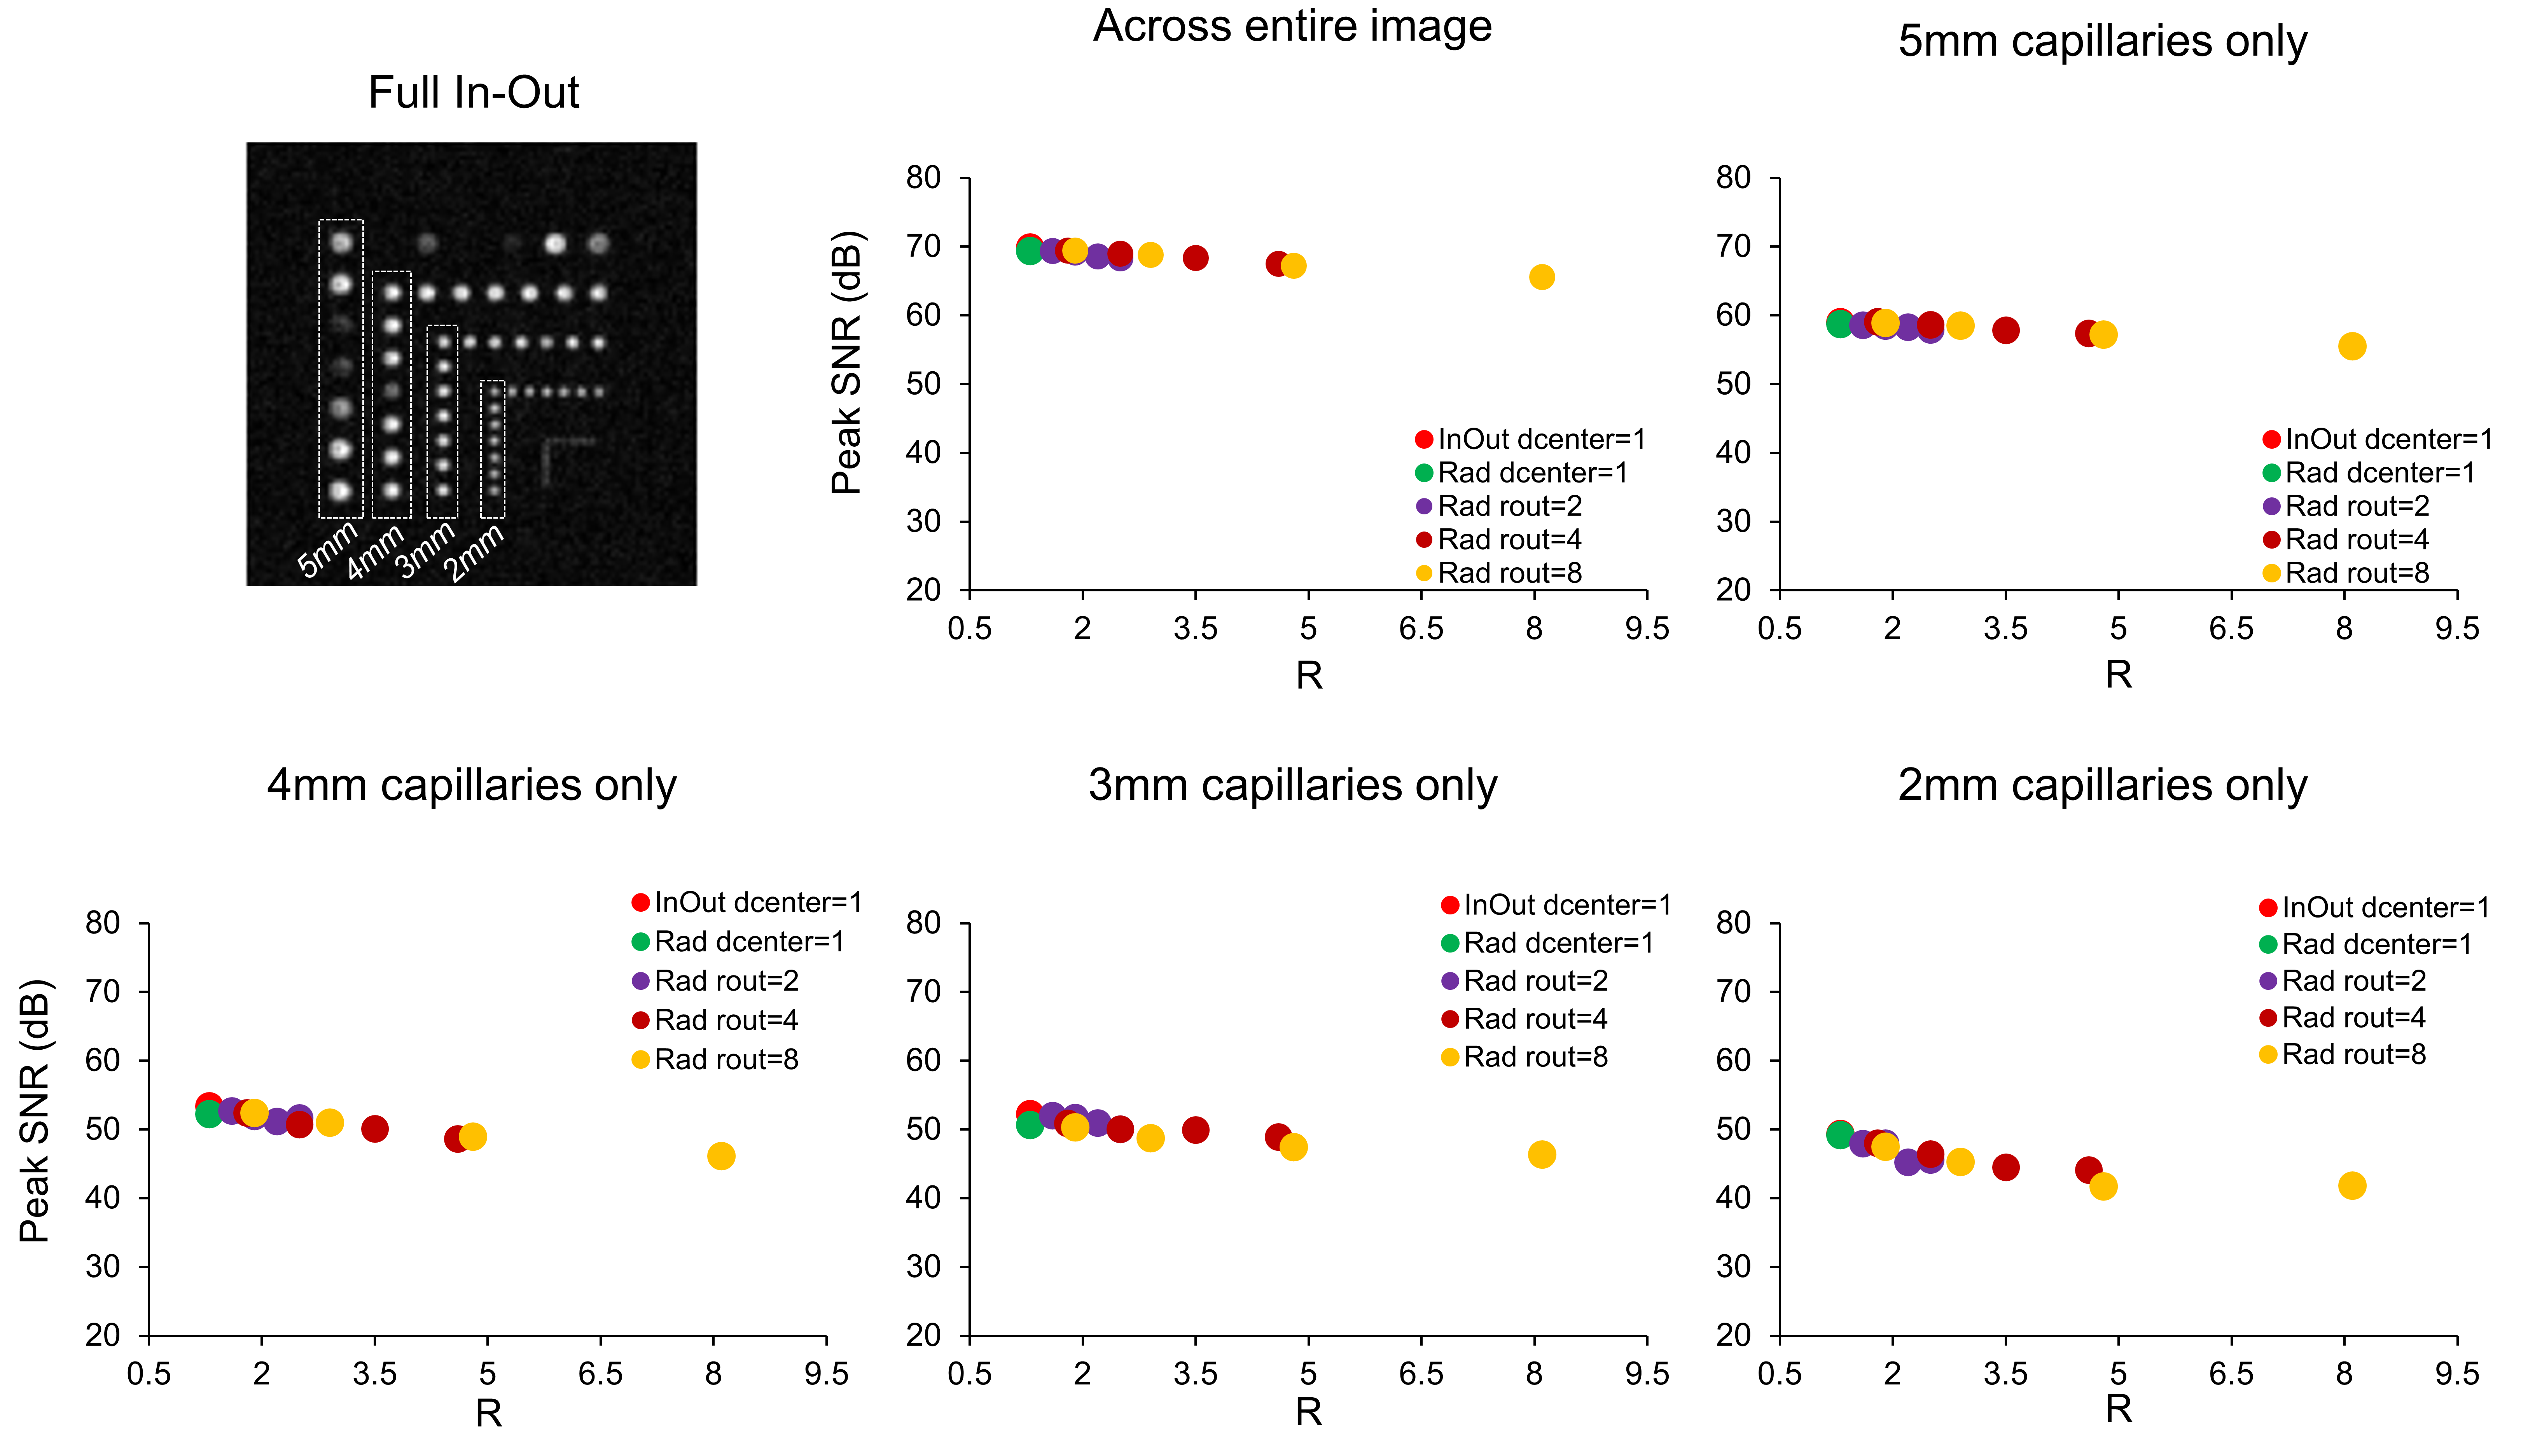
Figure 4 Graphs show the evolution of
PSNR as a function of the overall acceleration factor for the different
trajectories. An improvement of 2dB was observed with undersampling correction
compared to without.
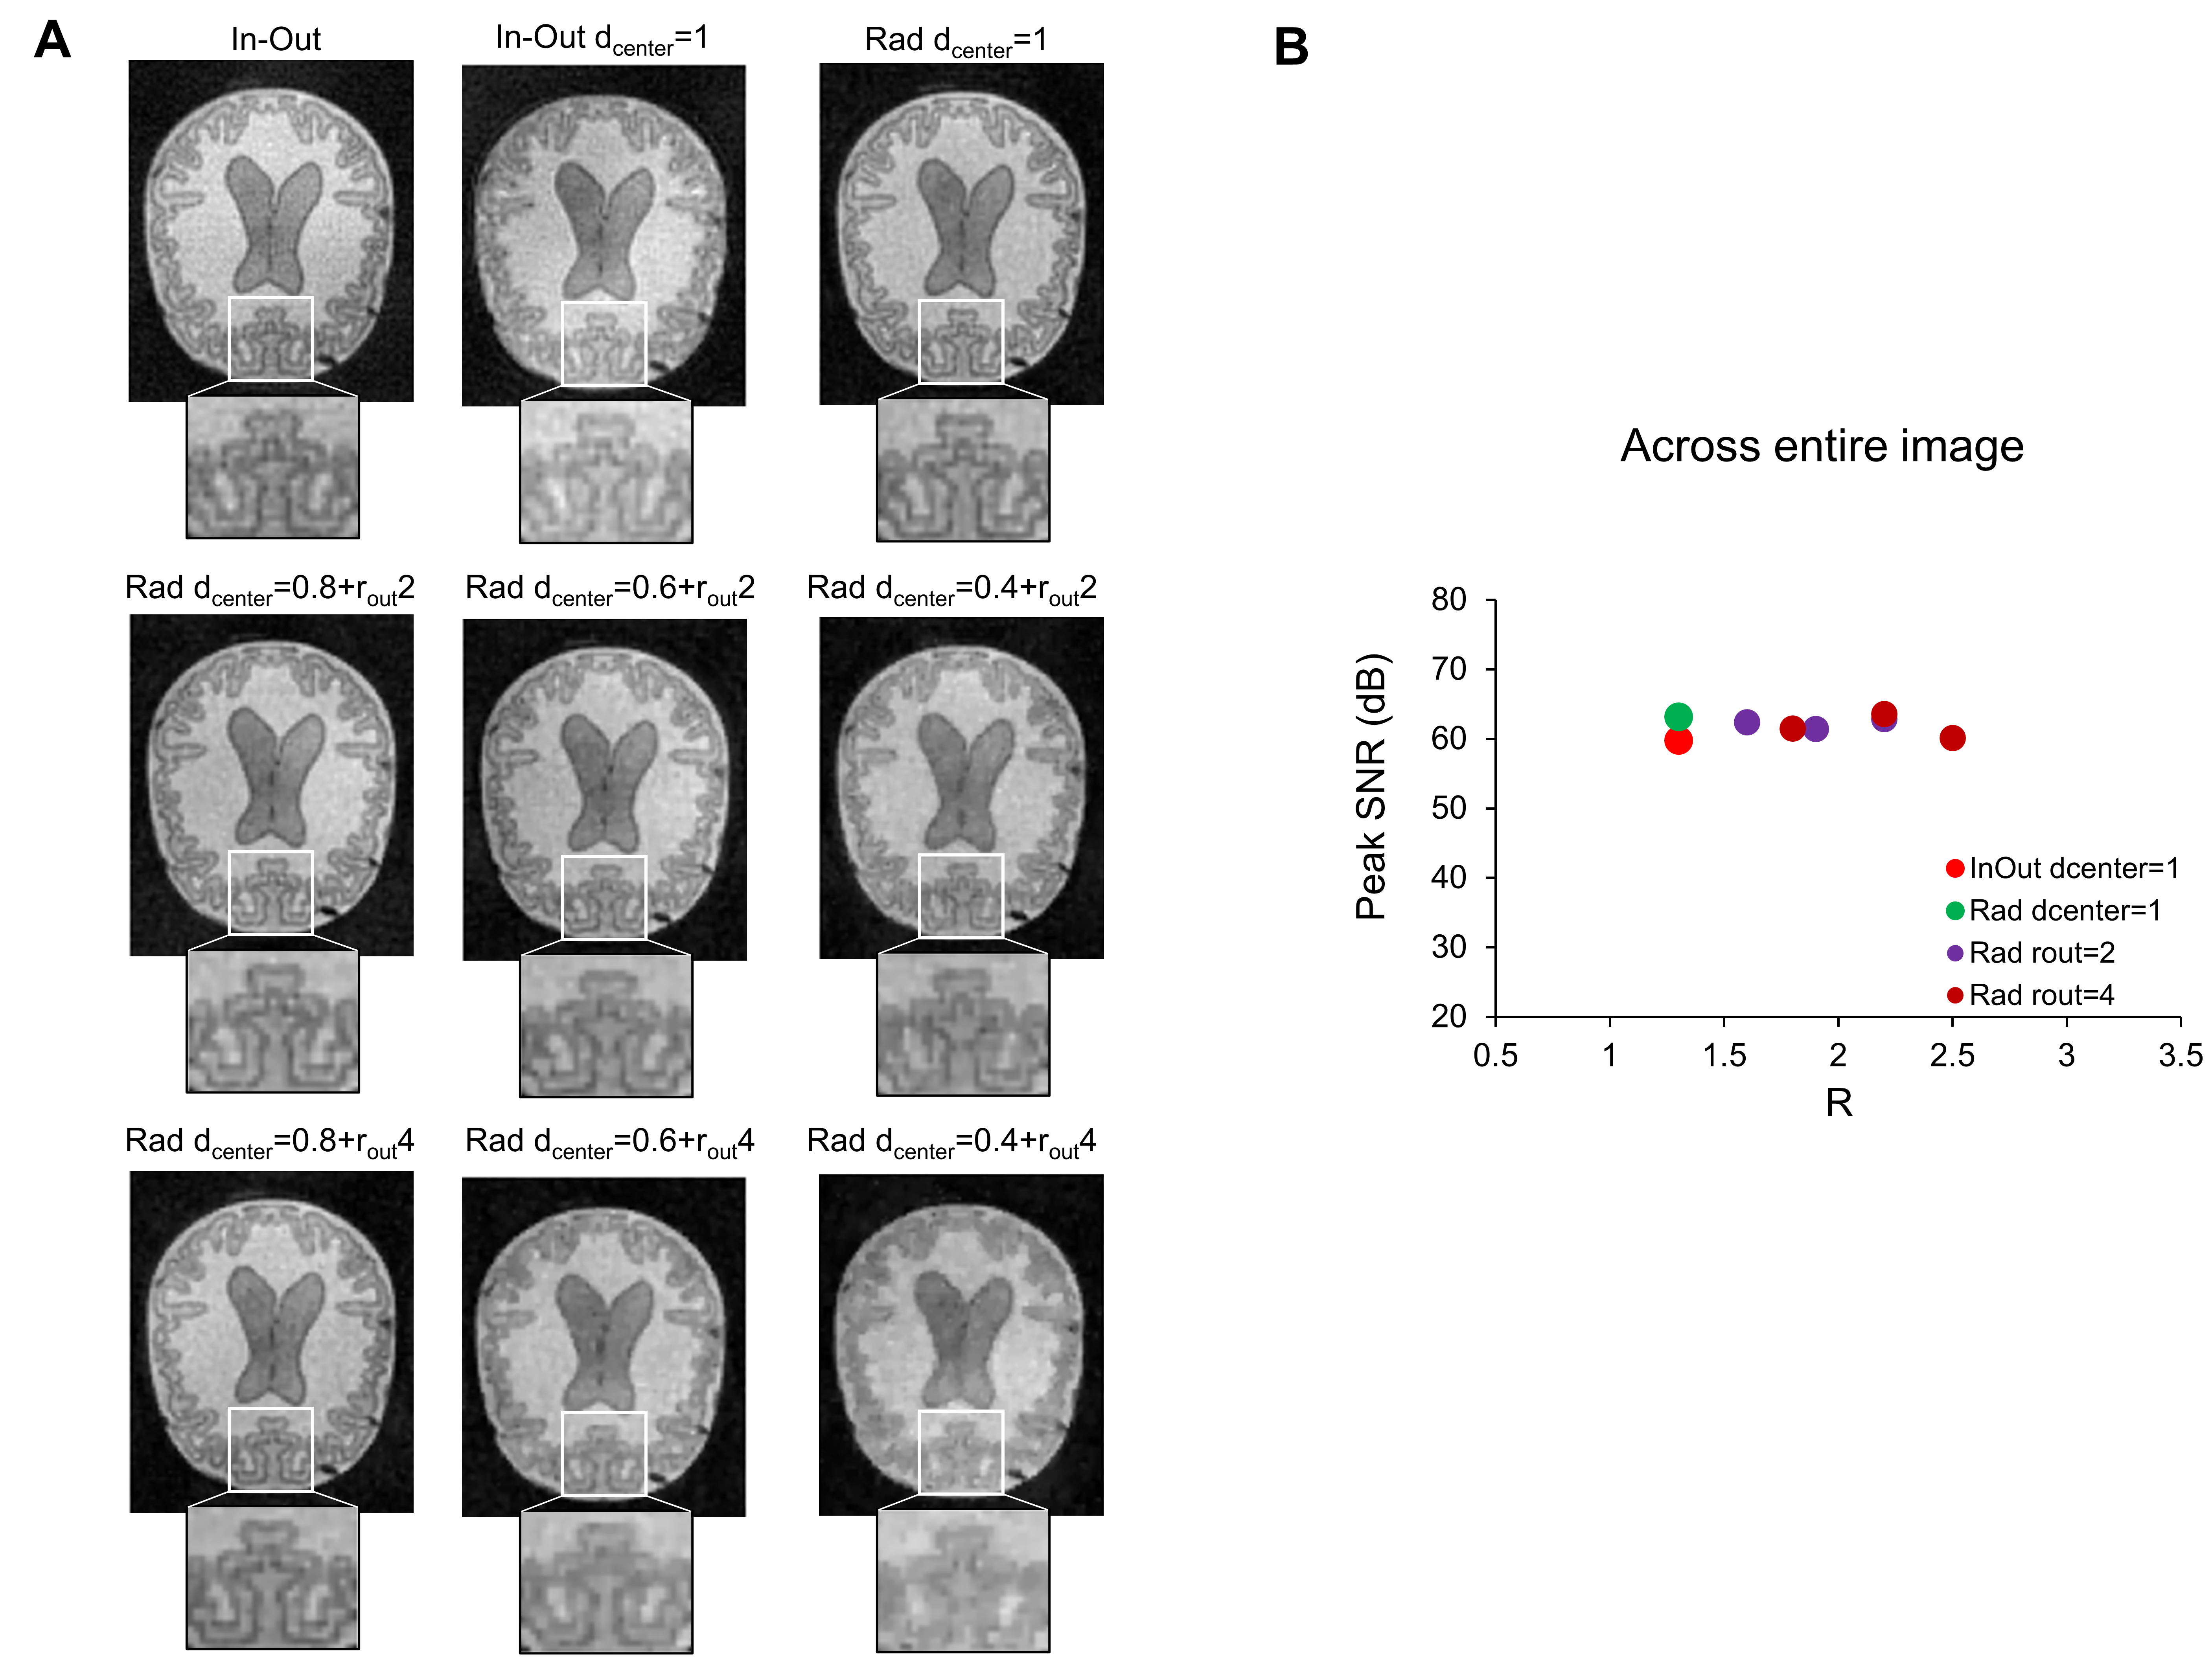
Figure 5 (A) Images of BrainLo
phantom with various trajectories and undersampling scheme used. Images with
undersampling all appeared less sharp. However, undersampling correction might
have not improved the images significantly, potentially due to the lack of high
frequency features in the phantom. (B) Graphs show the evolution of PSNR
as a function of the overall acceleration factor.
DOI: https://doi.org/10.58530/2023/4809