4806
Evaluation of perfusion on Golden-Angle Radial Sparse Parallel (GRASP) MRI in discriminating benign and malignant liver tumors1Department of Radiology, Sun Yat-Sen Memorial Hospital, Sun Yat-Sen University, Guangzhou, China, 2MR Scientific Marketing, Siemens Healthineers Ltd., Guangzhou, China
Synopsis
Keywords: Data Analysis, Cancer
This study investigated the utility of quantitative parameters of golden-angle radial sparse parallel (GRASP) dynamic contrast enhanced magnetic resonance imaging (DCE-MRI) for evaluation of perfusion and differentiation of benign and malignant liver tumors. The results showed the quantitative parameters in GRASP DCE-MRI can effectively evaluate the perfusion characteristics and differentiation in liver tumors with good diagnostic performance. This indicated that the GRASP quantitative parameters may be useful to evaluate and predict the pathological stage of liver lesions.Introduction/Purposes
Dynamic contrast enhanced magnetic resonance imaging (DCE-MRI) is a powerful and non-invasive method for the diagnosis of liver diseases by dynamically monitoring enhancement patterns during arterial, portal venous, and late phases in different tissues.1 However, this method has some limitations with respect to susceptibility to respiratory motion artifacts and low temporal resolution.2 Golden-angle radial sparse parallel (GRASP) is a relatively new DCE-MRI technique that combines parallel imaging, radial sampling pattern and compressed sensing, to address above concerns about motion artifacts and temporal resolution.3, 4 GRASP has been used for evaluation of tissue-specific enhancement dynamics in head and neck5, cardiac6 and breast7, but quantitative parameters were rarely analyzed in liver imaging. Therefore, the purpose of this study is to demonstrate the value of quantitative parameters of GRASP DCE-MRI for evaluation of perfusion characteristics and differentiation of pathologically proven benign and malignant liver lesions.Methods
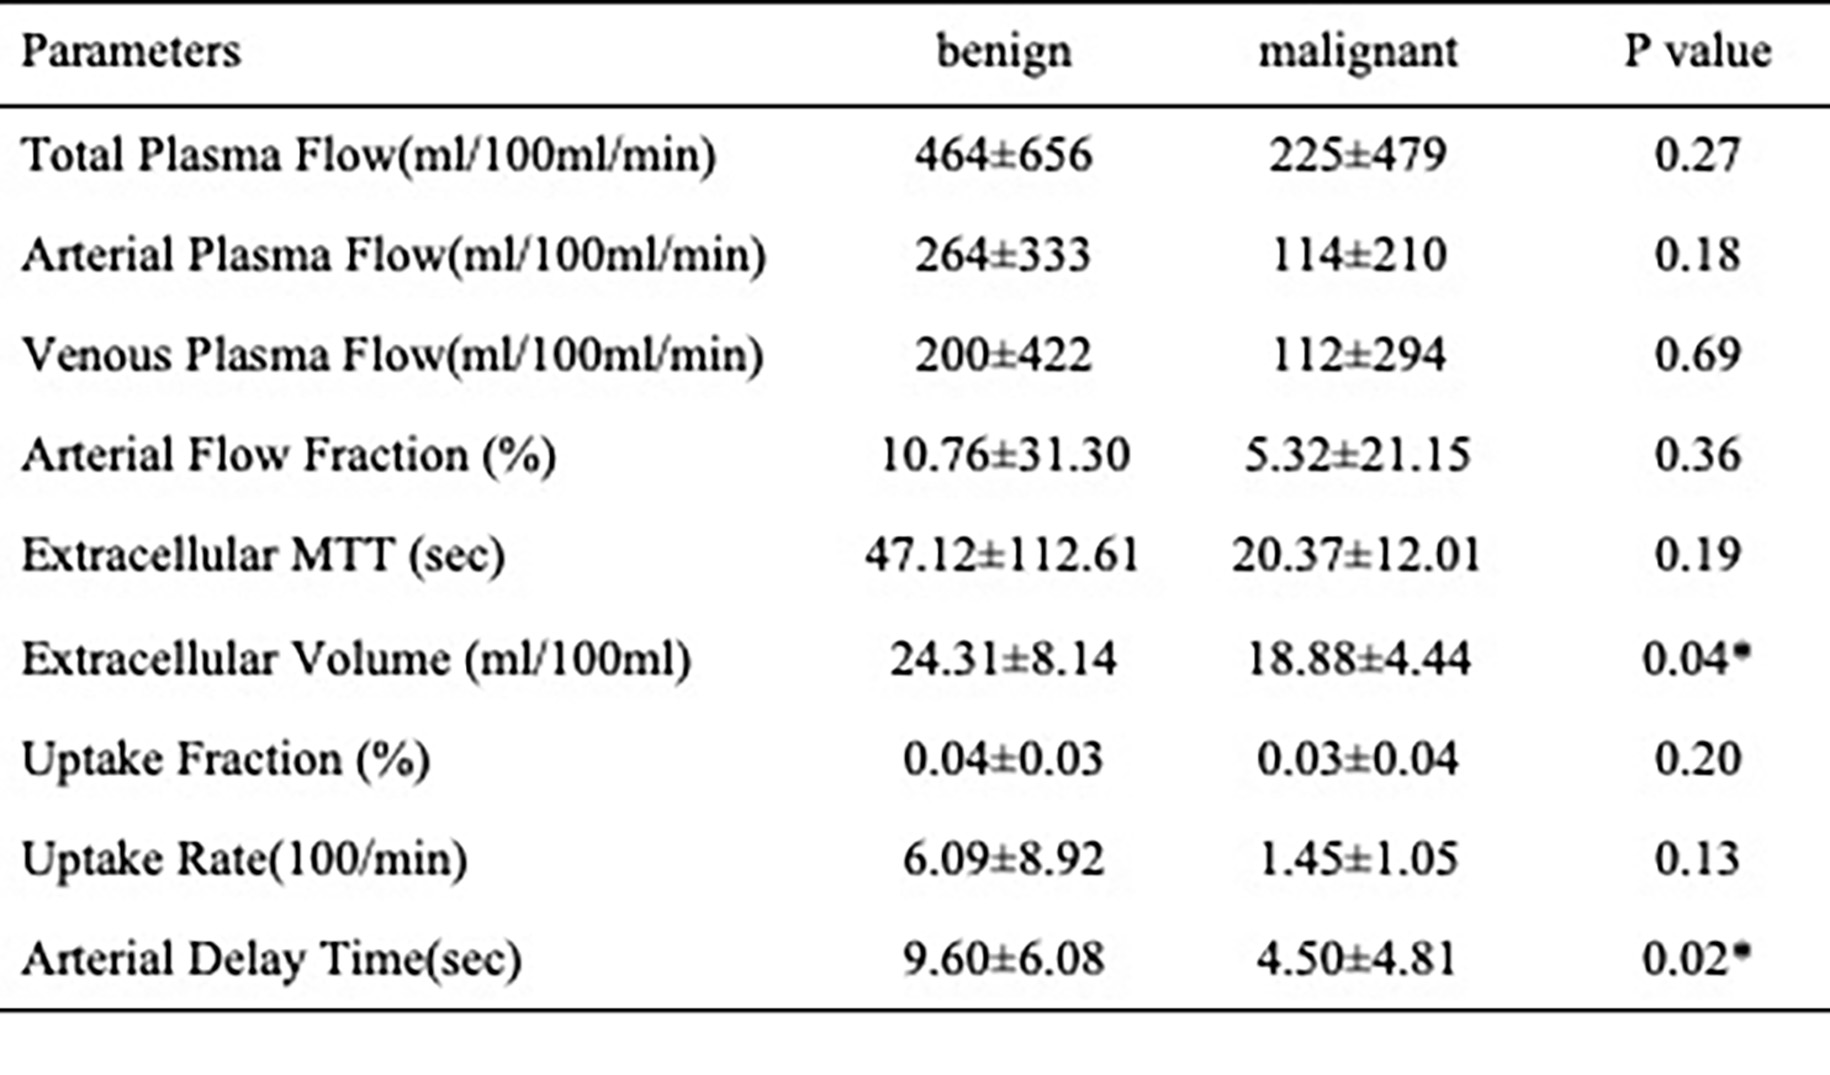
Between April 2022 and November 2022, 32 patients (25 males) with hepatic tumors (10 benign, 22 malignant) were included in this prospective, institutional review board–approved study. All MR examinations were performed on a 3T scanner (MAGNETOM Vida; Siemens Healthineers, Erlangen, Germany) with patients in a supine position. Free-breathing DCE-MRI was performed using a fat-saturated, T1-weighted volumetric-interpolated examination (VIBE) sequence with a GRASP sampling scheme (acquisition time 5:39 min). The number of slices were 88 to cover the whole liver with a field of view of 380 × 380 mm2, a matrix of 288 × 288, and the voxel size was 1.32 × 1.32 × 2 mm3. Perfusion quantitative parameters (total plasma flow (Fp) [mL/100 mL/min], arterial plasma flow (Fa) [mL/100 mL/min], venous plasma flow (Fv)[mL/100 mL/min], arterial flow fraction (AF) [%], extracellular mean transit time (MTT)[sec], extracellular volume (ECV)[ml/100ml], uptake fraction[%], uptake rate [100/min], arterial delay time (Ta)[sec]) were calculated with free software (PMI 04, Platform for Research in Medical Imaging) and the differences between the benign and malignant liver tumors were evaluated by using the Mann–Whitney U‐test. The receiver operating characteristic curve (ROC) analysis was used to determine the diagnostic performance. A P-value less than 0.05 was considered as meaningful.Results
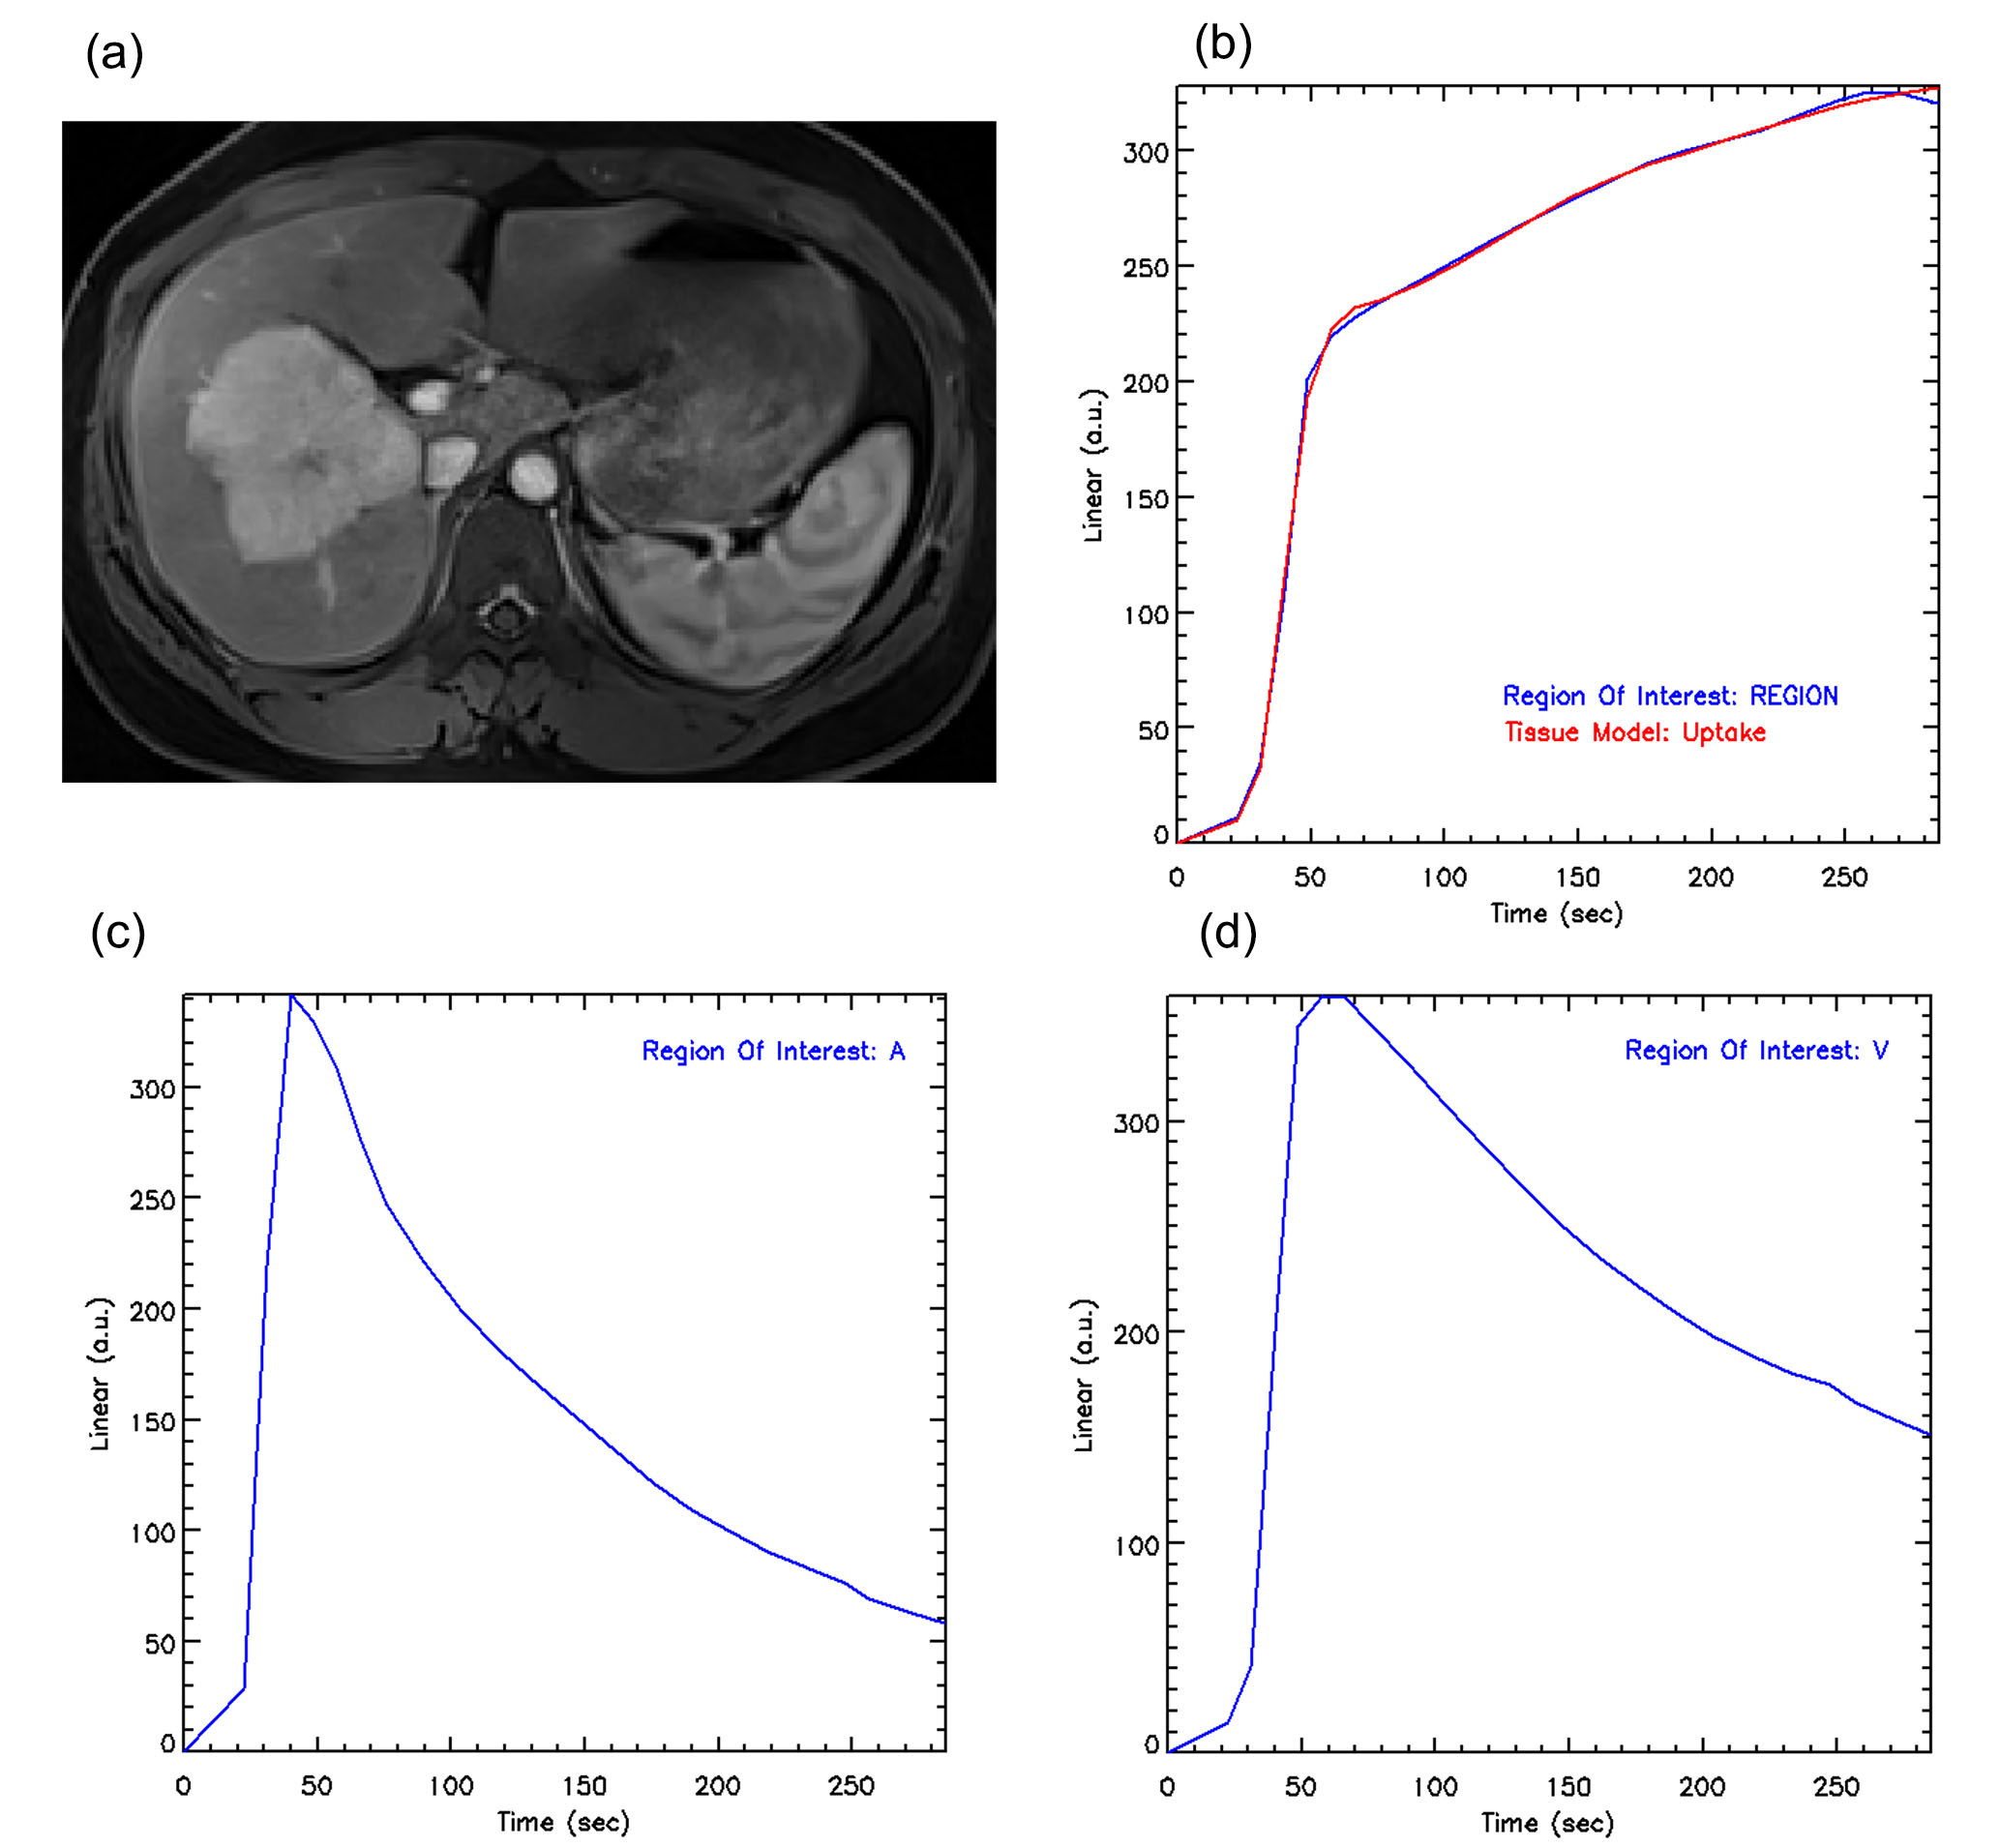
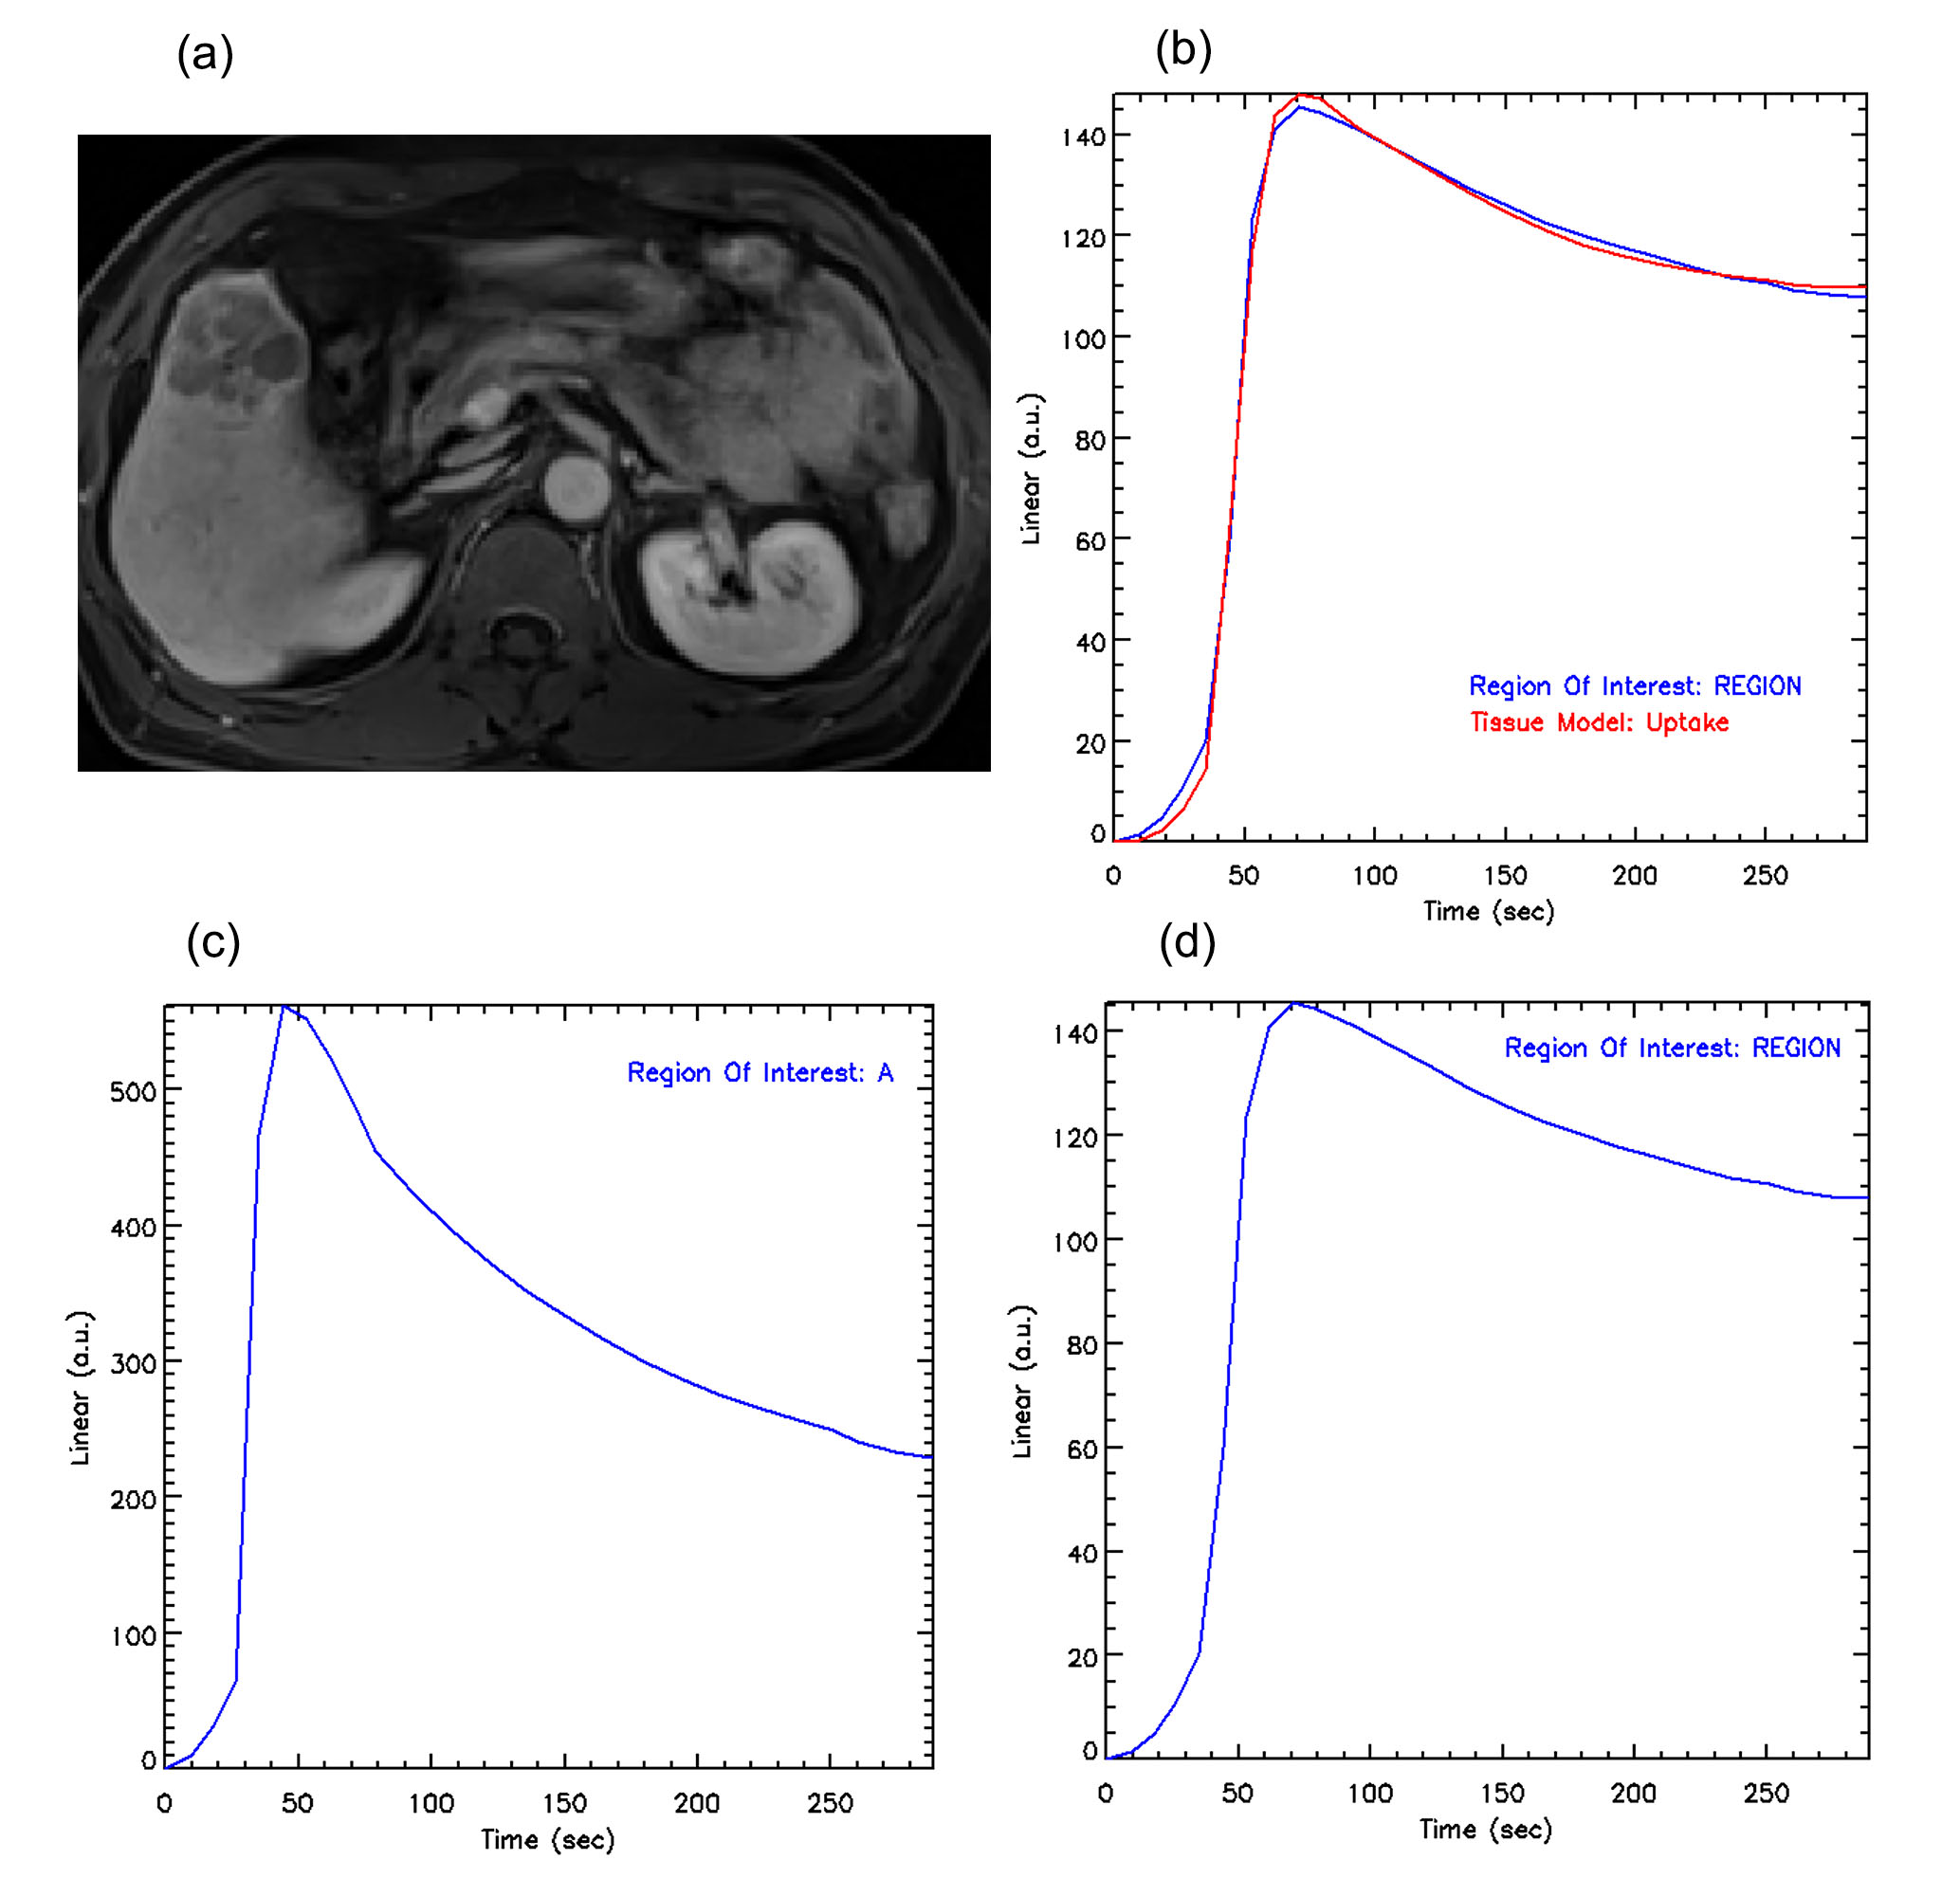
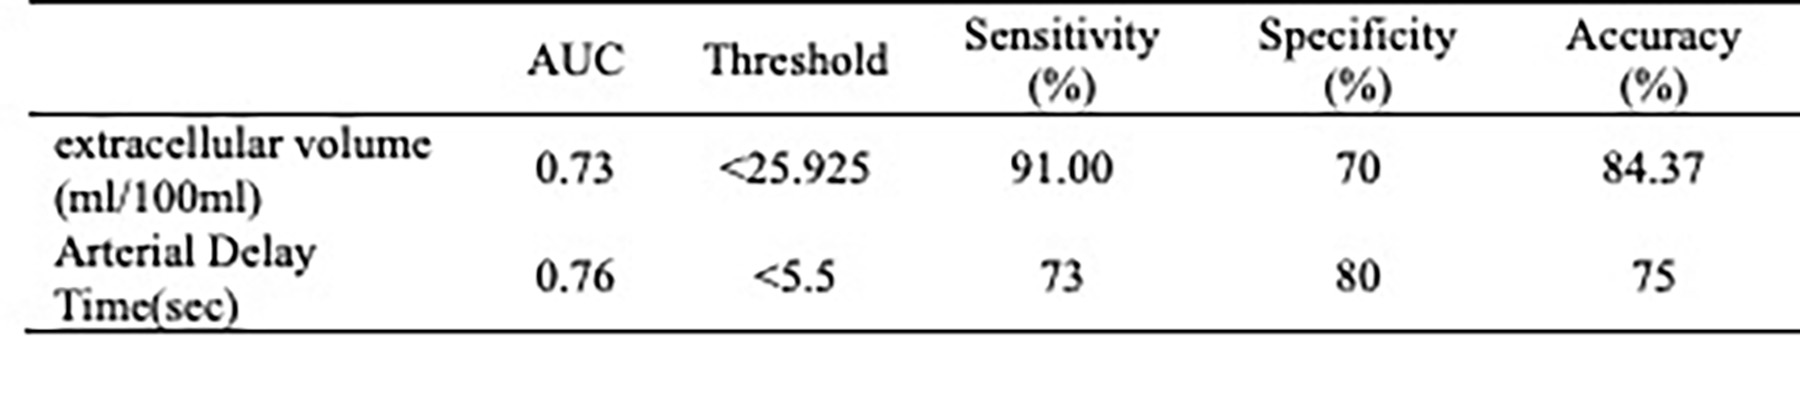
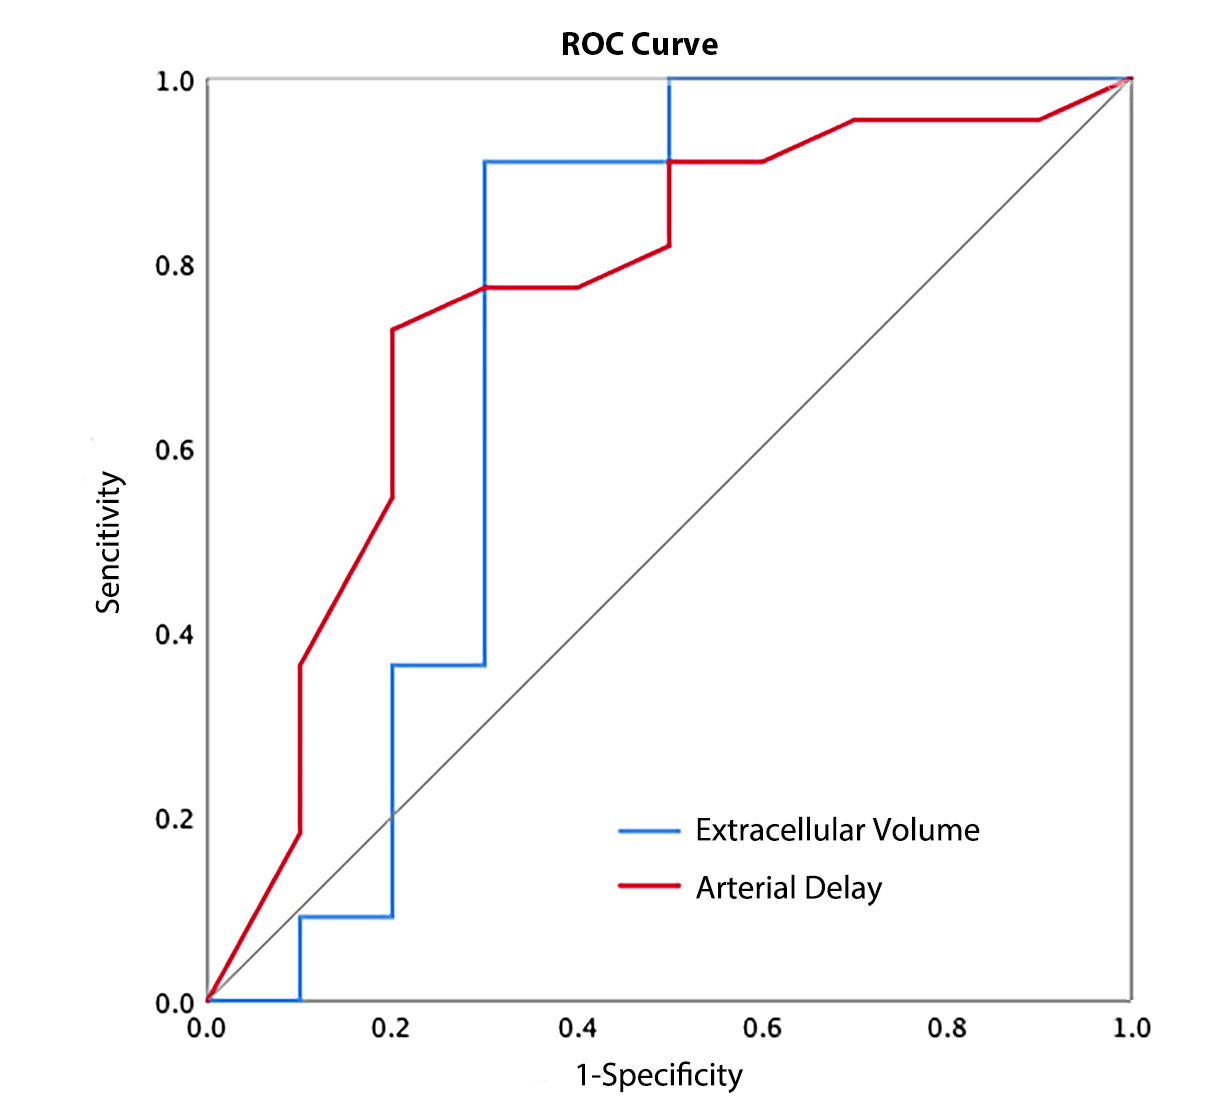
The differences in Fp, Fa, Fv, AF, extracellular MTT, uptake fraction and uptake rate between benign and malignant liver tumors were not statistically significant (all P>0.05). Compared with the benign tumor group, the malignant tumor group had a significantly lower ECV (24.31±8.14 vs. 18.88±4.44 ml/100ml, respectively, P = 0.04) and shorter Ta (9.60±6.08 vs. 4.50±4.81s, respectively, P = 0.02). The details are shown in the Figure 1. Representative cases from two patients are displayed in Figure 2 (benign) and Figure 3 (malignant), respectively. For discriminating benign from malignant lesions, the AUCs of ECV and Ta were 0.73 (sensitivity, 91.00 %; specificity, 70.00 %, accuracy, 84.37%) and o.76 (sensitivity, 73.00 %; specificity, 80.00 %, accuracy, 75.00%) ( Figure 4 and Figure 5).Discussion
This was a preliminary study to investigate the feasibility of quantitative perfusion analyses of GRASP DCE-MRI for differentiating benign and malignant liver lesions. The results suggested the GRASP quantitative parameters were beneficial for distinguishing the pathological characteristics of liver tumor. The values of ECV and Ta were significantly reduced in malignant lesions compared with benign lesions, and exhibited an acceptable diagnostic performance for liver tumors diagnosis.Conclusions
DCE GRASP MRI allows for the assessment of perfusion and differentiation between benign and malignant liver tumors.Keywords
Liver, Magnetic resonance imaging, Perfusion imaging, GRASP.Acknowledgements
Not availableReferences
1. Sun, Y.; Zhu, Q.; Huang, M.; Shen, D.; Zhou, Y.; Feng, Q., Liver DCE-MRI registration based on sparse recovery of contrast agent curves. Med Phys 2021, 48 (11), 6916-6929.
2. Weiss, J.; Ruff, C.; Grosse, U.; Grözinger, G.; Horger, M.; Nikolaou, K.; Gatidis, S., Assessment of Hepatic Perfusion Using GRASP MRI: Bringing Liver MRI on a New Level. Invest Radiol 2019, 54 (12), 737-743.
3. Demerath, T.; Blackham, K.; Anastasopoulos, C.; Block, K. T.; Stieltjes, B.; Schubert, T., Golden-Angle Radial Sparse Parallel (GRASP) MRI differentiates head & neck paragangliomas from schwannomas. Magn Reson Imaging 2020, 70, 73-80.
4. Yoon, J. H.; Lee, J. M.; Yu, M. H.; Hur, B. Y.; Grimm, R.; Sourbron, S.; Chandarana, H.; Son, Y.; Basak, S.; Lee, K. B.; Yi, N. J.; Lee, K. W.; Suh, K. S., Simultaneous evaluation of perfusion and morphology using GRASP MRI in hepatic fibrosis. Eur Radiol 2022, 32 (1), 34-45.
5. Mogen, J. L.; Block, K. T.; Bansal, N. K.; Patrie, J. T.; Mukherjee, S.; Zan, E.; Hagiwara, M.; Fatterpekar, G. M.; Patel, S. H., Dynamic Contrast-Enhanced MRI to Differentiate Parotid Neoplasms Using Golden-Angle Radial Sparse Parallel Imaging. AJNR Am J Neuroradiol 2019, 40 (6), 1029-1036.
6. Feng, L.; Huang, C.; Shanbhogue, K.; Sodickson, D. K.; Chandarana, H.; Otazo, R., RACER-GRASP: Respiratory-weighted, aortic contrast enhancement-guided and coil-unstreaking golden-angle radial sparse MRI. Magn Reson Med 2018, 80 (1), 77-89.
7. Heacock, L.; Gao, Y.; Heller, S. L.; Melsaether, A. N.; Babb, J. S.; Block, T. K.; Otazo, R.; Kim, S. G.; Moy, L., Comparison of conventional DCE-MRI and a novel golden-angle radial multicoil compressed sensing method for the evaluation of breast lesion conspicuity. J Magn Reson Imaging 2017, 45 (6), 1746-1752.
Figures