4797
Electric Potential Energy Optimized 3D Radial Trajectories
Christopher Huynh1, Datta Singh Goolaub1, and Christopher K Macgowan1,2
1Translational Medicine, Hospital for Sick Children, Toronto, ON, Canada, 2Medical Biophysics, University of Toronto, Toronto, ON, Canada
1Translational Medicine, Hospital for Sick Children, Toronto, ON, Canada, 2Medical Biophysics, University of Toronto, Toronto, ON, Canada
Synopsis
Keywords: Data Acquisition, Artifacts, Optimized 3D Trajectory
The commonly used golden angle trajectory for 3D radial dynamic MRI suffers from spiral-shaped sample clustering around the z-axis, often resulting in image streaking artifact. We develop a method that corrects for this for center-out 3D radial trajectories. The electric potential energy of the trajectory is minimized through the use of repulsive forces, producing a spherically uniform distribution while maintaining the quasirandom quality of the golden angle trajectory. ELECTRic potential energy Optimized (ELECTRO) trajectories are relatively inexpensive to obtain and can produce images with lower MSE compared to the golden angle counterpart.Introduction
In MRI, "golden angle" 3D radial trajectories are used because of their versatility in the reconstruction of dynamic images. Under this quasirandom acquisition scheme1, data in a temporal window of arbitrary size will have relatively adequate and non-redundant directional coverage of $$$k$$$-space, enabling 1) post-acquisition choice of the reconstructed temporal resolution and 2) retrospective physiological sorting of the data (e.g. cardiac, respiratory, bulk motion). However, the spokes in this trajectory do not always fill one of the largest gaps in $$$k$$$-space. In fact, the trajectory forms spiral clusters around the z-axis (Figure 1), which can lead to significant loss in image quality.We develop a method for optimizing 3D center-out radial imaging that uses electric/repulsive forces to produce ELECTRic potential energy Optimized (ELECTRO) trajectories. ELECTRO trajectories are quasirandom and do not have any sample clustering.
Proposed Method
The direction of spokes in a 3D center-out radial trajectory can be represented as point charges on the surface of the unit sphere. For a set of $$$N$$$ points, let the set of their positions be $$$S=\left\{r_1,...,r_N\right\}$$$, $$$r_i\in R^3$$$. Let the total electric potential energy (EPE) of $$$S$$$ be$$U(S)=U(r_1,...,r_N)=\sum_{1\leq i<j\leq N}\frac{1}{|r_i-r_j|}.$$
The objective is to find a set of positions that locally minimize $$$U(S)$$$, subject to the constraints $$$|r_i|=1$$$ for $$$i=1,...,N$$$. We carry out the minimization by using gradient descent on each point $$$r_i$$$ simultaneously, and then projecting each point back onto the unit sphere. Thus the steps in the $$$t$$$-th iteration are
$$u=r_i^{(t)}-\gamma^{(t)}\frac{\partial U(S^{(t)})}{\partial r_i^{(t)}}$$
$$r_i^{(t+1)}=u/|u|$$
for $$$i=1,...,N$$$. Evaluating the gradient results in a sum of repulsive forces (dropping the $$$t$$$-th iteration superscript):
$$u=r_i+\gamma\sum_{j=1,j\neq i}^N\frac{r_i-r_j}{|r_i-r_j|^3}.$$
This procedure produces sets of points that tend towards uniformity on the sphere.
We initialize the optimization using the points from the golden angle trajectory1. The step size, $$$\gamma^{(t)}$$$, is allowed to change at every iteration. Since the points at the north/south poles are initially in close proximity to each other, a smaller step size is used for the first few iterations to prevent large displacements, and is then gradually increased as the points spread out. This helps preserve the relative position of the points.
The sum in the update step is expensive to calculate for large $$$N$$$. Instead, it is approximated by only considering a small spherical neighborhood of points around $$$r_i$$$. The animation in Figure 1 shows how the 10000 spoke golden angle trajectory changes throughout the optimization process.
Experiments
A static 160x160x160 digital phantom (MRXCAT) was used in a simulated imaging experiment2. The phantom was filtered using a spherical mask so that its frequency representation could be entirely sampled by a radial trajectory. A set of 24 analytically calculated birdcage coil sensitivity maps were used for $$$k$$$-space simulation and image reconstruction. Seven ELECTRO trajectories were created, with acceleration factors ranging from 1 to 64. Multicoil $$$k$$$-space data was calculated for each ELECTRO trajectory, as well as for the golden angle trajectory. A center-out radial readout without gradient ramping was used, and no noise was added to $$$k$$$-space. Reconstruction was performed using CG-SENSE3. Density compensation factors (DCF) were calculated for each trajectory using an iterative method4.Results and Discussion
Point spread function (PSF) analysis shows that the golden angle PSF has a disk-like structure near the mid xy-plane (Figure 2), likely caused by the sample clustering around the z-axis. The ELECTRO PSFs are improved and do not have this feature. The iterative DCFs used in this work help to compensate for regions with high trajectory overlap, but do not adequately compensate for the spiral clustering, which has large sub-Nyquist spacings between samples.The ELECTRO trajectories have an EPE much closer to that of a uniform radial trajectory (Fibonacci sphere), compared to the golden angle trajectory (Figure 3a). This correlates with a lower MSE in the images produced by the ELECTRO trajectories (Figure 3b). Improvements in the MSE come from both the correction of clustering and the more evenly distributed points around the sphere. We expect that the former reduces coherent streaking artifacts while the latter reduces noise-like artifact.
The orthogonal center planes of the reconstructed images for the 20000 spoke trajectories are shown in Figure 4, along with the difference images. Streaking artifact can be seen in the image using the golden angle trajectory, which is unnoticeable in the image using the ELECTRO trajectory.
To evaluate the quasirandom quality of the ELECTRO trajectory, the EPE of a sliding window of spokes was calculated. Each section of spokes has a different EPE, so the mean of EPE was calculated over all sections. Figure 5 shows this result as a function of different sliding window sizes. The curve corresponding to the ELECTRO trajectory is nearly identical to that of the golden angle trajectory. The 2D bit-reversed trajectory5, another commonly used quasirandom trajectory, is plotted as a reference for comparison.
The optimization objective behind ELECTRO trajectories is relatively general, compared to methods that optimize the sampling pattern based on specific patient anatomies, contrasts, reconstruction algorithms/parameters, and coil geometries6. Such methods would improve image quality, but may require a new optimization whenever a new imaging setting is encountered. ELECTRO trajectories are relatively inexpensive to obtain and remain uncommitted to any of these imaging settings.
Acknowledgements
Funding provided by NSERC Canada - Discovery Grant (RGPIN-2019-06483)References
- R. W. Chan, E. A. Ramsay, C. H. Cunningham, and D. B. Plewes, “Temporal stability of adaptive 3D radial MRI using multidimensional golden means,” Magnetic Resonance in Medicine, vol. 61, no. 2, pp. 354–363, Feb. 2009.
- L. Wissmann, C. Santelli, W. P. Segars, and S. Kozerke, “MRXCAT: Realistic numerical phantoms for cardiovascular magnetic resonance,” Journal of Cardiovascular Magnetic Resonance, vol. 16, no. 63, Aug. 2014.
- K. P. Pruessmann, M. Weiger, P. Bornert, and P. Boesiger, “Advances in sensitivity encoding with arbitrary k-space trajectories,” Magnetic Resonance in Medicine, vol. 46, no. 4, pp. 638–651, 2001.
- N. R. Zwart, K. O. Johnson, and J. G. Pipe, “Efficient sample density estimation by combining gridding and an optimized kernel,” Magnetic Resonance in Medicine, vol. 67, no. 3, pp. 701–710, Mar. 2012.
- K. M. Johnson, S. B. Fain, M. L. Schiebler, and S. Nagle, “Optimized 3D ultrashort echo time pulmonary MRI,” Magnetic Resonance in Medicine, vol. 70, no. 5, pp. 1241–1250, Nov. 2013.
- H. K. Aggarwal and M. Jacob, “J-Modl: Joint model-based deep learning for optimized sampling and reconstruction,” IEEE Journal on Selected Topics in Signal Processing, vol. 14, no. 6, pp. 1151–1162, Oct. 2020.
Figures
Figure 1: Points represent the direction of the spokes in a 3D radial trajectory. The golden angle trajectory contains spiral clustering around the z-axis. The animation shows how the 10000 spoke golden angle trajectory changes throughout the optimization process. The electric potential energy optimized trajectory is more evenly distributed than the golden angle trajectory, and does not contain any sample clustering.
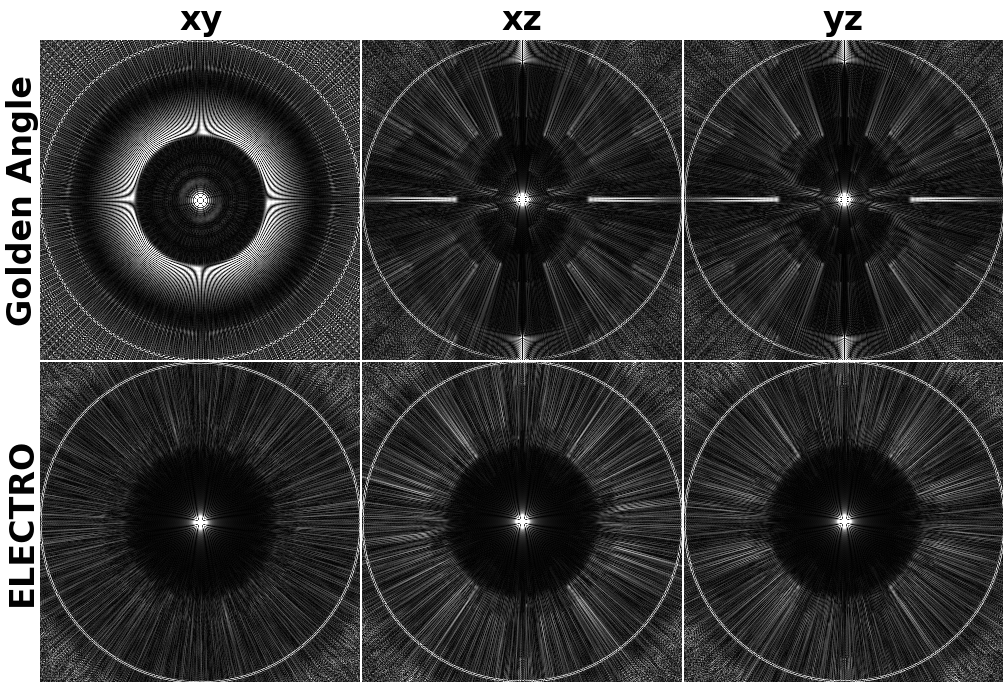
Figure 2: Point spread functions for the 20000 spoke golden angle trajectory and electric potential energy optimized trajectory. The three orthogonal center planes are shown. A disk-like artifact can be seen in the golden angle point spread function, likely caused by the spiral cluster of samples.
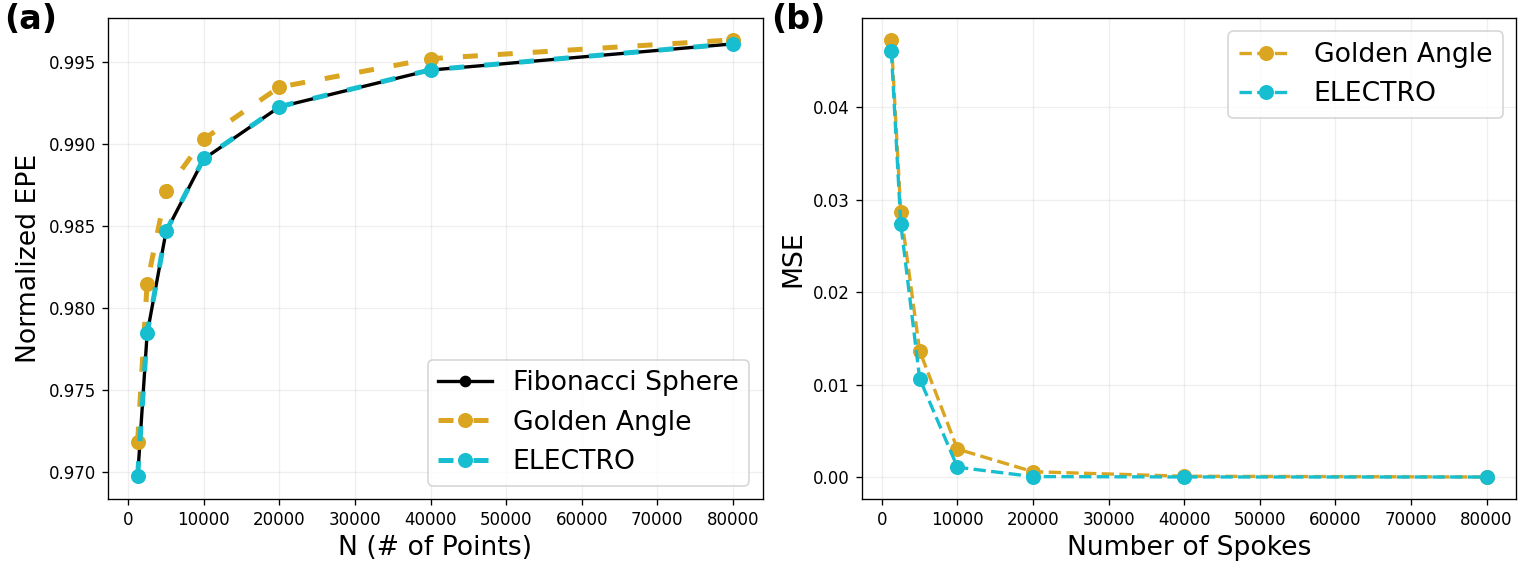
Figure 3: Quantitative comparison between the golden angle and ELECTRic potential energy Optimized (ELECTRO) trajectories, for acceleration factors ranging from 1 to 64. (a) To better visualize differences in EPE, a normalized EPE is calculated instead: $$$U(S)/M$$$, where $$$M=(N^2-N)/2$$$ is the number of pairwise interactions. The ELECTRO trajectory has a normalized EPE much closer to that of uniform radial (the Fibonacci sphere is used here). (b) Using CG-SENSE, the ELECTRO trajectories produce images with lower MSE.
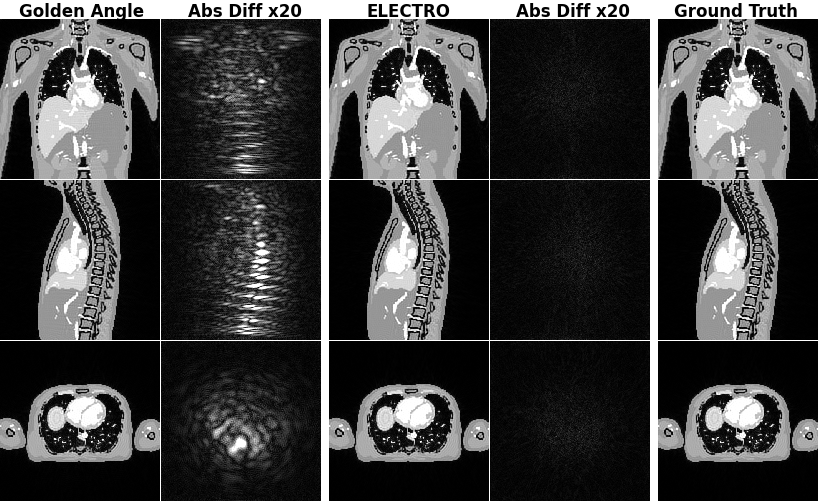
Figure 4: Orthogonal center planes are shown for the 20000 spoke golden angle reconstructed image and the ELECTRic potential energy Optimized (ELECTRO) reconstructed image. Absolute differences were calculated and multiplied by a factor of 20. The golden angle image has significantly higher error. Streaking artifacts can be seen in the golden angle image, while the ELECTRO image has rather unstructured error.
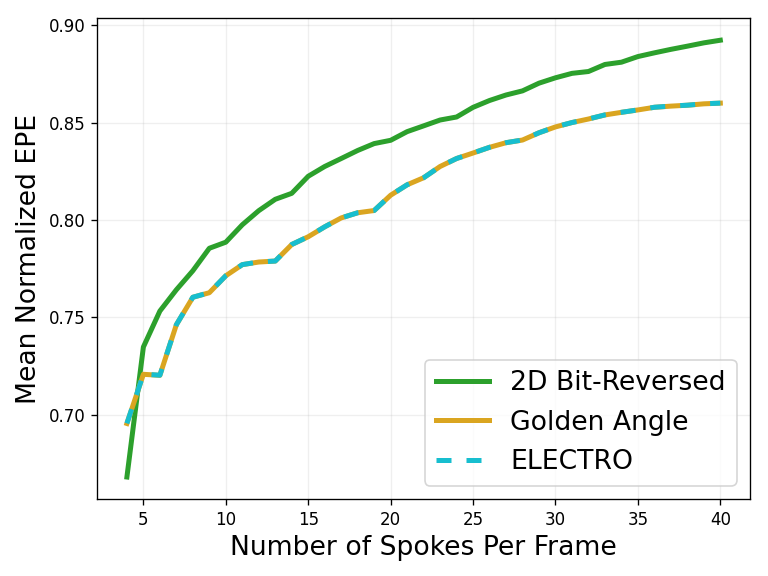
Figure 5: The quasirandom quality of the ELECTRic potential energy Optimized (ELECTRO) trajectory with 80000 spokes was evaluated. The trajectory was divided into real-time frames using a sliding window, and the EPE of each frame was calculated. Then the mean EPE over all frames was calculated. The quasirandomness of the ELECTRO trajectory is very similar to that of the golden angle trajectory. A 2D bit-reversed trajectory is plotted as a reference for comparison.
DOI: https://doi.org/10.58530/2023/4797