4795
Full-brain multi-pathway relaxometry using a golden-angle radial scheme and sparsely-sampled radial spokes1Department of Electrical Engineering, National Sun Yat-sen University, Kaohsiung, Taiwan, 2Department of Computer Science and Engineering, National Sun Yat-sen University, Kaohsiung, Taiwan, 3Department of Radiology, Brigham and Women's Hospital, Harvard Medical School, Boston, MA, United States
Synopsis
Keywords: Data Acquisition, Relaxometry
Quantitative MRI is emerging as a powerful diagnostic tool for neuroimaging applications. A motion-robust, golden-angle radial acquisition version of the ‘triple-echo steady-state’ (TESS) relaxometry method was implemented here, to mitigate the artifacts induced by the flowing motion of the cerebrospinal fluid (CSF). To improve the scan efficiency, a probability density function-based sparse sampling scheme was introduced in each radial spoke. Close agreement was obtained between reference and TESS scans for both T1 and T2 values, using a multi-compartment phantom. In vivo whole-brain results were further obtained (3D T1 and T2 maps, 1-mm isotropic resolution, whole-brain coverage, 7.5-minute scan).Introduction
Quantitative MRI has evolved into a powerful diagnostic and research tool. Multi-pathway imaging approaches (1-3) capture different pathway signals, which can then be processed into maps of MR-related parameters (e.g., T1 and T2). In neuroimaging applications, the flowing motion of the cerebrospinal fluid (CSF) can cause artifacts that disrupt such quantification. Projection-based sampling schemes tend to offer some degree of motion robustness (4,5); as such, we implemented a motion-robust golden-angle radial acquisition version of the relaxometry method ‘triple-echo steady-state’ (TESS) (2), for T1 and T2 mapping of brain tissues. Scan time was reduced through the use of a probability density functions (PDF) applied along each radial spoke, combined with a compressed-sensing reconstruction (6). Validation was performed using a multi-compartment gelatin-based phantom. In vivo whole-brain T1 and T2 maps were further obtained in three healthy volunteers.Materials and Methods
Pulse sequence and acquisition strategyFigure 1A shows the schematic diagram of a 3D TESS sequence, which acquires every TR the +1st, 0th and −1st pathways, an acquisition scheme referred to as [F+1, F0, F−1]. The golden-angle radial acquisition scheme was implemented in the two-dimensional space ky-kz, along with a probability density function (Fig. 1B) to sparsify the sampling along each spoke (Fig. 1C). The central k-space region was fully sampled to enable coil sensitivity estimations. A moderate acceleration setting was chosen for scan time to match that of a Cartesian acquisition. When compared with a “fully-sampled” golden-angle radial acquisition using Fibonacci numbers (7), the acceleration factor was about 2.9.
Image reconstruction and quantification of relaxation times
Figure 2 shows our reconstruction framework to accommodate our undersampled data. F0 signals were extracted for coil sensitivity estimation (8). Each pathway image was then recovered using the following regularized reconstruction:$$ \hat x = arg\ min \{ |\pmb{PFS}x - y|_2^2 + λ_W|\pmb Wx|_1 + λ_{TV}|{\pmb T}x|_1 \}$$
where x and y represent the image to be recovered and the measured k-space data, respectively. In the data consistency term, S, F and P represent the operators for coil sensitivity maps, nonuniform Fourier transform and our PDF-based sampling scheme, respectively. The wavelet (W) and total-variation (T) operators are used for regularization purpose, with weights λW and λTV, respectively. The reconstruction workflow was implemented using the Berkeley Advanced Reconstruction Toolbox (9). After the reconstruction, signal ratios were calculated from the acquired pathway signals (2):
$$S_{T_2}(T_1) = \frac{F_{+1}}{F_0}$$ $$S_{T_1}(T_2) = \frac{F_{-1}}{F_0-F_{+1}}$$
A non-linear least square regression was employed to quantify T1 and T2 in an interleaved matter.
MRI experiments
All MR experiments were performed on a 3.0T system (Siemens Skyra), with a 20-ch coil. For the phantom experiments, a gelatin-based (4%-6%) phantom, doped with a NiCl2 solution (1-7mM) was constructed and imaged. The reference standard for T1 and T2 maps was obtained using the (slower) IRSE and SE pulse sequences. As for the in vivo experiments, 3 healthy subjects (27.3±10y-o, 1 female) were recruited and imaged following informed consent with an IRB-approved protocol. Scanning parameters are listed in Table 1.
Because the TESS quantification of T1 is susceptible to B1+ inhomogeneity (2), a vendor-supported B1+ calibration scan (10) was separately acquired (11 slices, 8mm thickness, 8mm spacing, 1×1mm2 resolution, 18s scan) to prevent B1+-related bias.
Results
A T1-weighted image is shown in Figure 3A to illustrate the ROIs used for analysis. Figures 3B-C show agreement, in terms of calculated T1 and T2 values, between reference and accelerated radial TESS scans. More specifically, the mean difference between reference and TESS results were −5.6 and +5.2ms for T1 and T2, respectively. The 95% limits of agreements for T1 and T2 extended from −59 to 48ms, and from −20 to 30ms, respectively. In Figure 4A, in addition to a less harmful artifact in the void (green arrow), the nonuniform signal behavior near the ventricles (yellow arrows) deems to be a challenge for T1 and T2 quantification in the region. Nonetheless images acquired with radial scheme is visually free from such artifacts. Figure 4B shows 3 slices (out of 192) from the 3D T1 and T2 maps generated here (subject 2). Uniform mapping results in regions around the ventricles suggest little signal contamination from CSF flows.Discussion and Conclusion
A novel 3D acquisition scheme was developed and tested whereby the ky-kz plane is sampled using radial golden-angle PDF-sparsified spokes. Good agreement was demonstrated between reference and TESS-based T1 and T2 quantifications, as the absolute mean differences in T1 and T2 values remained below 6ms.More generally, the present work suggests that accurate 3D whole-brain motion-robust T1 and T2 maps can be generated from a modified TESS sequence with 1-mm isotropic resolution in about 7.5 minutes of scan time. Worth emphasizing, a 192-slice volume was obtained in these 7.5min, which corresponds to a very high rate of ~26 slices/min, about 3-fold faster than a prior TESS study (11) and many times faster than most relaxometry methods. More sophisticated PDFs may, in time, further accelerate the multi-pathway acquisition.
In conclusion, we demonstrated that CSF-related flow artifacts can be mitigated with a golden-angle motion-robust PDF-accelerated radial acquisition scheme. T1 and T2 full-brain coverage was obtained with clinically-relevant resolution (1mm isotropic).
Acknowledgements
Support from NSCT grant 111-2222-E-110-001-MY3 is duly acknowledged.References
1. Welsch GH, Scheffler K, Mamisch TC, Hughes T, Millington S, Deimling M, Trattnig S. Rapid estimation of cartilage T2 based on double echo at steady state (DESS) with 3 Tesla. Magn Reson Med 2009;62(2):544-549.2. Heule R, Ganter C, Bieri O. Triple echo steady-state (TESS) relaxometry. Magn Reson Med 2014;71(1):230-237.
3. Cheng CC, Preiswerk F, Hoge WS, Kuo TH, Madore B. Multipathway multi-echo (MPME) imaging: all main MR parameters mapped based on a single 3D scan. Magn Reson Med 2019;81(3):1699-1713.
4. Zaitsev M, Maclaren J, Herbst M. Motion artifacts in MRI: A complex problem with many partial solutions. J Magn Reson Imaging 2015;42(4):887-901.
5. Pipe JG. Motion correction with PROPELLER MRI: application to head motion and free-breathing cardiac imaging. Magn Reson Med 1999;42(5):963-969.
6. Lustig M, Donoho D, Pauly JM. Sparse MRI: The application of compressed sensing for rapid MR imaging. Magn Reson Med 2007;58(6):1182-1195.
7. Winkelmann S, Schaeffter T, Koehler T, Eggers H, Doessel O. An optimal radial profile order based on the Golden Ratio for time-resolved MRI. IEEE Trans Med Imaging 2007;26(1):68-76.
8. Uecker M, Lai P, Murphy MJ, Virtue P, Elad M, Pauly JM, Vasanawala SS, Lustig M. ESPIRiT--an eigenvalue approach to autocalibrating parallel MRI: where SENSE meets GRAPPA. Magn Reson Med 2014;71(3):990-1001.
9. Uecker M, Rosenzweig S, Holme HCM, Blumenthal M, Tan Z, Wang X, Tamir JI, Lustig M. mrirecon/bart: version 0.6.002020.
10. Chung S, Kim D, Breton E, Axel L. Rapid B1+ mapping using a preconditioning RF pulse with TurboFLASH readout. Magn Reson Med 2010;64(2):439-446.
11. Heule R, Celicanin Z, Kozerke S, Bieri O. Simultaneous multislice triple-echo steady-state (SMS-TESS) T1 , T2 , PD, and off-resonance mapping in the human brain. Magn Reson Med 2018;80(3):1088-1100.
Figures
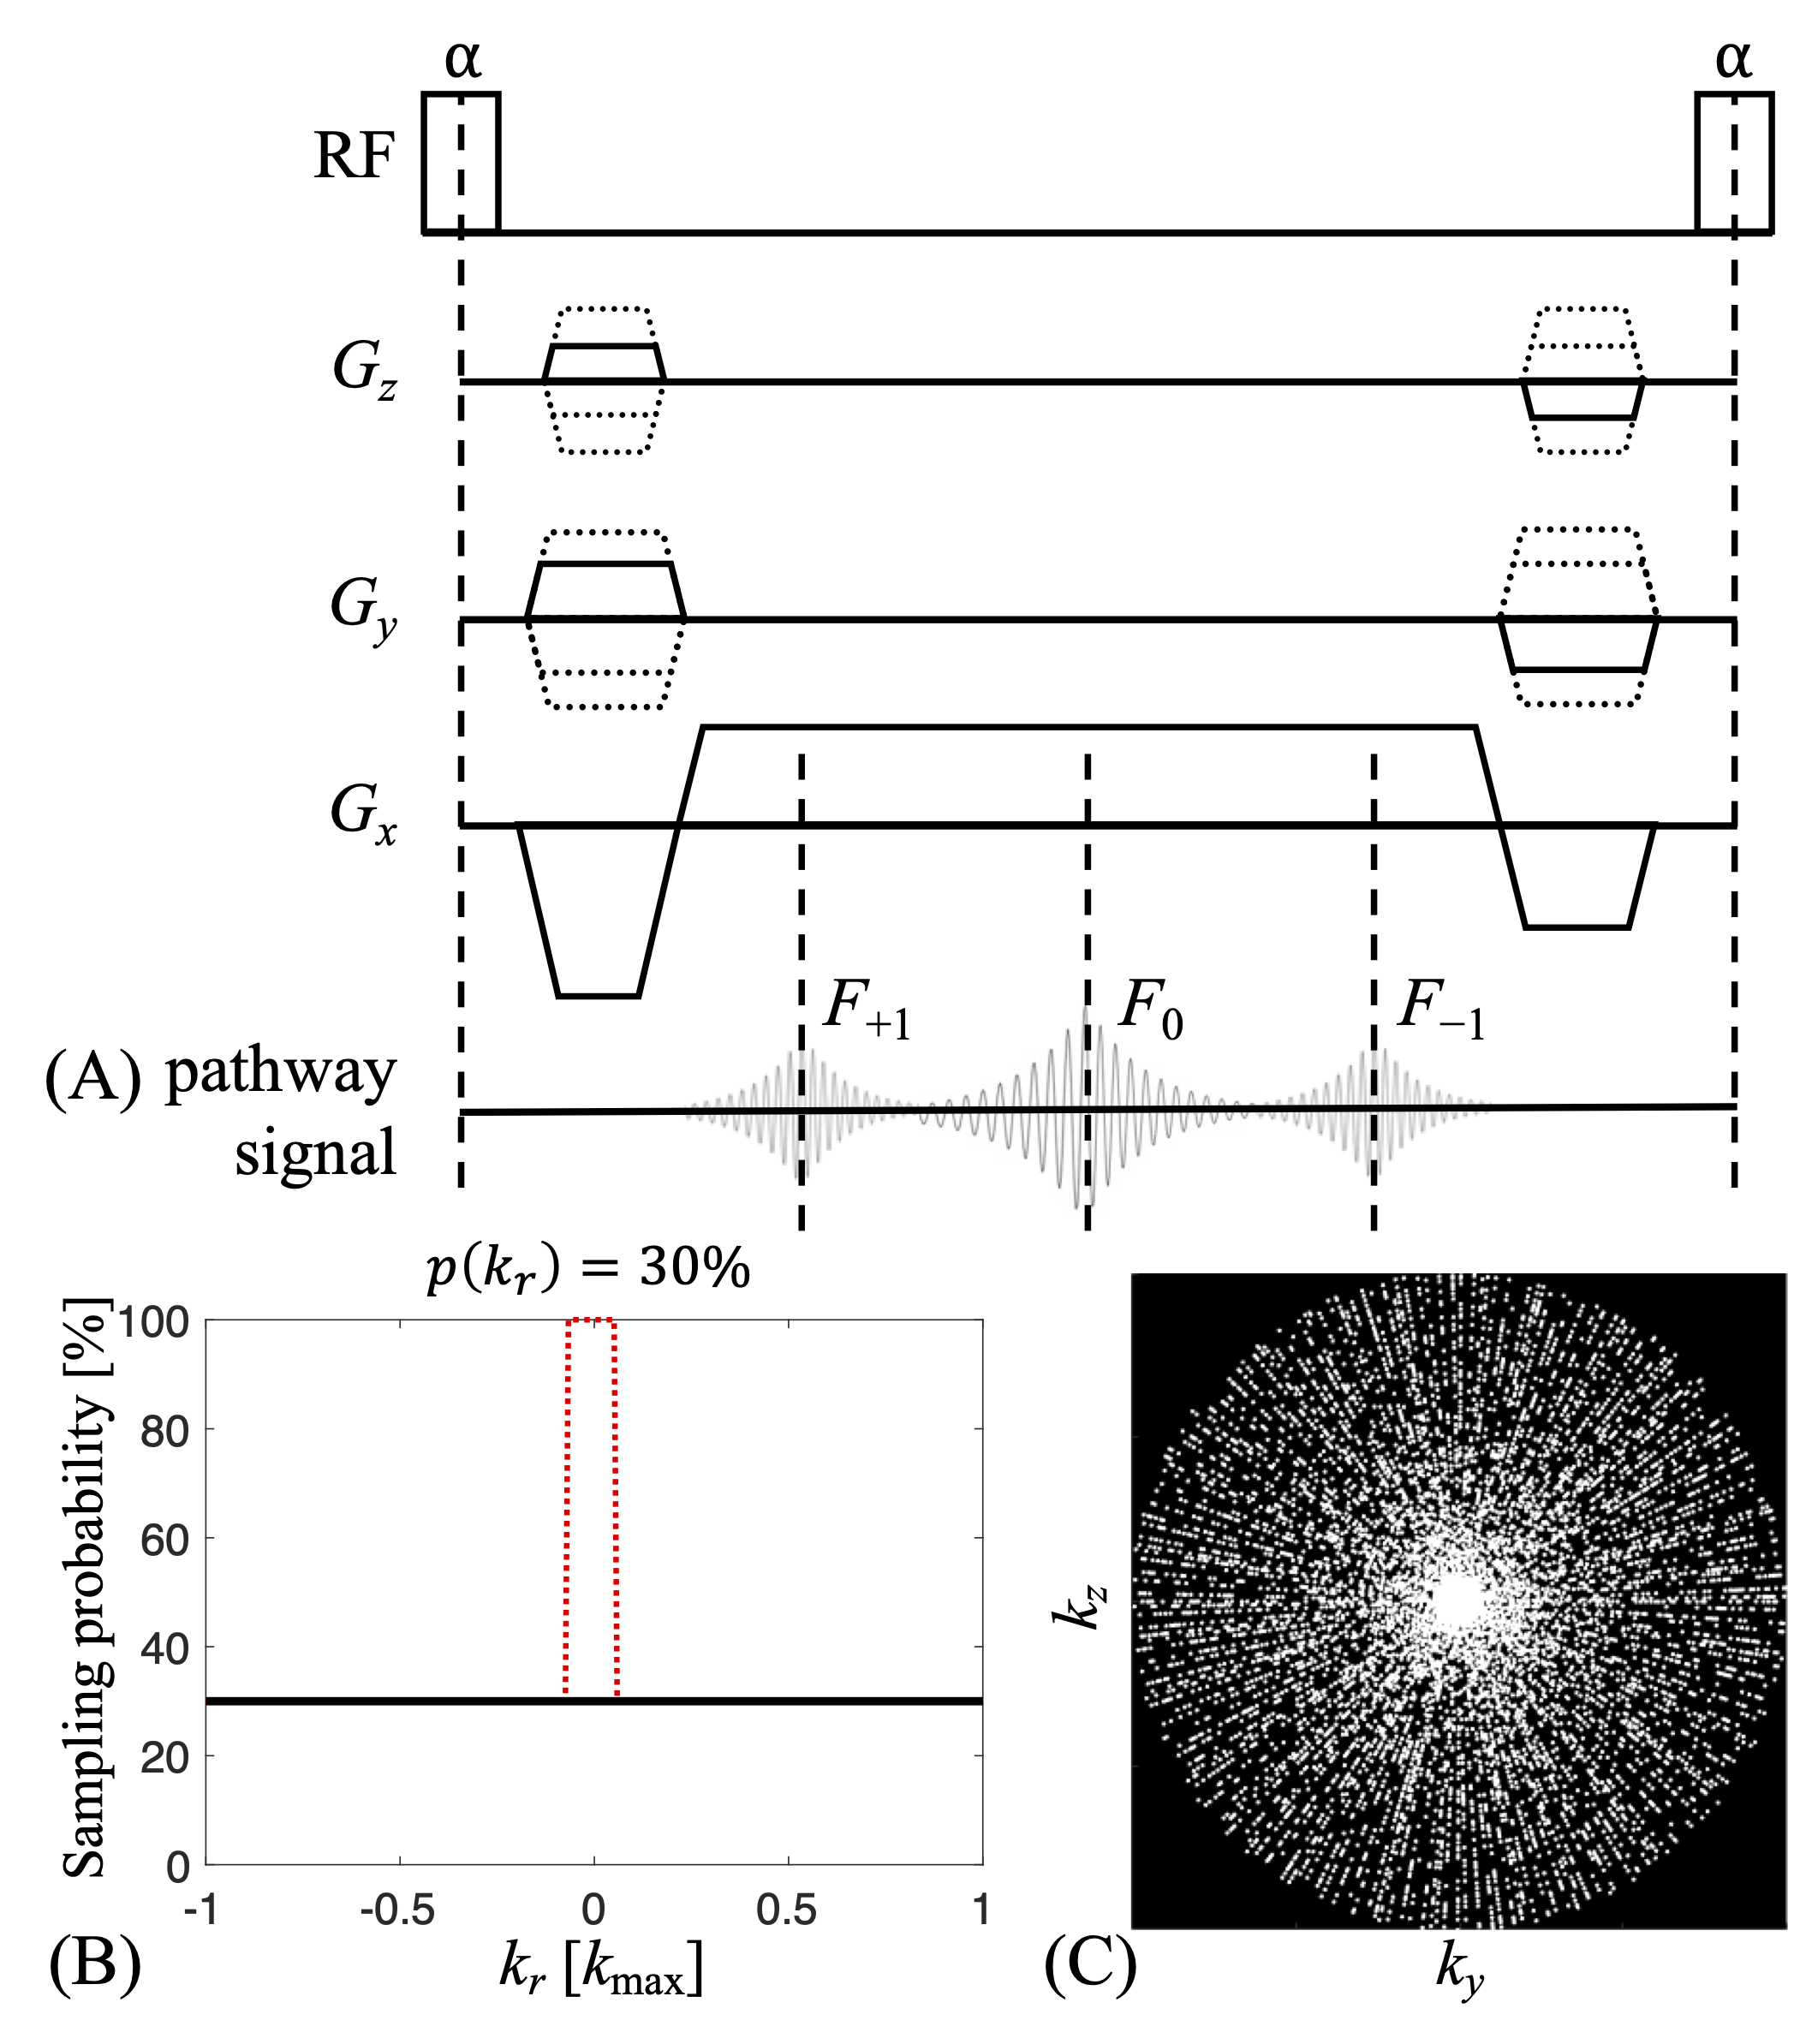
Figure 1. (A) The sequence diagram for the 3D TESS scan and the formation of pathway signals. (B) A uniform probability density function (black solid line), as a function of the k-space distance from center, can be used to randomly sample k-space, resulting in a sparse sampling pattern that can be combined with a golden-angle radial acquisition scheme (C). Specifically for in vivo scans, the central k-space was fully-sampled (red dotted line) for a better estimation of the coil sensitivity maps.
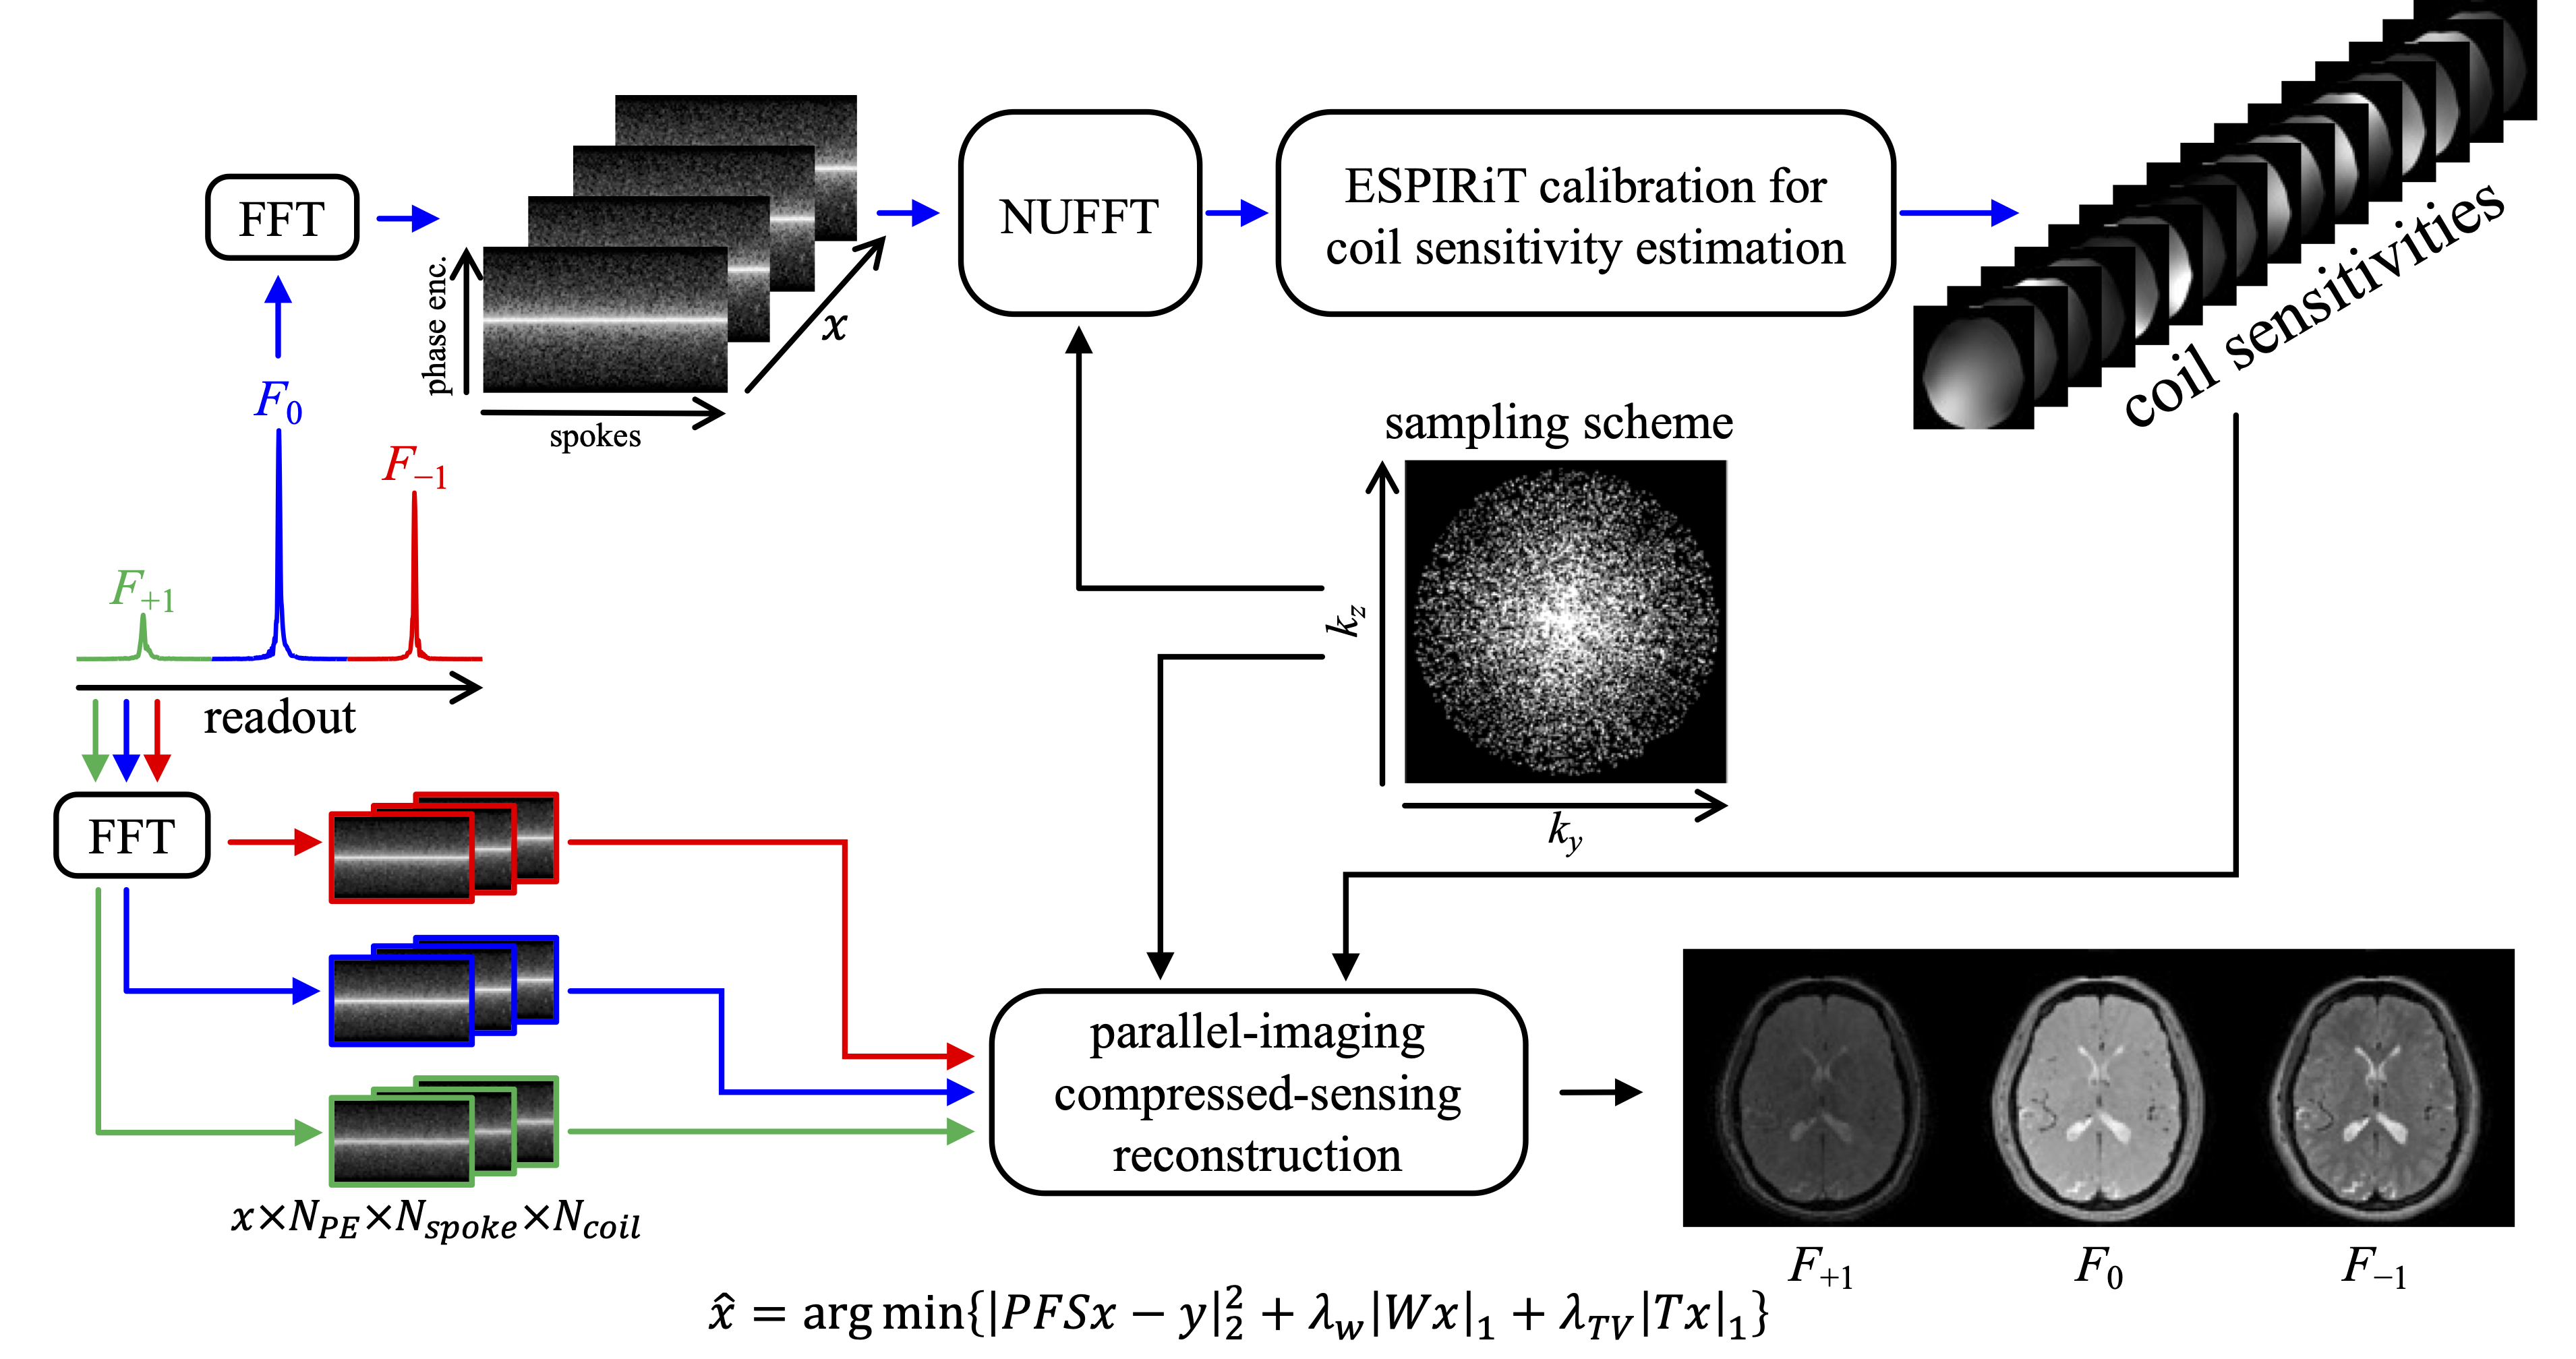
Figure 2. The reconstruction workflow to accommodate our undersampled multi-pathway signals. We combined a PDF-based sampling scheme with the golden-angle radial trajectory (in ky-kz domain) for image acceleration.
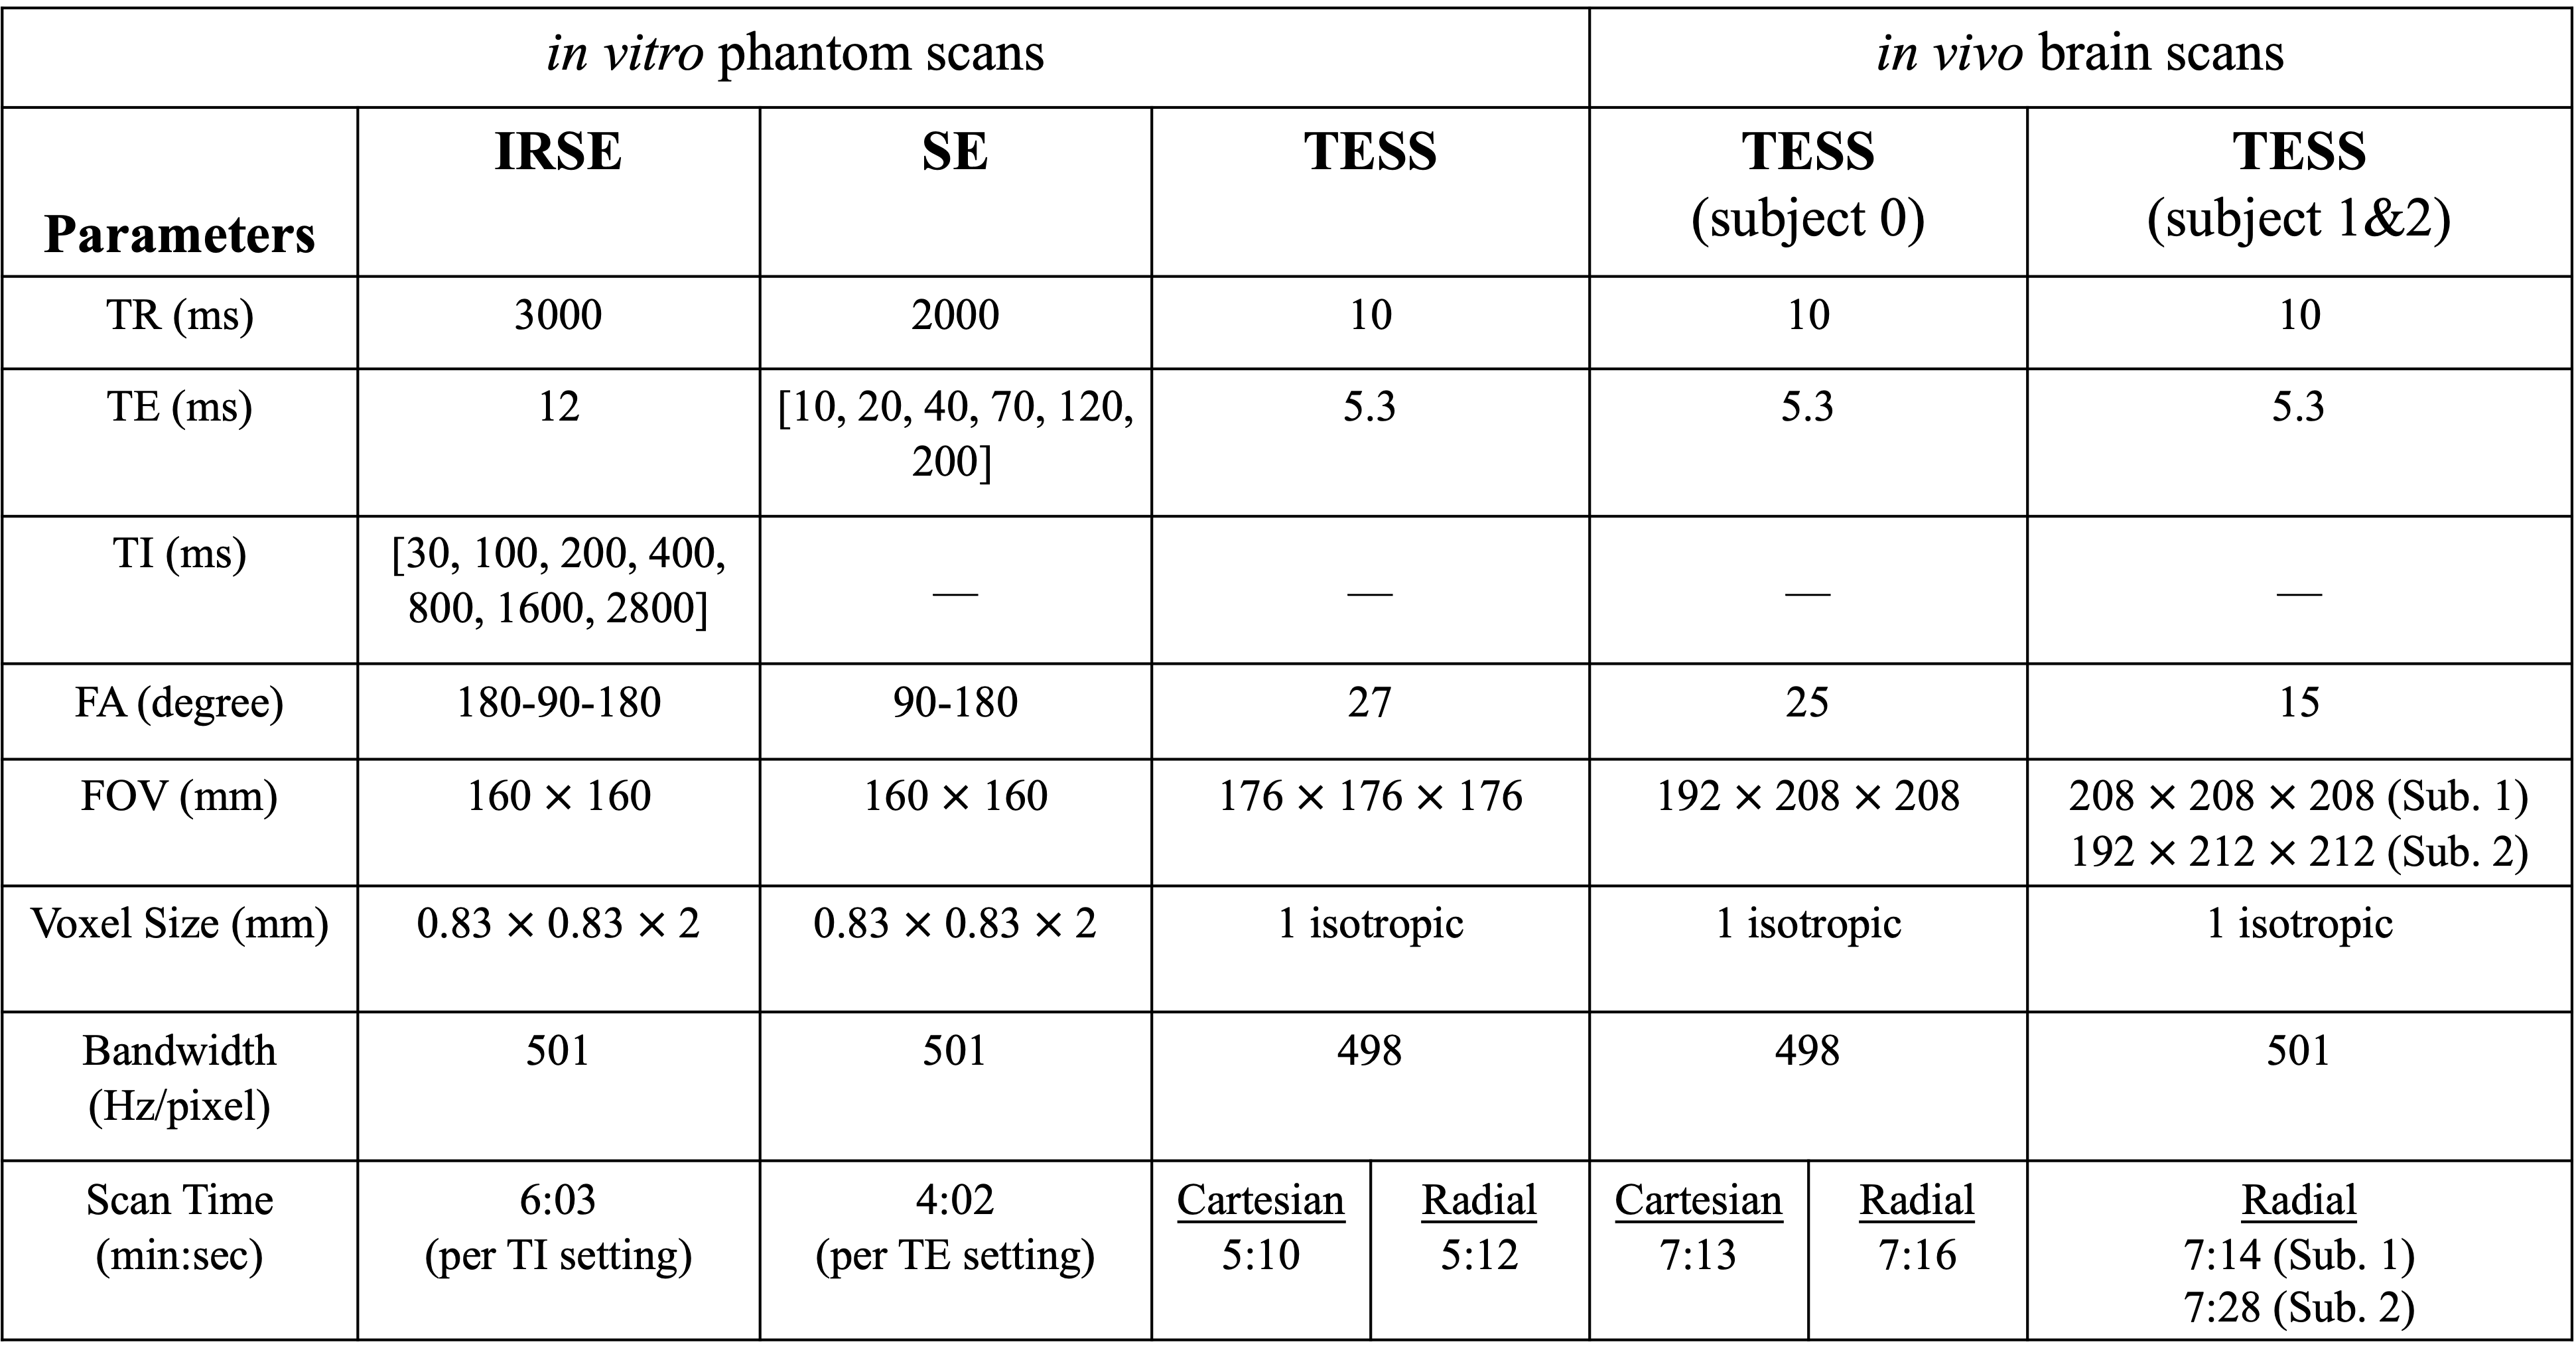
Table 1. Scanning parameters for different pulse sequence. (Abbrev. IRSE: inversion recovery spin echo; SE: spin echo; TESS: triple-echo steady-state. TR: repetition time; TE: echo time; TI: inversion time; FA: flip angle; FOV: field-of-view)
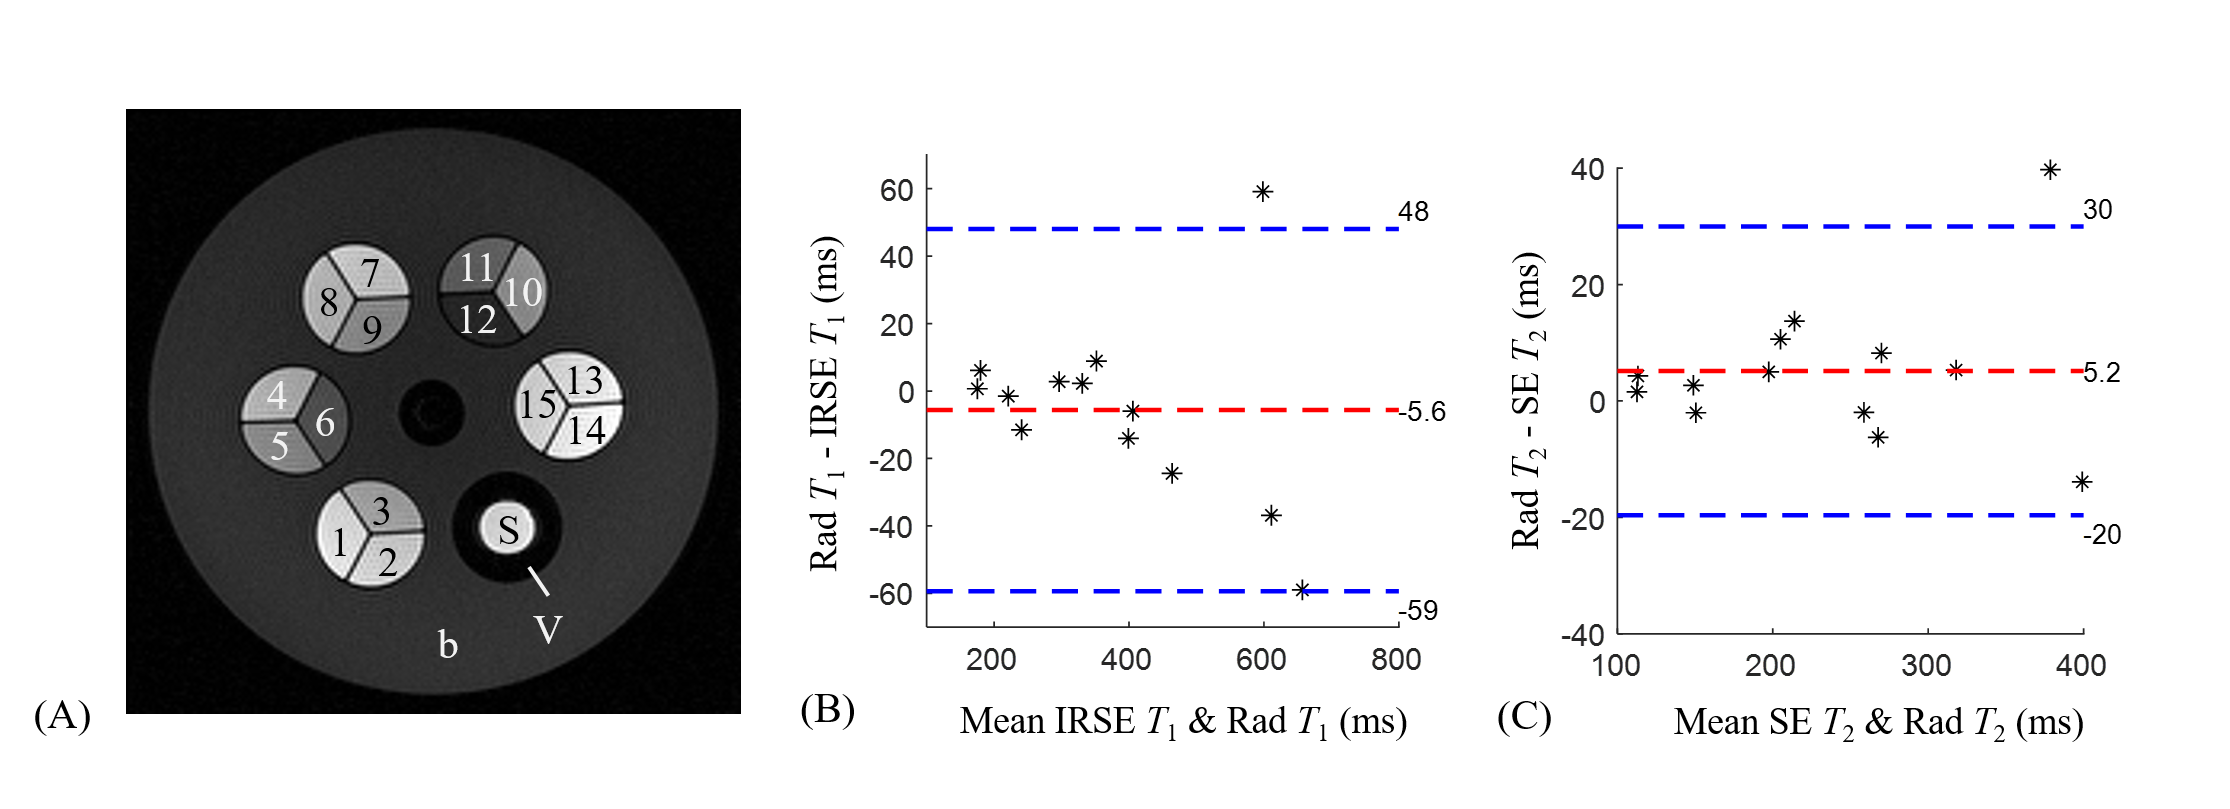
Figure 3. (A) A T1-weighted image of the phantom shows the ROIs for each sample. The Bland-Altman plots compares the T1 (B) and T2 (C) results using reference and accelerated radial TESS scans. The blue and red lines stand for 95% limits of agreement and mean difference, and consistent results were observed. Compartments 13-15, S, and V are not included as they were not designed for the purpose of the quantification. (Abbrev.: S, saline water; V, Vaseline; b, base gelatin solution.)
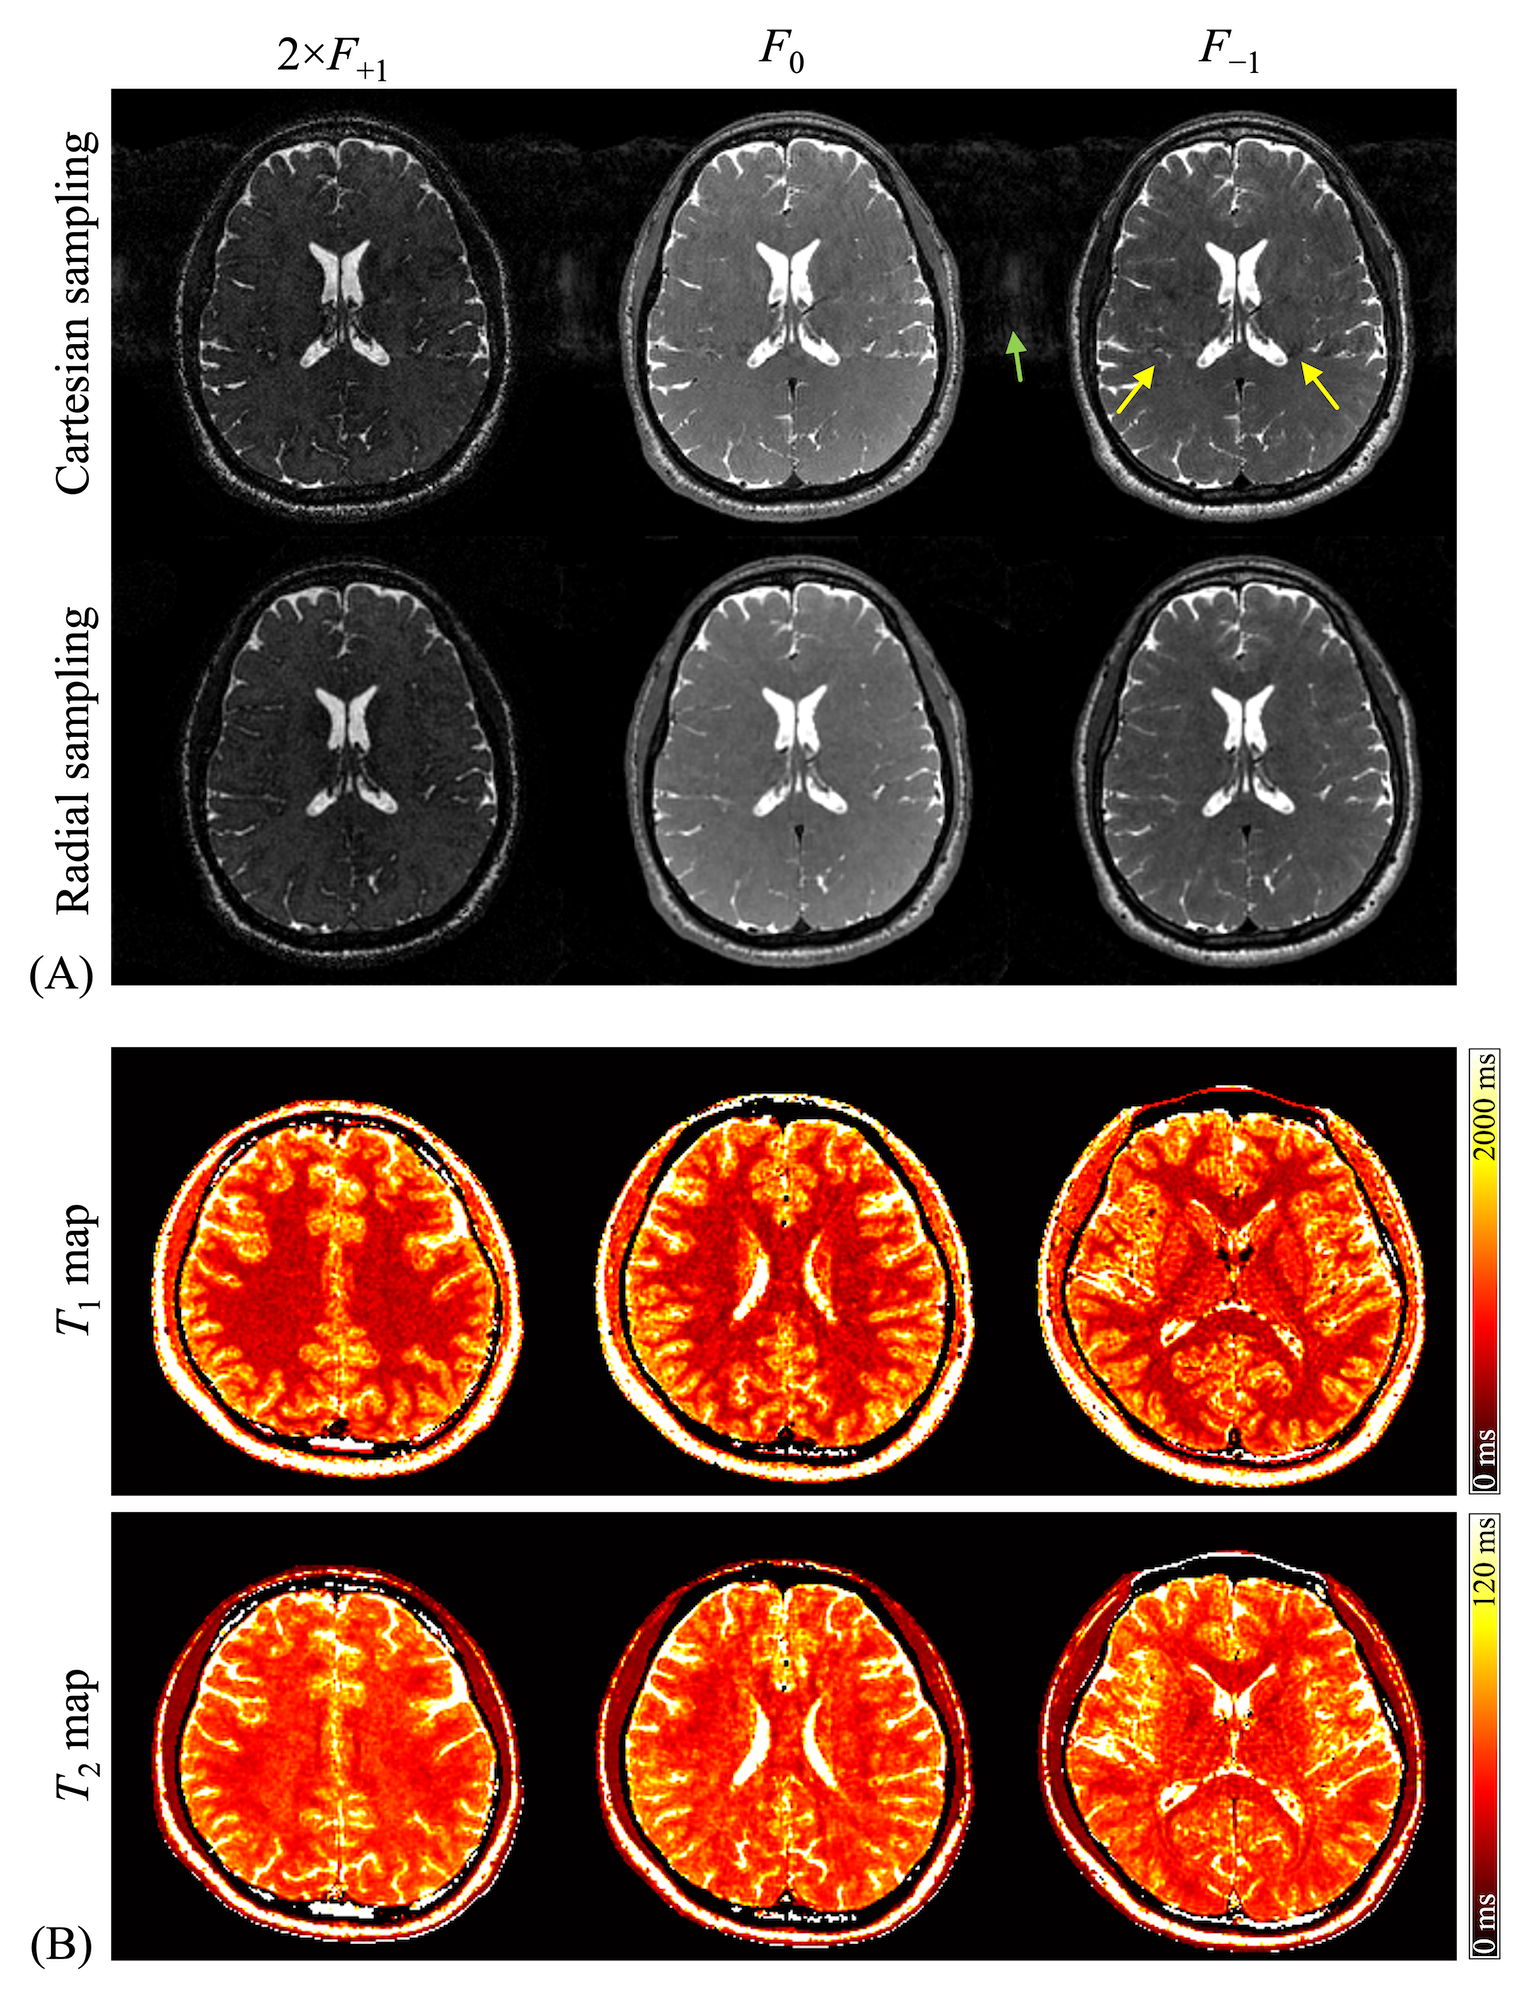
Figure 4. (A) Comparison of pathway images (subject 0) acquired with Cartesian (top) and radial (bottom) sampling schemes. While CSF flow artifacts (yellow arrows) are conspicuous in images acquired with Cartesian sampling, they are much reduced in those acquired with the proposed scheme. (B) Three slices (out of 192) of T1 and T2 quantitative maps are shown (subject 2). A uniform PDF was utilized to accelerate this golden-angle radial acquisition to match the scan time of a corresponding Cartesian scan of the same image size.