4769
Neuromelanin Imaging at 0.5T Reveals Elongated T1 in Neuromelanin-Rich Brain Regions In Vivo
Jeff Stainsby1, Andrew Curtis1, Sofia Chavez1, and Chad Harris1
1MR, Synaptive Medical, Toronto, ON, Canada
1MR, Synaptive Medical, Toronto, ON, Canada
Synopsis
Keywords: Psychiatric Disorders, Contrast Mechanisms, Neuromelanin
Mid-field imaging benefits from increased T1 tissue differentiation and reduced SAR constraints for generating MT contrast. These were leveraged in imaging of neuromelanin containing structures at 0.5T. Elevated T1 values in the substantia nigra and locus coeruleus were demonstrated. Contrary to T1-weighted approaches reported in the literature a proton density weighted fast spin echo approach is shown to provide improved visualization at mid-field and implies modified strategies at higher field would be beneficial.Introduction
Neuromelanin MR imaging (NM-MRI) enables the visualization of neuromelanin-containing nuclei such as the substantia nigra pars compacta (SN) and locus coeruleus (LC). Differences in NM-MRI signal, relative to healthy controls, has been suggested as a biomarker for dopamine dysfunction in disorders [1, 2] with a reduction in signal observed in major depressive disorder, Parkinson’s disease and Alzheimer’s disease, and an increased neuromelanin signal in schizophrenia. While the precise biological source of the NM-MRI contrast remains unclear [3, 4], a common assumption is a combination of T1 shortening in the neuromelanin containing neurons [5, 6] and magnetization transfer (MT) mediated suppression of the surrounding myelin rich white matter. To the best of our knowledge, no T1 shortening has been definitively shown in vivo, whereas MT-mediated suppression has been demonstrated [7, 8].High magnetic fields (i.e. 3T or above) have been thought to be a prerequisite for neuromelanin imaging [9]. However, imaging at mid-field offers several benefits. T1-mediated brain tissue contrast varies with field strength, with peak contrast occurring around 0.25-0.5T [10] and dropping rapidly towards 3T and beyond. Furthermore, the drastic reduction in tissue heating at 0.5T versus higher field enables higher B1 pulses, increasing MT effects without reaching SAR limits. The purpose of this work was to leverage T1-mediated brain tissue contrast and increased MT effects in the mid-field to overcome existing limitations and improve the imaging of neuromelanin containing neurons.
Methods
Imaging of healthy volunteers was performed with informed consent in compliance with health and safety protocols. Images were acquired on a head-only 0.5T system (Synaptive Medical, Toronto) equipped with an 8-channel head coil. To guide an effective NM-MR imaging strategy at 0.5T, a variable-flip angle (VFA) approach [11] was used to generate quantitative T1 and proton density maps (3D SPGR, 1 mm isotropic, flip angles 5, 15, 25, 35°) in 2 subjects. Axial and coronal 2D FSE (0.9x0.9x2.2mm, 8 echoes, 9min) with either proton density (PD) weighting (3 subjects, TR 2800 ms, 48 slices, 24 slices-per-tr, 3 avg) or T1-weighting (1 subject, TR 280 ms, 6 slices, 3 slices-per-tr, 30 avg) were acquired with a maximum number of slices per TR, and equal number of RF pulses for equal scan time, comparable SNR and matched MT effects.Results
T1 mapping clearly demonstrates both elevated T1 and PD in the SN and LC compared to surrounding tissue [Fig 1]. The mean T1 value from manually drawn ROIs within the left and right substantia nigra over 2 subjects was 714 +/- 68 ms and in the locus coeruleus was 830 +/- 38 ms. This is substantially higher than the mean T1 value from ROIs in myelinated tissue neighboring the SN (572 +/- 40 ms). Thin section, PD-weighted, FSE shows clear, hyperintense signal in the SN and LC [Fig 2] whereas the T1-weighted FSE variant does not clearly visualize the SN and LC. The LC was consistently depicted in all 3 subjects and is well visualized in coronal PD-weighted FSE images [Fig 3].Discussion
Contrary to the assumption of reduced T1 in previous work [5, 6], our T1 mapping results clearly demonstrate an increased T1 relaxation time in neuromelanin containing structures (SN and LC). In addition, increased proton density was also observed in these structures consistent with Priovoulous [4].Prior NM-MRI approaches have routinely included T1-weighted FSE imaging to produce bright signal due to the assumption of shortened T1. Given that T1 is elongated in these regions, neuromelanin contrast in T1-weighted FSE will suffer from competing effects – compared to surrounding tissues there will be increased signal in the SN and LC due to proton density and MT-effects but reduced signal due to T1-weighting. We demonstrate that a PD-weighted FSE approach maximizes the complementary contributions of proton density and MT-effects while minimizing competing T1-weighting, enabling clear visualization of neuromelanin containing structures. We note that at higher field strengths the relative T1 differences will be less, somewhat reducing the competing contrast effects of T1 and MT and PD, however contrast will still be reduced.
Conclusions
Higher T1s and proton densities in neuromelanin-containing structures compared to surrounding tissues were observed, contrary to previous assumptions. With the increased brain tissue T1 contrast available at 0.5T, a combined MT plus PD weighting yield effective visualization of neuromelanin containing nuclei at 0.5T.Acknowledgements
No acknowledgement found.References
- E Shibata et al, NeuroReport, 2006
- A Guinea-Izquierdo et al, PeerJ, 2021
- X Chen et al, MRI, 2014
- N Priovoulos et al, Brain Structure and Function, 2020
- WS Enochs et al, Radiol, 1997
- P Trujillo, Magn Res Med, 2016
- T Nakake et al, Magn Reson Med Sci, 2008
- N Priovoulos et al, NeuroImage, 2018
- M Sasaki et al, NeuroReport, 2006
- HW Fischer et al, MRM, 1990
- HZ Wang et al, Magn Reson Med, 1987
Figures
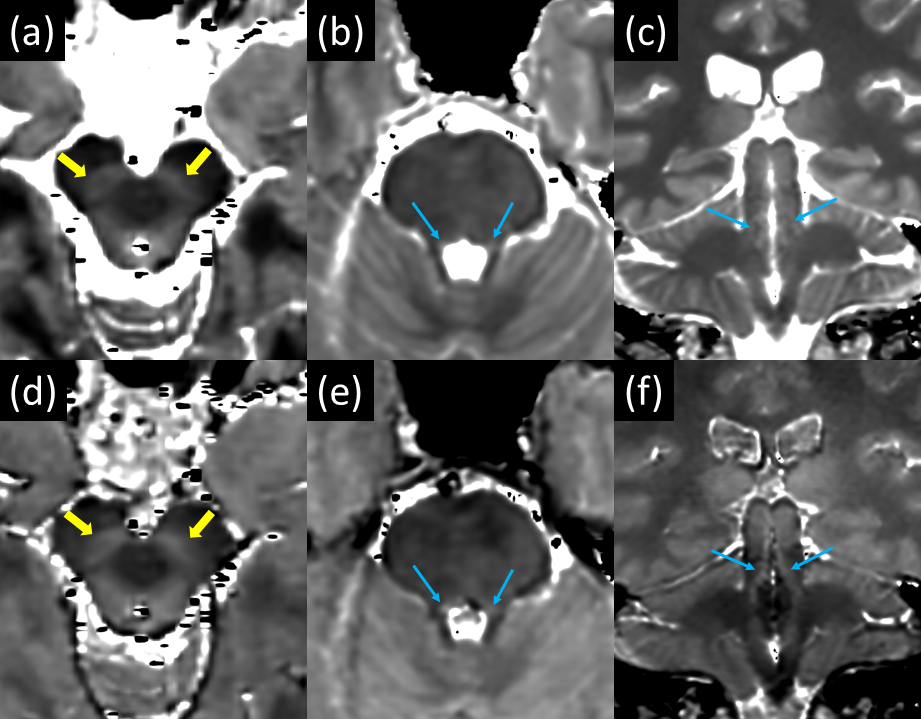
Figure 1: T1 mapping
results in neuromelanin containing structures. Quantitative T1 maps (a-c) and proton
density (PD) maps (d-f) are shown. Clear depiction of the SN (yellow arrows) in
Axial images in both T1 (a) and PD (d) maps are seen. Depiction of the LC (blue
arrows) in Axial (b, e) and Coronal (c, f) reformatted images in both the T1 (b,
c) and PD (e, f) maps are seen.
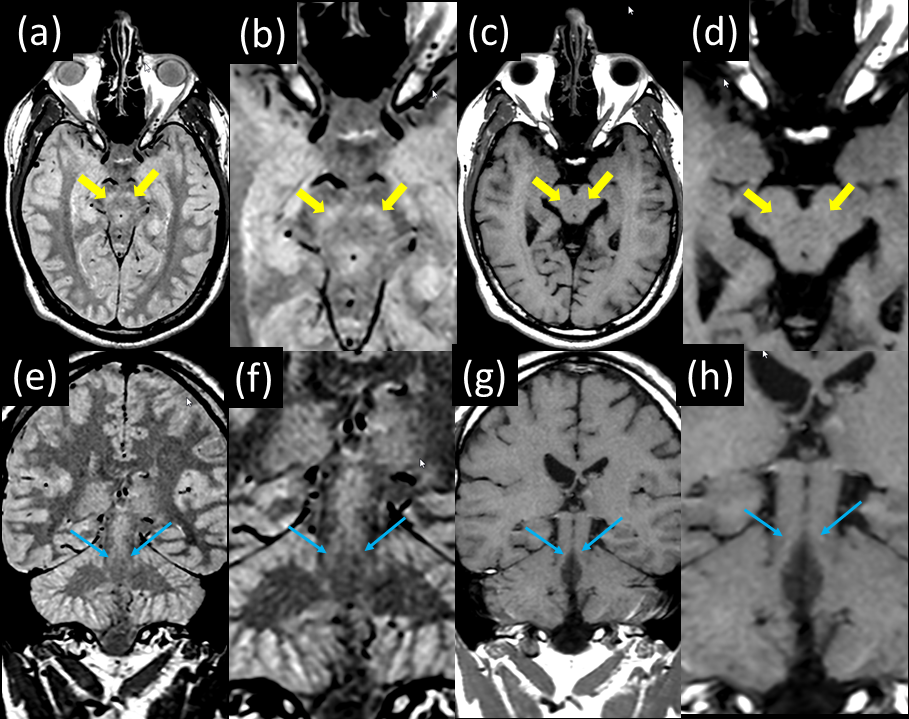
Figure 2: Normal and zoomed
in views of thin slice PD- plus MT-weighted FSE scans (a,b,e,f) versus T1-weighted FSE (c,d,g,h)
scans. The SN (yellow arrows) and LC (blue arrows) are clearly depicted with hyperintense
signal in the PD- plus MT-weighted contrast (a,b,e,f). Poor visualization of
these same structures is observed in the predominantly T1-weighted scans (c,d,g,h).
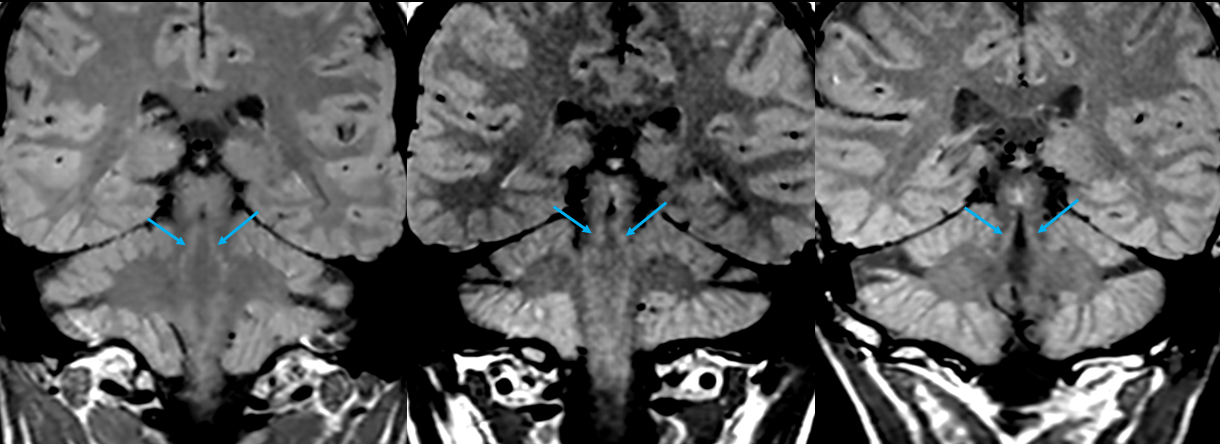
Figure 3: The LC is
clearly depicted (blue arrows) in 3 consecutive subjects when imaged using a thin
section coronal PD- plus MT-weighted FSE acquisition.
DOI: https://doi.org/10.58530/2023/4769