4766
Investigation of nonuniform bias field in quantitative analysis of neuromelanin-sensitive MR imaging1Department of Biomedical engineering, Hankuk University of Foreign Studies, Yongin, Korea, Republic of, 2Department of Neuropsychiatry, Pusan National University Yangsan Hospital, Yangsan, Korea, Republic of
Synopsis
Keywords: Psychiatric Disorders, Psychiatric Disorders, neuromelanin, bias field correction
Neuromelanin-sensitive MR imaging is an indirect method for assessing dopamine function. However, quantitative and objective analysis of NM-MRI is difficult because of field inhomogeneities or motion artifacts. To investigate the effect of nonunifrom bias field on quantitative analysis in NM-MRI, synthesized random bias fields were multiplied and compared the quantitative analysis using SN ROIs and reference ROIs. The results show a weak nonuniform bias field can reduce the reliability of quantitative analysis.Introduction
Neuromelanin-sensitive MR imaging (NM-MRI) has been introduced as an indirect method for assessing dopamine function1-4. However, quantitative and objective analysis of NM-MRI is difficult because single-scan MR image is inherently not quantitative and is affected by several factors such as field inhomogeneities or motion artifacts. To solve this problem, previous studies evaluated the normalized signal in the substantia nigra (SN) region using the reference ROI signal such as crus cerebri or red nucleus. However, it may be difficult for such normalization to eliminate the effect of the nonuniform bias field, a low-frequency multiplicative field, on MR images. In this study, we investigate the effects of the bias field on quantitative analysis of NM-MRI by adding simulated random bias fields.Methods
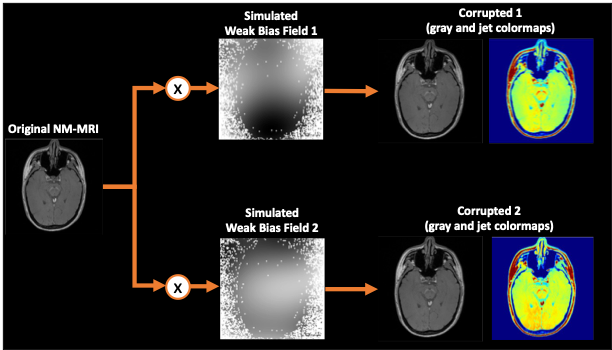
[Dataset] In this study, a total of 94 subjects (52 healthy controls and 42 first-episode psychosis) were included. NM-MRI data was collected using a 3D gradient-echo sequence with magnetization transfer pulses at 3T MRI5,6.To investigate the effect of nonuniform bias field on quantitative analysis in NM-MRI, synthesized random bias fields were multiplied by original NM-MRI as shown in Figure 1. The bias fields were generated by 4th degree polynomials with random coefficients. The range of random coefficients were experimentally determined by observing the corrupted images. In this step, the multiplied bias field was weakened to an inconspicuous level in grayscale. Lastly, for the corrupted images, N4-bias field correction methods were applied to assess the effectiveness of the nonuniform bias-field correction method.
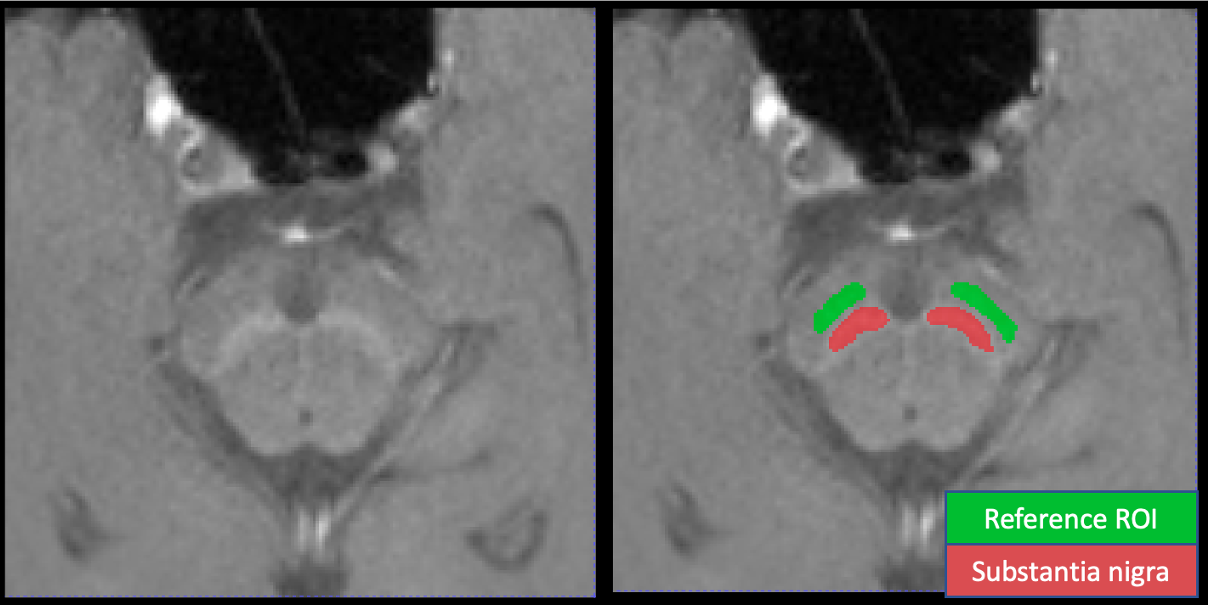
[Quantitative feature extraction] SN regions of interest (ROIs) were segmented by an deep learning based automated segmentation algorithm8. In addition, reference ROI (ref-ROIs)9 was also defined for signal intensity normalization as shown in Figure 2. Using the NM-MRI and SN ROIs, the two quantitative features (mean and skewness) were calculated. For two differently generated random bias fields, the feature values were compared using Pearson correlation coefficients.
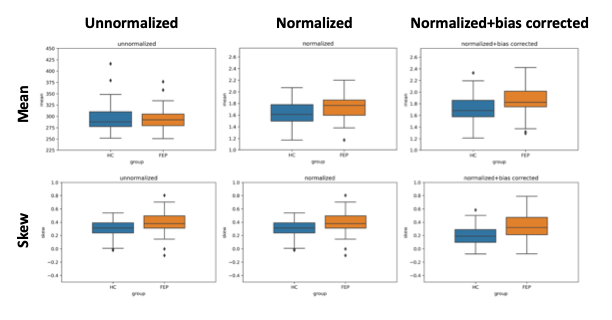
[Group analysis] To investigate the effects of correction methods on group analysis, we compared quantitative features between the healthy controls (HC) and first-episode psychosis (FEP) groups before and after intensity normalization and bias corrections for original NM-MRI.
Results
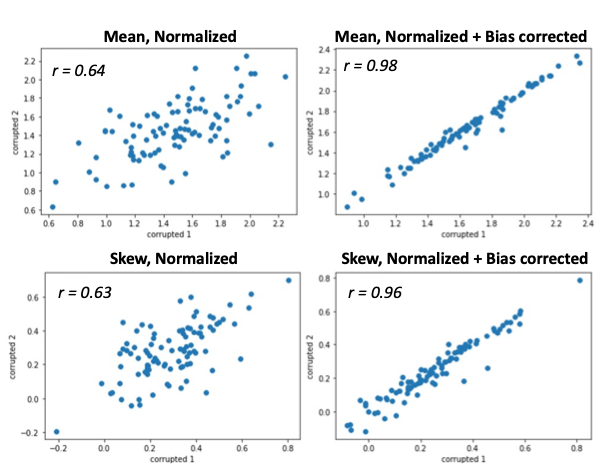
Figure 3 shows the calculated feature values on SN correlation between the two corrupted images. When weak random bias fields were added, the results showed a significantly decreased correlation coefficients between the two cases even though reference ROI-based intensity normalization was applied. However, when the bias field correction is applied, the correlations between the two cases showed sufficiently high values. Figure 4 shows the group analysis results of the quantitative comparison for the two features (mean and skewness). Before the normalization and bias correction were applied, the difference of the features between the two groups was insignificant. When the corrections were applied, the larger values appeared in the FEP group for both mean and skewness.Conclusion
Our results suggest that even a weak nonuniform bias field can reduce the reliability of quantitative analysis of NM-MRI. Therefore, an appropriate correction method such as N4-bias correction will help more reliable analysis. Additional experiments will be required to confirm the effects of bias field and its correction method in clinical data.Acknowledgements
No acknowledgement found.References
1. Sasaki, M.; Shibata, E.; Tohyama, K.; Takahashi, J.; Otsuka, K.; Tsuchiya, K.; Takahashi, S.; Ehara, S.; Terayama, Y.; Sakai, A. Neuromelanin magnetic resonance imaging of locus ceruleus and substantia nigra in Parkinson's disease. Neuroreport 2006, 17, 1215-1218.
2. Schwarz, S. T.; Afzal, M.; Morgan, P. S.; Bajaj, N.; Gowland, P. A.; Auer, D. P. The ‘swallow tail’appearance of the healthy nigrosome–a new accurate test of Parkinson's disease: a case-control and retrospective cross-sectional MRI study at 3T. PloS one 2014, 9, e93814.
3. Noh, Y.; Sung, Y. H.; Lee, J.; Kim, E. Y. Nigrosome 1 detection at 3T MRI for the diagnosis of early-stage idiopathic Parkinson disease: assessment of diagnostic accuracy and agreement on imaging asymmetry and clinical laterality. Am. J. Neuroradiol. 2015, 36, 2010-2016.
4. Ueno, F.; Iwata, Y.; Nakajima, S.; Caravaggio, F.; Rubio, J. M.; Horga, G.; Cassidy, C. M.; Torres-Carmona, E.; de Luca, V.; Tsugawa, S. Neuromelanin accumulation in patients with schizophrenia: A systematic review and meta-analysis. Neuroscience & Biobehavioral Reviews 2021.
5. Nam, Y.; Shin, N.; Kim, E. Y. Simultaneous imaging of neuromelanin and nigrosome 1 in substantia nigra using 3D multi-echo gradient echo acquisition with magnetization transfer preparation.
6. Nam, Y.; Gho, S. M.; Kim, D. H.; Kim, E. Y.; Lee, J. Imaging of nigrosome 1 in substantia nigra at 3T using multiecho susceptibility map-weighted imaging (SMWI). J. Magn. Reson. Imaging 2017, 46, 528-536.
7. Van Leemput, K.; Maes, F.; Vandermeulen, D.; Suetens, P. Automated model-based tissue classification of MR images of the brain. IEEE Trans. Med. Imaging 1999, 18, 897-908.
8. Kang, J.; Kim, H.; Kim, E.; Kim, E.; Lee, H.; Shin, N.; Nam, Y. Convolutional Neural Network-Based Automatic Segmentation of Substantia Nigra on Nigrosome and Neuromelanin Sensitive MR Images. Investig Magn Reson Imaging 2021, 25.
9. Gaurav, R.; Yahia‐Cherif, L.; Pyatigorskaya, N.; Mangone, G.; Biondetti, E.; Valabrègue, R.; Ewenczyk, C.; Hutchison, R. M.; Cedarbaum, J. M.; Corvol, J. Longitudinal changes in neuromelanin MRI signal in Parkinson's disease: A progression marker. Movement Disorders 2021, 36, 1592-1602.
Figures