4758
Quantitative Susceptibility Mapping and Polygenic Risk Scores in subjects with unusual and psychotic experiences obtained from the UK Biobank1Department of Electrical Engineering, Pontificia Universidad Catolica de Chile, Santiago, Chile, 2Biomedical Imaging Center, Pontificia Universidad Catolica de Chile, Santiago, Chile, 3Millennium Institute for Intelligent Healthcare Engineering, Santiago, Chile, 4School of Electrical Engineering, Pontificia Universidad Catolica de Valparaiso, Valparaiso, Chile, 5Center for Genomics and Bioinformatics, School of Sciences, Universidad Mayor, Santiago, Chile, 6Center for Genetics and Genomics, School of Medicine, Clinica Alemana Universidad del Desarrollo, Santiago, Chile, 7Department of Psychiatry, School of Medicine, Pontificia Universidad Catolica de Chile, Santiago, Chile
Synopsis
Keywords: Psychiatric Disorders, Brain, dopamine, neuromelanin, genetics
We evaluated a cohort of subject with unusual and psychotic experiences and control subjects obtained from the UK Biobank, and we studied the relationship between susceptibility (QSM) in deep brain nuclei and polygenic risk scores (PRS) of genetic variants associated to psychosis. Although we found significant differences between patients and controls for QSM and PRS, we did not find any relationship between these two variables.Introduction
Psychosis has been linked to dopamine dysfunction1–3. Iron metabolism plays an important role in this neurotransmitter4, and QSM studies have reported iron changes in deep brain nuclei associated with dopamine pathways5. Genetic variants have also been linked as a risk factor in psychosis patients6. Genome-wide association studies (GWAS) can compare the distribution of ~2 million common variants in large case-control cohorts using genotyping microarrays. The cumulative risk to a particular disease given by thousands of small-effects GWAS variants carried in a single individual is known as polygenic risk scores (PRS). We aim to evaluate the relationship between psychosis PRS and magnetic susceptibility changes in deep brain nuclei. For this, we studied a cohort of controls and subjects with unusual psychotic experiences obtained from the UK Biobank.Methods
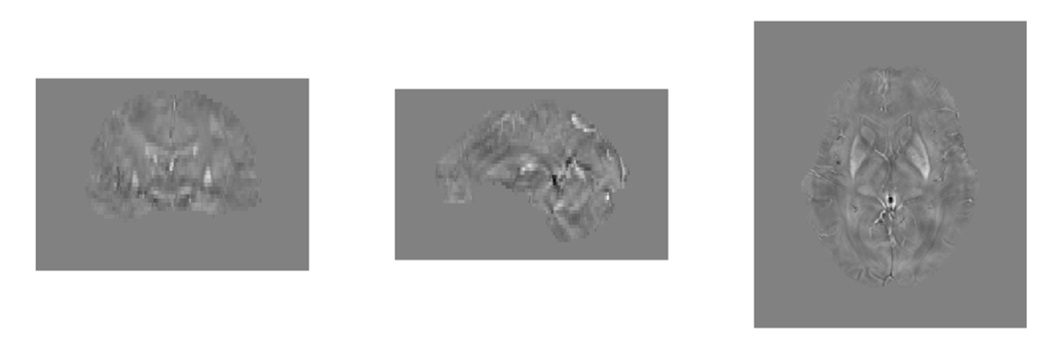
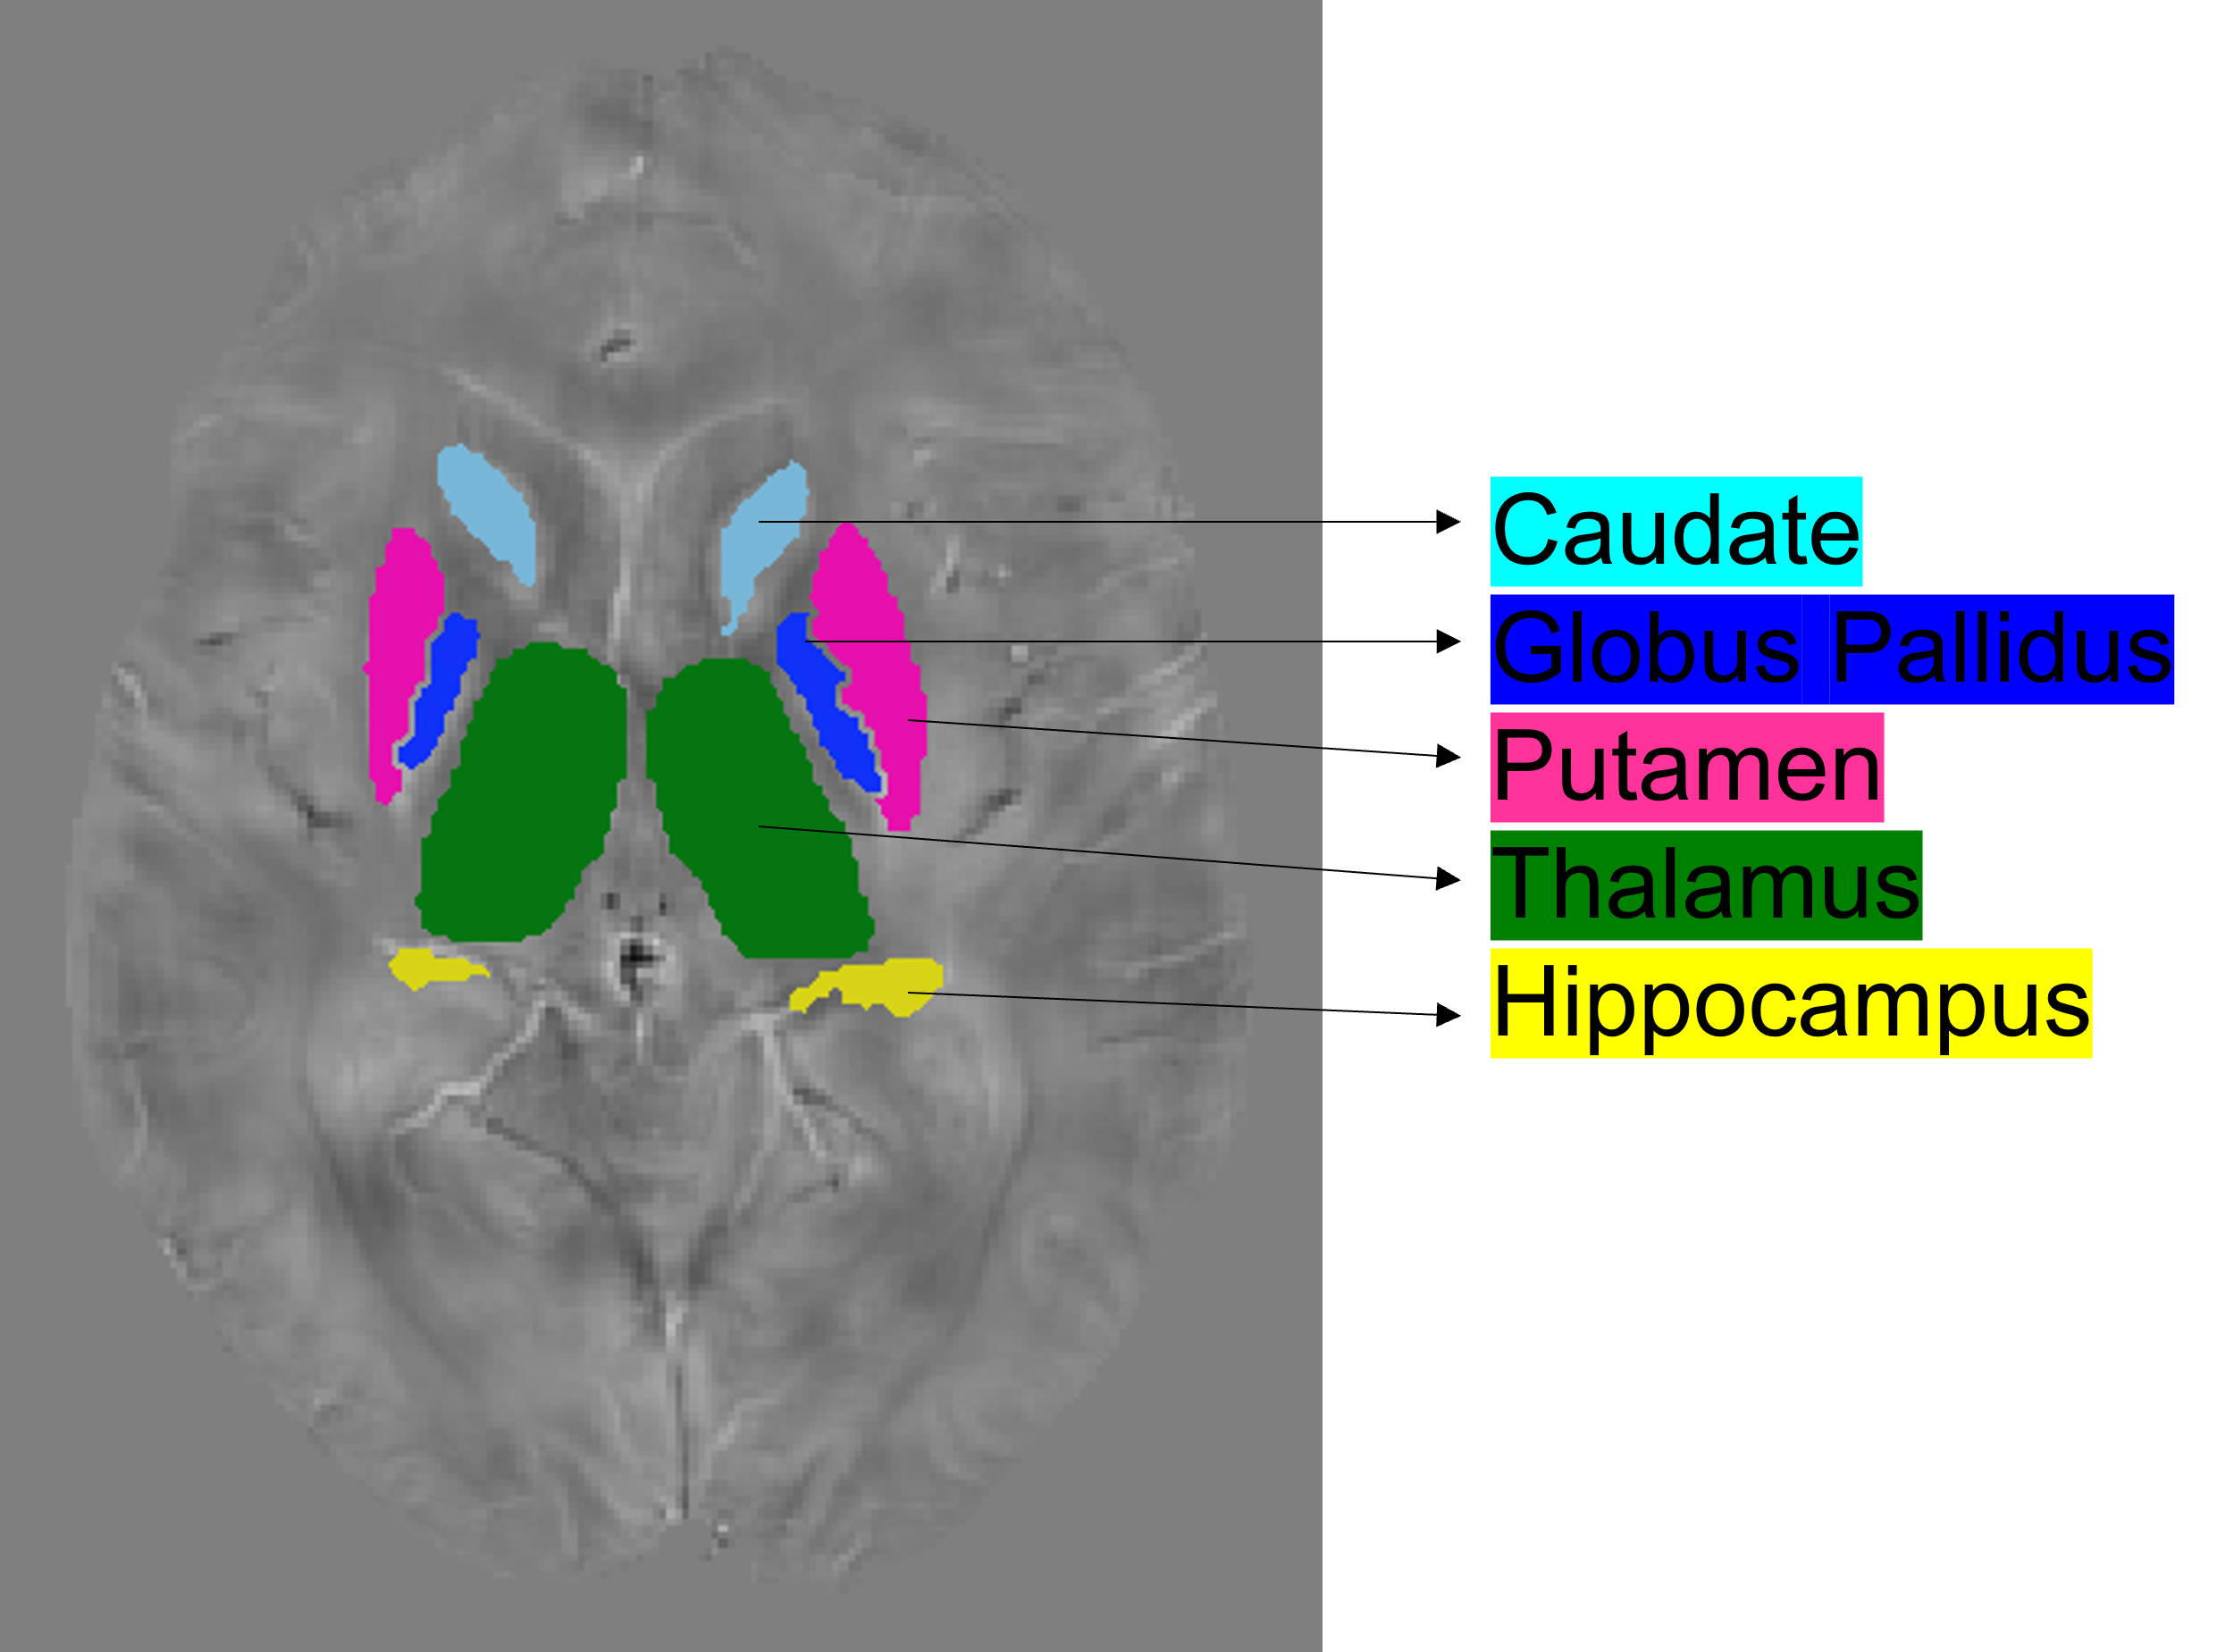
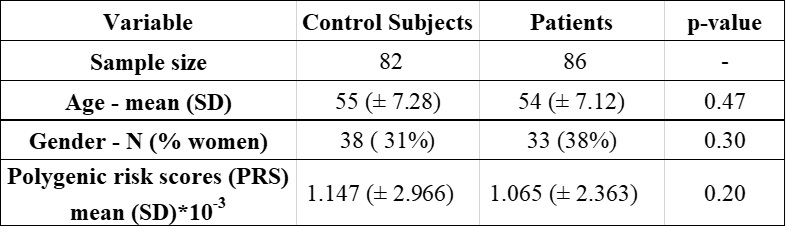
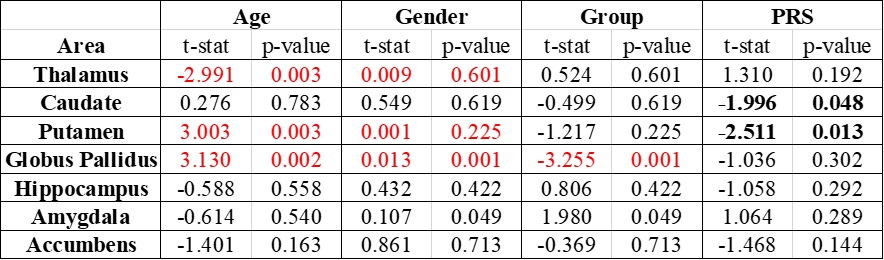
From the UK Biobank, we studied 114 individuals with unusual and psychotic experiences and 114 control subjects. For controls, we considered subjects with stomach/abdominal pain and without psychiatric disorders. We removed individuals that showed notorious artifacts in their MRI images as well as those subjects with genotyping rates below 90%. The resulting sample was composed of 86 patients (mean age 54 ± 7.12 years) and 82 control subjects (mean age 55 ± 7.28 years) as shown in table 1. We processed swMRI images (voxel size = 0.8x0.8x3mm3, FOV = 256x288x48, two echos, TE = 9.42/20 ms, considering each RF coil and echo time separately) and T1 3D MPRAGE (voxel size = 1x1x1mm3, FOV = 208x256x256, inversion time (TI)/TR = 880/2,000 ms). We computed QSM maps as in 6: (I) Channel combination using MCPC-3D-S7. (II) Laplacian phase unwrapping8 and echo combination by weighted sum. (III) Background field removal using vSHARP (maximum kernel size 12)9. (V) Dipole inversion using iLSQR10 (Figure 1). We used FIRST (implemented in FSL, Figure 2) to segment 7 ROIs (thalamus, caudate, putamen, globus pallidus, hippocampus, amygdala, and accumbens) from the T1 images11–13, which were previously transformed to the QSM space using SPM12. To calculate PRS, we downloaded GWAS summary statistics from the latest and biggest GWAS study in schizophrenia (76,755 cases and controls 243,649)14. The optimal p-value risk threshold of variants for PRS calculation was p-value = 0.001. A total of 173,902 risk variants were included. The PRS measurements were normalized against the whole UK Biobank available individuals (n=488,377). We analyzed each nucleus with a mixed model test (equation 1) to compare susceptibility values from patients and control subjects. Age, gender, PRS, and a binary value (0 patient or 1 control) were considered fixed variables, whereas susceptibility was treated as a dependent variable. We corrected p-values for multiple comparisons using false-discovery rate (FDR).magnetic susceptibility ~ age + gender + group + PRS [1]
Results
We found significant differences in susceptibility in the globus pallidus (T = -3.255 and P = 0.001) between patients and control subjects (table 2). The thalamus, putamen, and globus pallidus also showed correlations between age and magnetic susceptibility. Gender was correlated with susceptibility values only for the globus pallidus. When analyzing PRS, we found that the putamen and caudate might be considered predictors of magnetic susceptibility (nominal p-value < 0.05), however, this correlation was no longer significant after FDR correction.Discussion
Our QSM findings might be explained by the fact that iron has been connected to transport activities close to axon terminals as well as myelin production processes, which have been found to be affected by the globus pallidus externa in animal model studies of schizophrenia15. The correlation between age and susceptibility is consistent with previous studies. We could not confirm a correlation between PRS and susceptibility in the caudate and putamen.Conclusion
Subjects with unusual and psychotic experiences showed susceptibility differences in the globus pallidus when compared to control subjects, whereas the Polygenic Risk Scores of genetic variants associated with schizophrenia did not show a correlation with susceptibility values. This finding indicates that, in subjects with unusual and psychotic experiences, changes in susceptibility might not be associated with genetic factors.Acknowledgements
We thank ANID for their grant funding: Fondecyt 1191710, 1200601, 1180358, and 1231535; PIA-ACT192064 and PIA-ACT1414; and the Millennium Institute for Intelligent Healthcare Engineering (ICN2021004).References
1. Zucca FA, Segura-Aguilar J, Ferrari E, et al. Interactions of iron, dopamine and neuromelanin pathways in brain aging and Parkinson’s disease. Prog Neurobiol. 2017;155:96-119. doi:10.1016/j.pneurobio.2015.09.012
2. Howes OD, Kapur S. The dopamine hypothesis of schizophrenia: Version III - The final common pathway. Schizophr Bull. 2009;35(3):549-562. doi:10.1093/schbul/sbp006
3. Zecca L, Bellei C, Costi P, et al. New melanic pigments in the human brain that accumulate in aging and block environmental toxic metals. Proc Natl Acad Sci U S A. 2008;105(45):17567-17572. doi:10.1073/pnas.0808768105
4. Shibata E, Sasaki M, Tohyama K, et al. Use of Neuromelanin-Sensitive MRI to Distinguish Schizophrenic and Depressive Patients and Healthy Individuals Based on Signal Alterations in the Substantia Nigra and Locus Ceruleus. Biol Psychiatry. 2008;64(5):401-406. doi:10.1016/j.biopsych.2008.03.021
5. Xu M, Guo Y, Cheng J, et al. Brain iron assessment in patients with First-episode schizophrenia using quantitative susceptibility mapping. Neuroimage (Amst). 2021;31. doi:10.1016/J.NICL.2021.102736
6. Wang C, Martins-Bach AB, Alfaro-Almagro F, et al. Phenotypic and genetic associations of quantitative magnetic susceptibility in UK Biobank brain imaging. Nat Neurosci 2022.1-14. doi:10.1038/s41593-022-01074-w
7. Eckstein K, Dymerska B, Bachrata B, et al. Computationally Efficient Combination of Multi-channel Phase Data From Multi-echo Acquisitions (ASPIRE). Magn Reson Med. 2018;79(6):2996-3006. doi:10.1002/MRM.26963
8. Li W, Avram A V., Wu B, Xiao X, Liu C. Integrated Laplacian-based phase unwrapping and background phase removal for quantitative susceptibility mapping. NMR Biomed. 2014;27(2):219-227. doi:10.1002/nbm.3056
9. Bilgic B, Fan AP, Polimeni JR, et al. Fast quantitative susceptibility mapping with L1-regularization and automatic parameter selection. Magn Reson Med. 2014;72(5):1444-1459. doi:10.1002/mrm.25029
10. Li W, Wang N, Yu F, et al. A method for estimating and removing streaking artifacts in quantitative susceptibility mapping. Neuroimage. 2015;108:111-122. doi:10.1016/J.NEUROIMAGE.2014.12.043
11. Jenkinson M, Beckmann CF, Behrens TEJ, Woolrich MW, Smith SM. FSL. Neuroimage. 2012;62(2):782-790. doi:10.1016/J.NEUROIMAGE.2011.09.015
12. Woolrich MW, Jbabdi S, Patenaude B, et al. Bayesian analysis of neuroimaging data in FSL. Neuroimage. 2009;45(1 Suppl). doi:10.1016/J.NEUROIMAGE.2008.10.055
13. Smith SM, Jenkinson M, Woolrich MW, et al. Advances in functional and structural MR image analysis and implementation as FSL. Neuroimage. 2004;23 Suppl 1(SUPPL. 1). doi:10.1016/J.NEUROIMAGE.2004.07.051
14. Trubetskoy V, Pardiñas AF, Qi T, et al. Mapping genomic loci implicates genes and synaptic biology in schizophrenia. Nature. 2022;604(7906):502-508. doi:10.1038/S41586-022-04434-5
15. Cazorla M, deCarvalho FD, Chohan MO, et al. Dopamine D2 receptors regulate the anatomical balance of basal ganglia circuitry. Neuron. 2014;81(1):153. doi:10.1016/J.NEURON.2013.10.041
Figures