4756
Neuroimaging biomarkers for detecting schizophrenia: a resting-state functional MRI-based radiomics analysis1Department of Radiology, Xiang’an Hospital of Xiamen Uneversity,School of Medicine, Xiamen University, Xiamen, China
Synopsis
Keywords: Psychiatric Disorders, fMRI (resting state)
Quantifiable biomarkers are urgently required to explore the potential physiological mechanism of schizophrenia and improve its diagnostic accuracy. Resting-state functional MRI (rs-fMRI)-based radiomics analysis obtained great classification performance, and it could be generalized to different brain atlases. The regions that we identified as discriminative features mainly included bilateral dorsal caudate and front-parietal, somato-motor, limbic, and default mode networks. Our findings showed that radiomics-based machine learning method could facilitate us to understand the potential pathological mechanism of schizophrenia more comprehensively and contribute to the accurate diagnosis of patients with schizophrenia.Introduction
Schizophrenia (SZ) is one of the most prevalent mental disorders1; however, its accurate diagnosis is difficult in clinical practice2,3. Currently, the underlying mechanism of SZ remains poorly understood3-5. Hence, quantifiable biomarkers are urgently required to more fully understand the underlying neural mechanisms of SZ and to improve the accuracy of diagnosis.Resting-state functional MRI (rs-fMRI) is one of the most commonly used non-invasive techniques in neuroimaging6-8. The functional connectivity (FC)7,9, as one of the most commonly used rs-fMRI measurements, has been widely used in neuropsychiatric disorders.
Conventional FC evaluates connectivity patterns between predefined brain regions or distinct brain network components via the independent component analysis method. Voxel-mirrored homotopic connectivity (VMHC) 10-12 and Degree centrality (DC)12-14 are new rs-fMRI indicators used to evaluate FCs across the whole brain at a voxel level, do not rely on prior information of the target brain regions. Therefore, DC and VMHC may be more appropriate than conventional FC in studying neuropsychiatric disorders which their pathological mechanisms were unclear12.
Radiomics is a new approach for mining the information contained in medical images, it recently have been used to explore the biomarkers of neuropsychiatric disorders8,15,16.
This study aimed to identify biomarkers that classify patients with SZ and healthy controls (HCs) and investigate the potential neural mechanisms of SZ with DC- and VMHC-based radiomics.
Methods
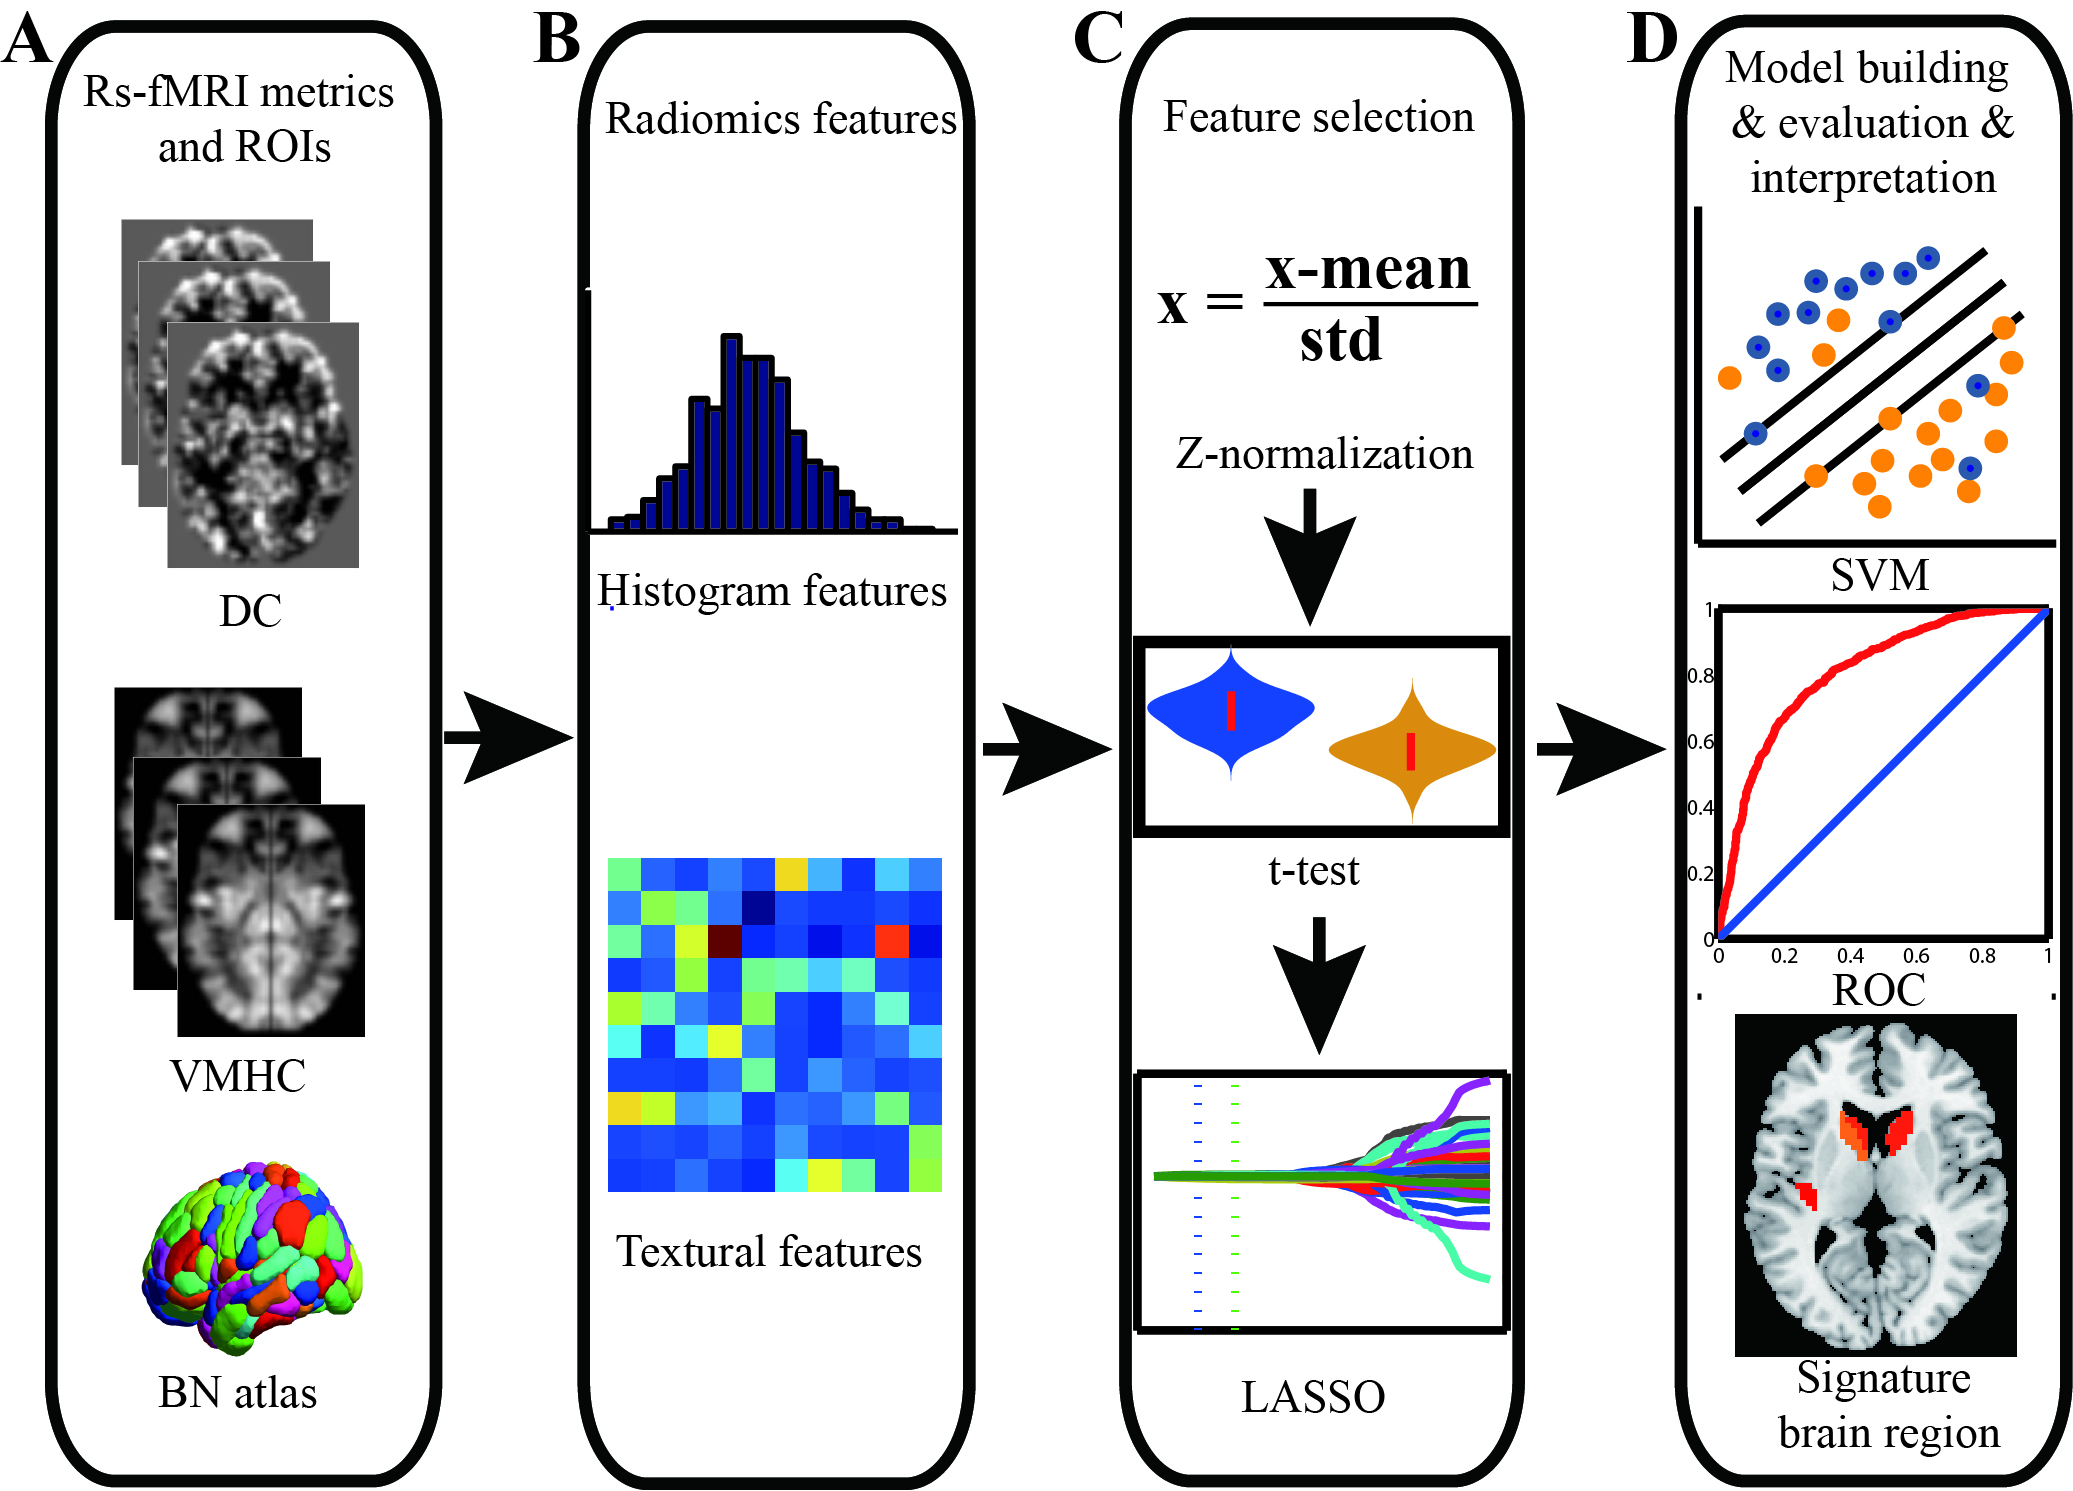
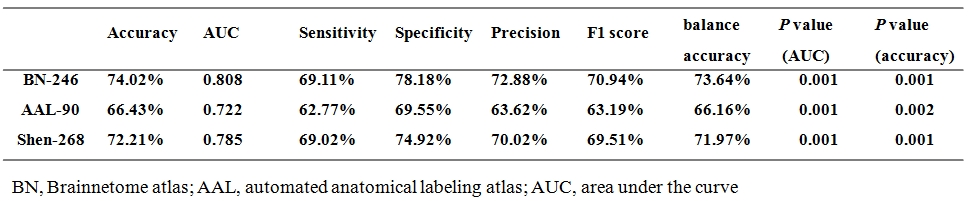
Seventy-two patients with SZ and 74 age- and sex-matched HCs were collected in this study, and all subjects completed 3D-T1WI structural and rs-fMRI scans. All subjects' MRI data were routinely processed to obtain DC and VMHC maps, and the Brainnetome 246 atlas was used to extract the radiomics features from the DC and VMHC maps. The t-tests and least absolute shrinkage and selection operator (LASSO) were used for feature dimensionality reduction, nested 10-fold cross-validation17 (repeated 20 times) was used for parameter optimization and model evaluation, and the support vector machine was used to build the classification model, in which the inner loop adopted a grid search method18,19 (λ=0.01 to 0.4 with 0.01 interval) to determine the optimal hyper-parameter (the optimal λ of LASSO), and the outer loop used to evaluate the performance of the model. The 10 features with the most frequently selected for DC and VMHC in 200 iterations were selected to be defined as discriminative features7,20. The above procedures were repeated using automated anatomical labeling (AAL) 90 and Shen 268 (the cerebellum and brainstem were excluded) atlases to validate the robustness and generalization of the model.Results
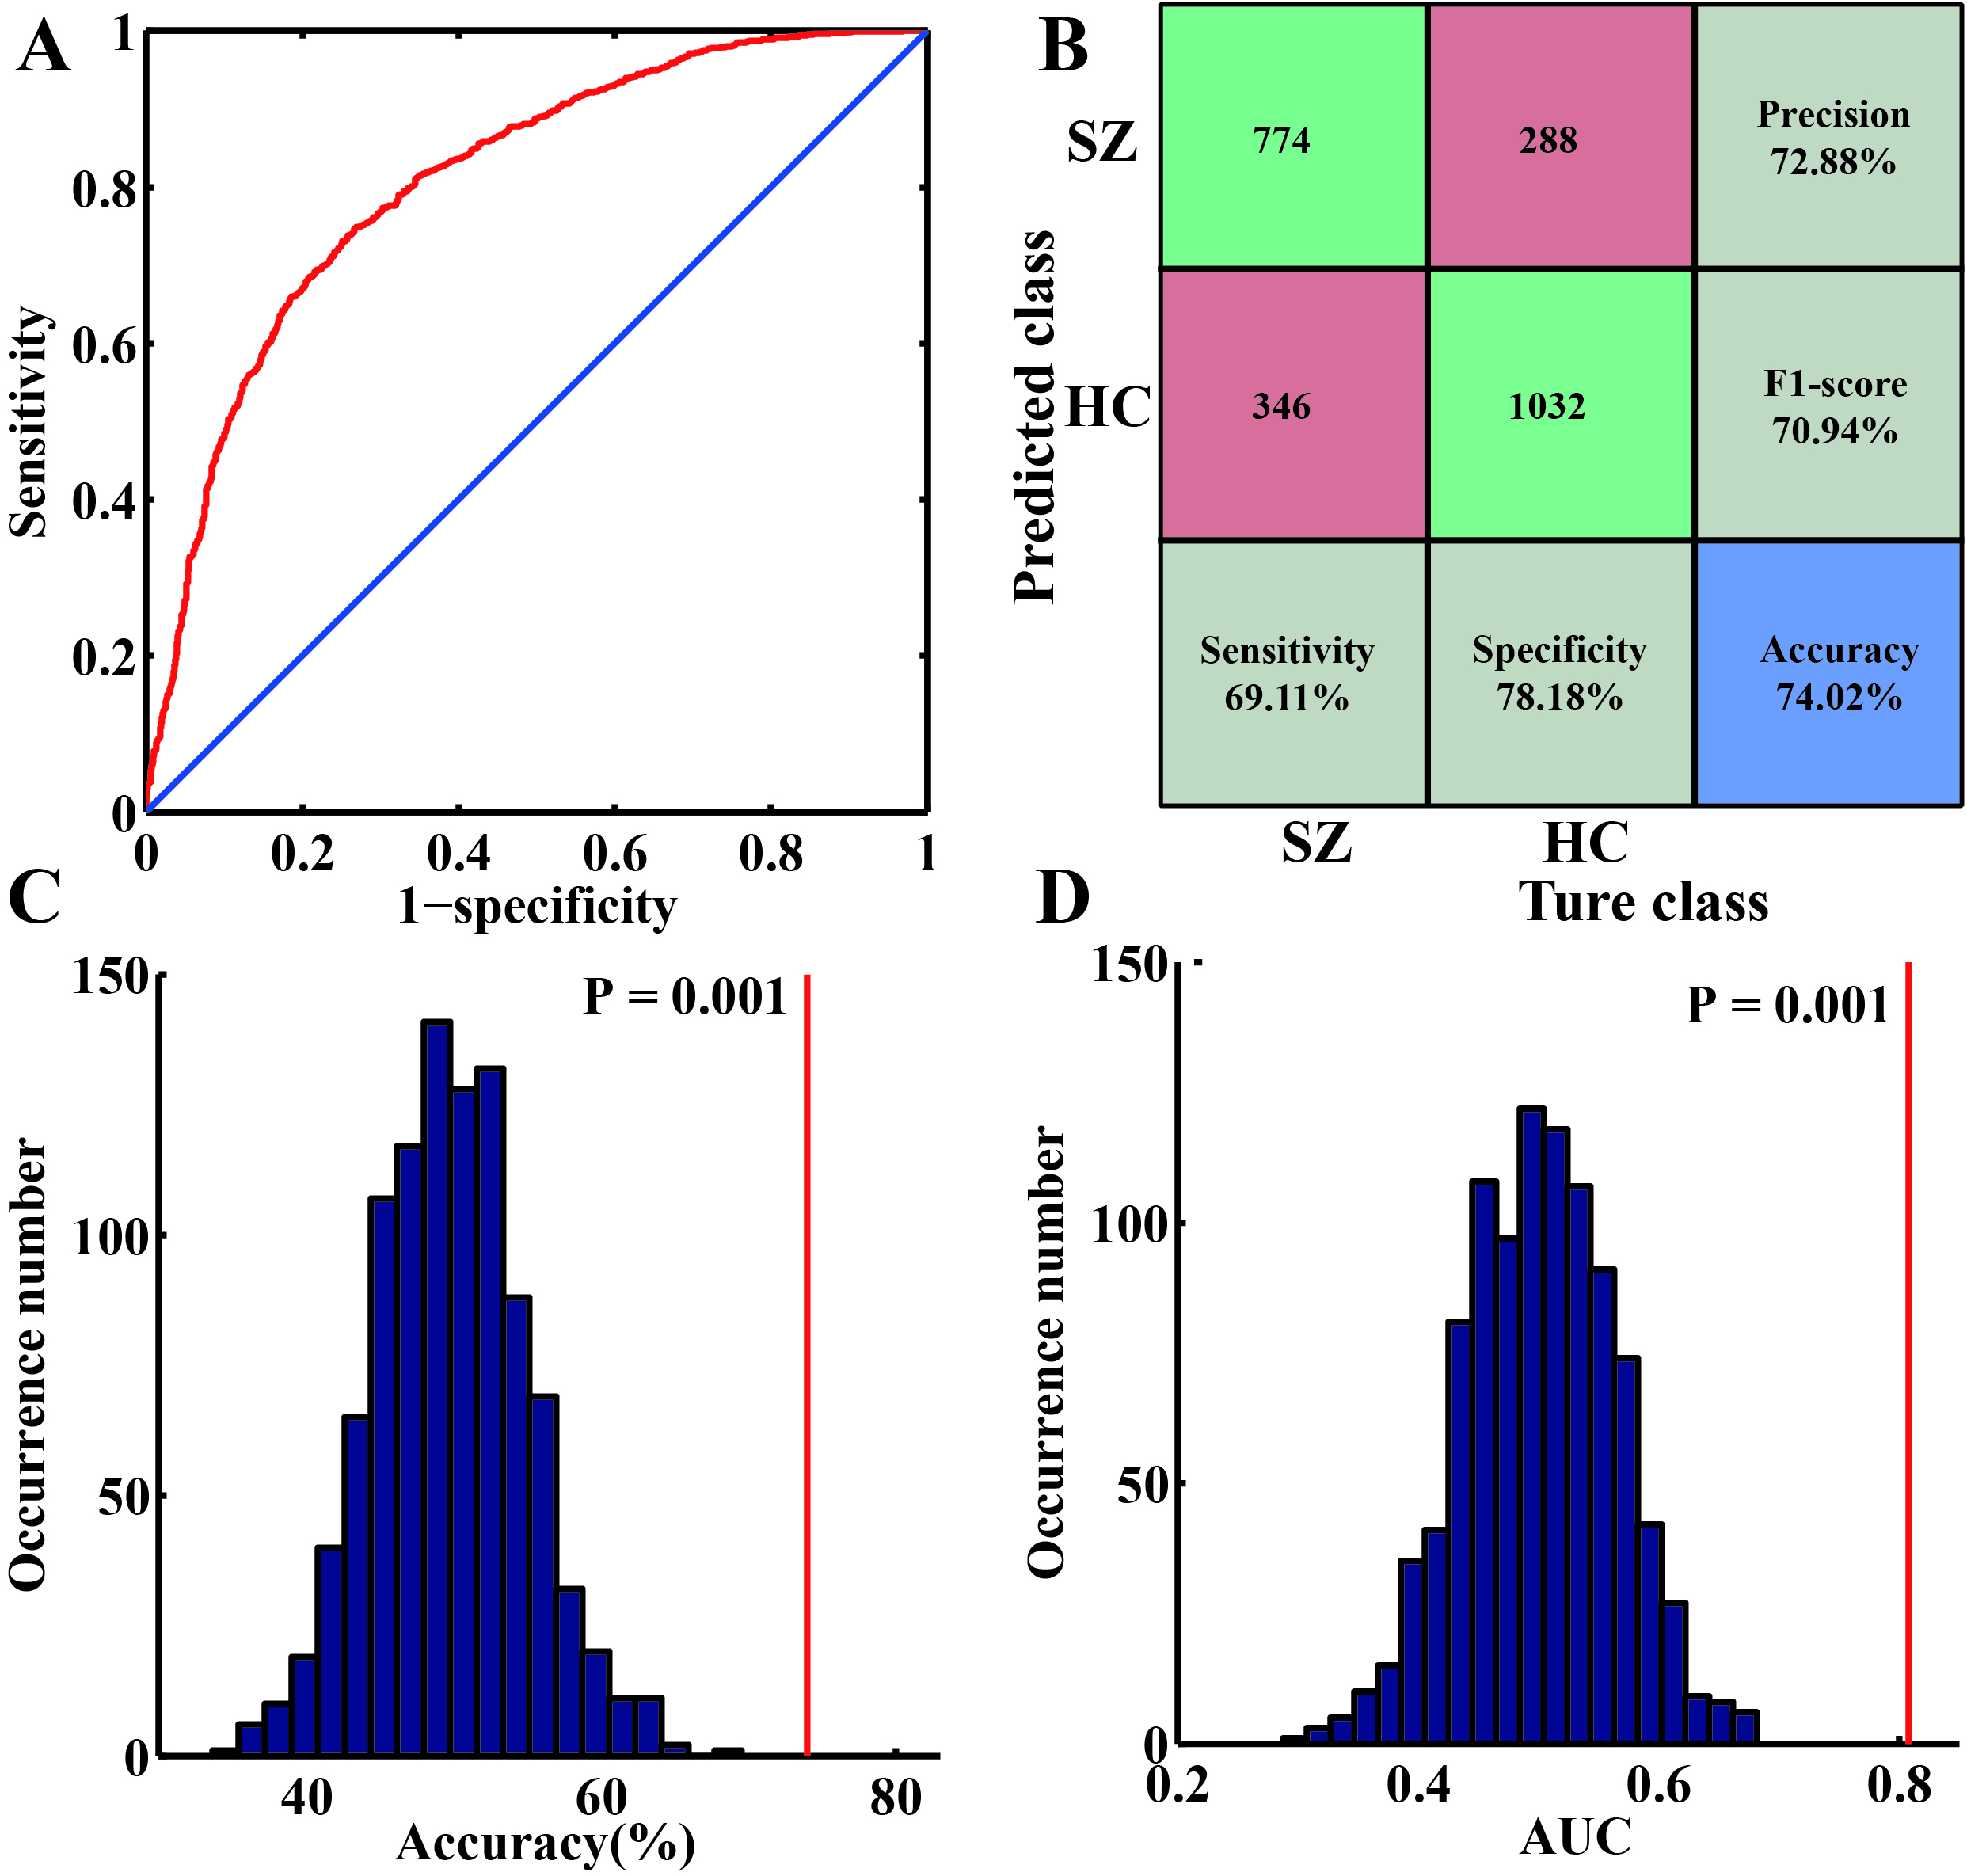
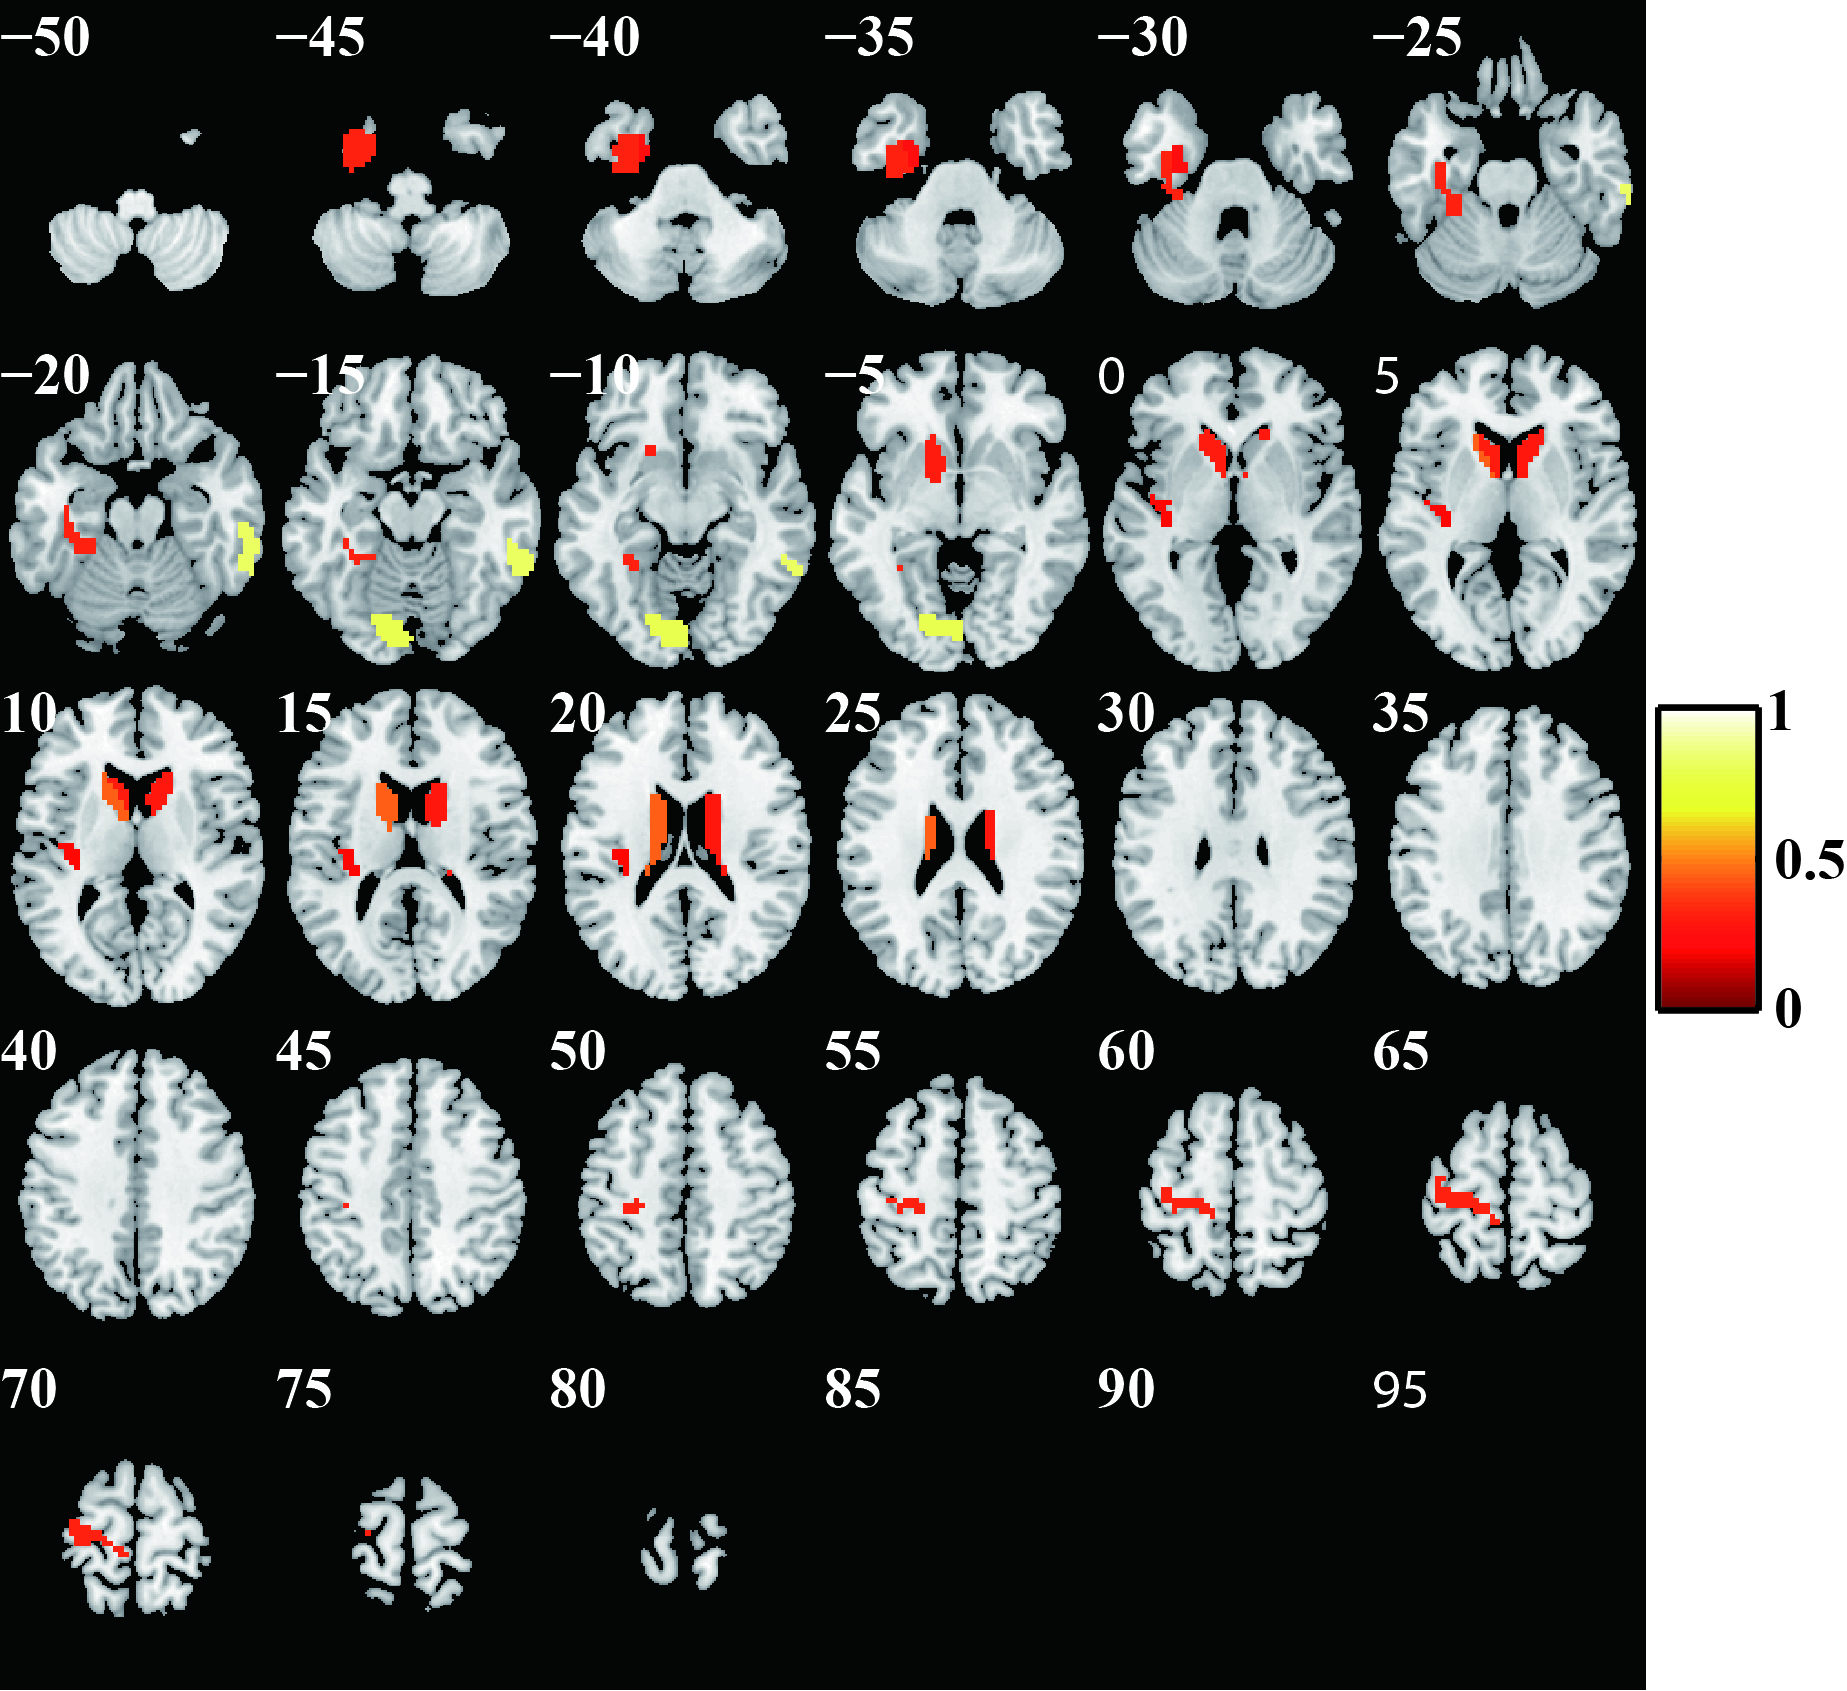
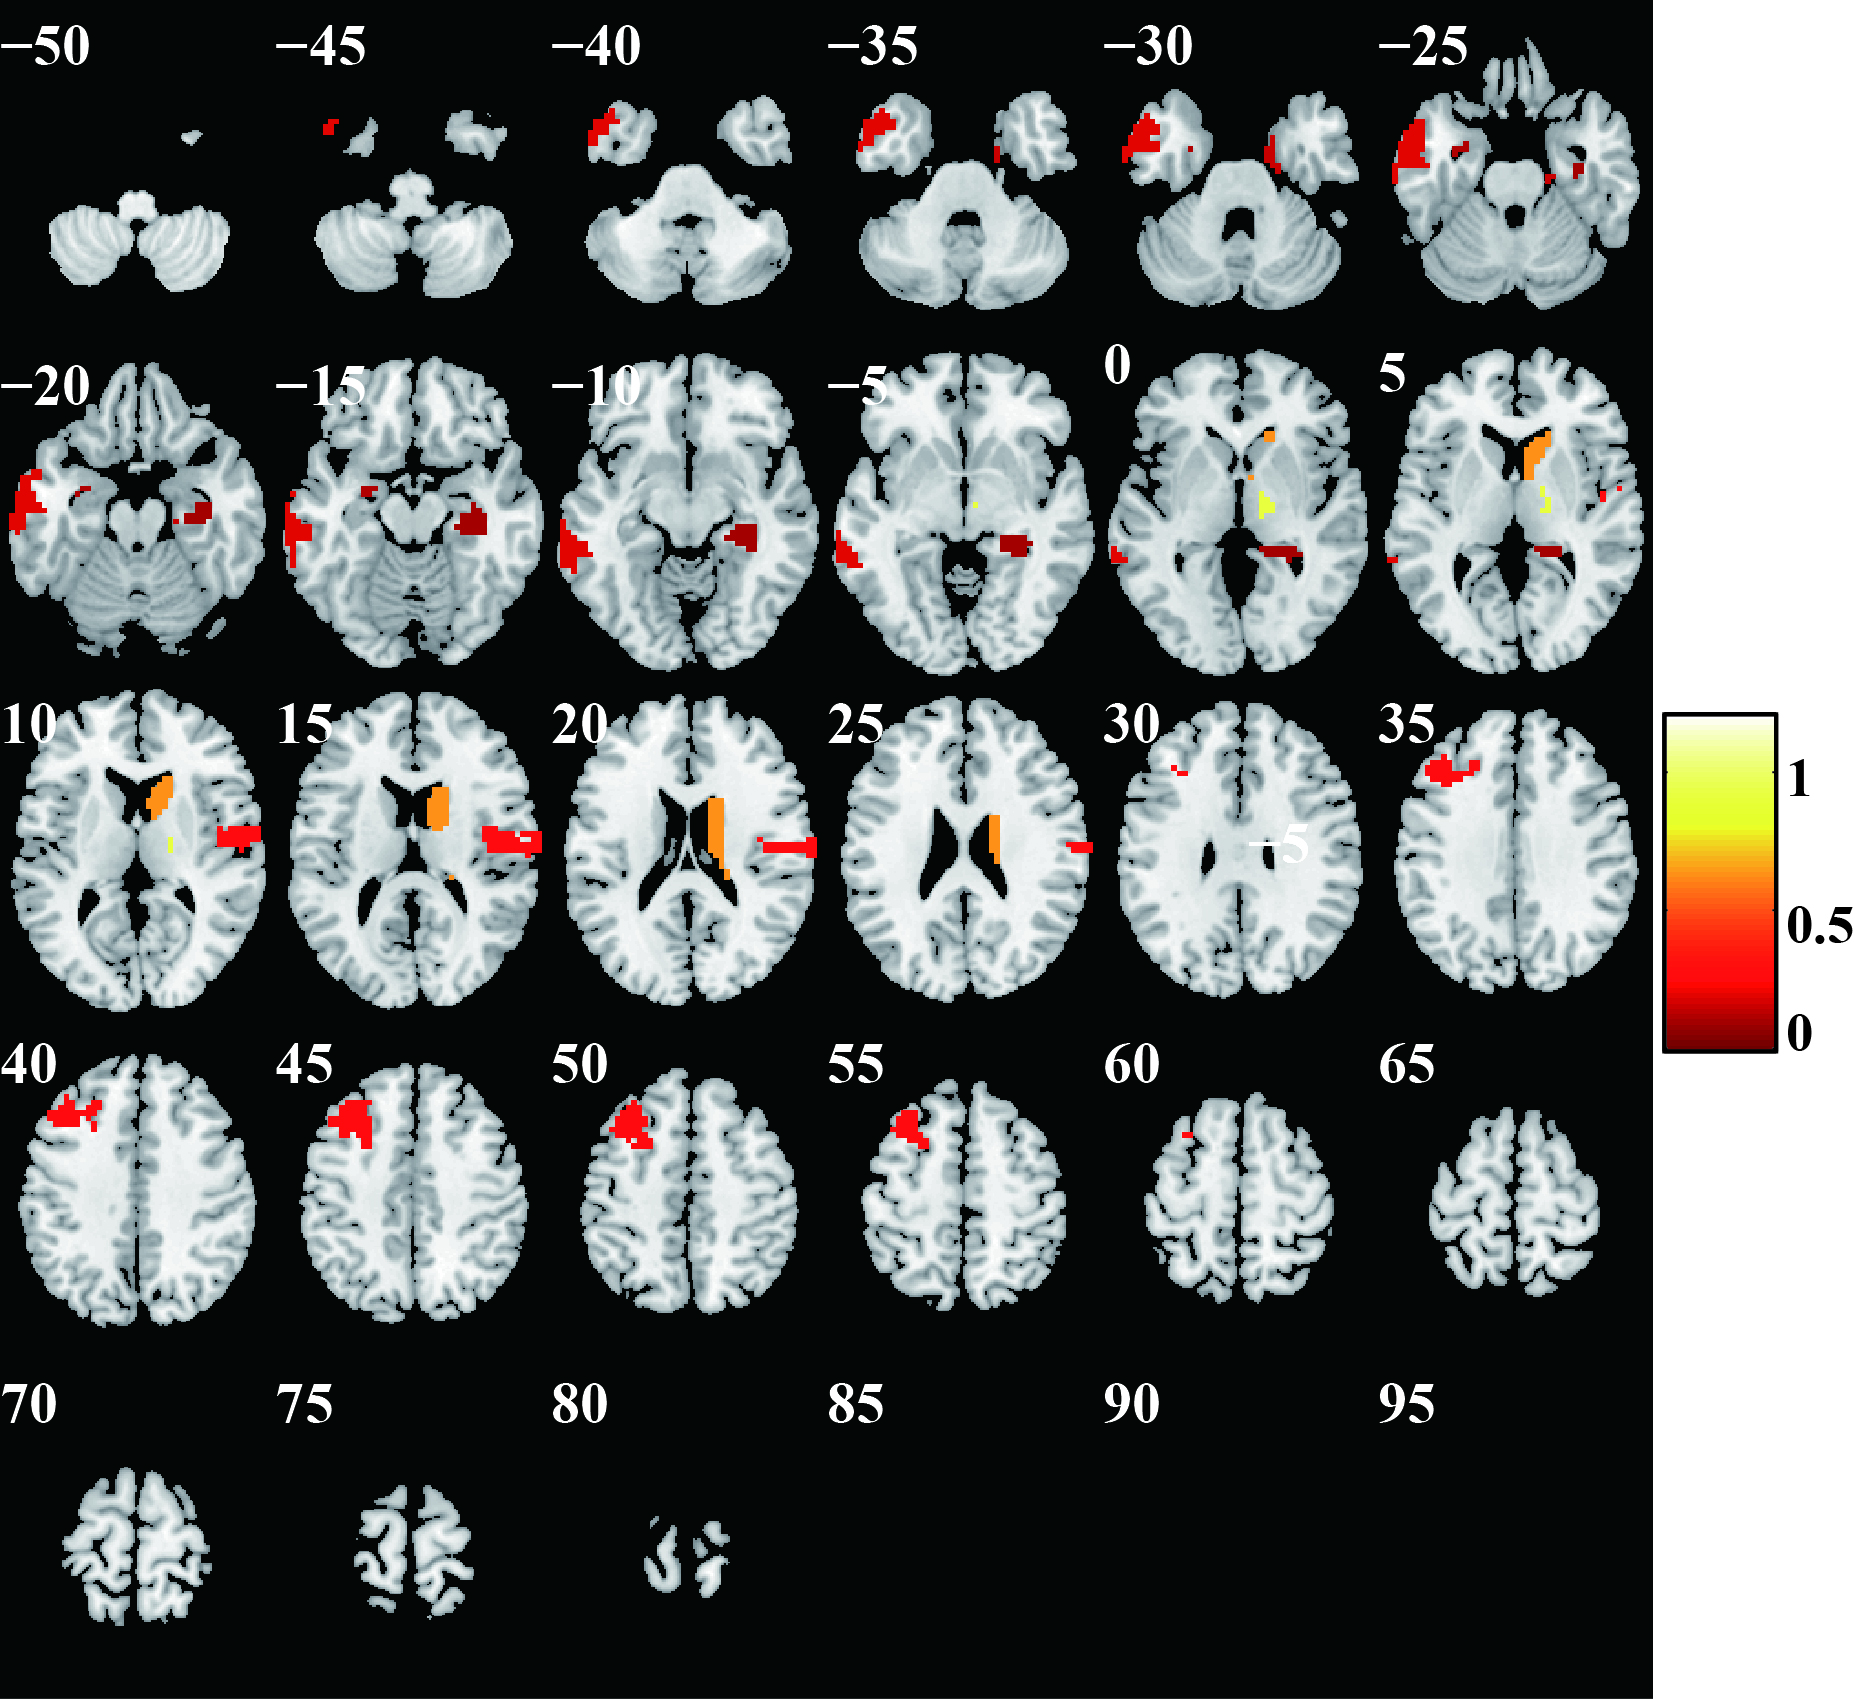
Excluding the subjects with incomplete imaging data and substantial head motion, 122 subjects were finally included in this study (66 HCs and 56 patients with SZ). The mean AUC and accuracy using the Brainnetome 246 atlas were 0.808 and 74.02%, respectively (both P<0.001). The brain regions identified as discriminative features were mainly located in the subcortical nuclei (bilateral dorsal caudate), front-parietal, somato-motor, limbic, and default mode networks. Repeating the above study using AAL 90 and Shen 268 atlases, the model still had great performance (AAL 90: mean accuracy 66.43%, mean AUC 0.722, P = 0.002 and 0.001, respectively; Shen268: mean accuracy 72.21%, mean AUC was 0.758, both P<0.001). The Brainnetome 246 atlas had the best performance, and AAL 90 atlas had the worst performance among them.Conclusion
The radiomics-based machine learning method we proposed based on DC and VMHC metrics could classify patients with SZ and HCs with great performance, it had good robustness and generalizability, and it is an effective method to identify SZ neuroimaging biomarkers. Brain dysfunction in subcortical nuclei, front-parietal, somato-motor, limbic, and default mode networks may be the underlying pathological mechanism of SZ.Keywords
Schizophrenia, Radiomics, Machine learning, Support vector machine, Functional connectivity, Degree centrality, Voxel-mirrored homotopic connectivityAcknowledgements
This work is supported by Scientific Research Foundation for Advanced Talents, Xiang'an Hospital of Xiamen University (NO. PM201809170011).References
1. Charlson FJ, Ferrari AJ, Santomauro DF, et al. Global Epidemiology and Burden of Schizophrenia: Findings From the Global Burden of Disease Study 2016. Schizophr Bull. Oct 17 2018;44(6):1195-1203. doi:10.1093/schbul/sby058
2. Shi D, Li Y, Zhang H, et al. Machine Learning of Schizophrenia Detection with Structural and Functional Neuroimaging. Dis Markers. 2021;2021:9963824. doi:10.1155/2021/9963824
3. Liu Z, Palaniyappan L, Wu X, et al. Resolving heterogeneity in schizophrenia through a novel systems approach to brain structure: individualized structural covariance network analysis. Mol Psychiatry. Dec 2021;26(12):7719-7731. doi:10.1038/s41380-021-01229-4
4. Wulff S, Nielsen MO, Rostrup E, et al. The relation between dopamine D2 receptor blockade and the brain reward system: a longitudinal study of first-episode schizophrenia patients. Psychol Med. Jan 2020;50(2):220-228. doi:10.1017/S0033291718004099
5. Jiang Y, Yao D, Zhou J, et al. Characteristics of disrupted topological organization in white matter functional connectome in schizophrenia. Psychol Med. Sep 3 2020:1-11. doi:10.1017/S0033291720003141
6. Qiu S, Joshi PS, Miller MI, et al. Development and validation of an interpretable deep learning framework for Alzheimer's disease classification. Brain. Jun 1 2020;143(6):1920-1933. doi:10.1093/brain/awaa137
7. Lin H, Cai X, Zhang D, Liu J, Na P, Li W. Functional connectivity markers of depression in advanced Parkinson's disease. Neuroimage Clin. 2020;25:102130. doi:10.1016/j.nicl.2019.102130
8. Zhao K, Ding Y, Han Y, et al. Independent and reproducible hippocampal radiomic biomarkers for multisite Alzheimer’s disease: diagnosis, longitudinal progress and biological basis. Science Bulletin. 2020;65(13):1103-1113. doi:10.1016/j.scib.2020.04.003
9. Shao J, Dai Z, Zhu R, et al. Early identification of bipolar from unipolar depression before manic episode: Evidence from dynamic rfMRI. Bipolar Disord. Dec 2019;21(8):774-784. doi:10.1111/bdi.12819 10. Zhang S, Gao GP, Shi WQ, et al. Abnormal interhemispheric functional connectivity in patients with strabismic amblyopia: a resting-state fMRI study using voxel-mirrored homotopic connectivity. BMC Ophthalmol. Jun 9 2021;21(1):255. doi:10.1186/s12886-021-02015-0
11. Liu Y, Guo W, Zhang Y, et al. Decreased Resting-State Interhemispheric Functional Connectivity Correlated with Neurocognitive Deficits in Drug-Naive First-Episode Adolescent-Onset Schizophrenia. Int J Neuropsychopharmacol. Jan 1 2018;21(1):33-41. doi:10.1093/ijnp/pyx095
12. Jiang W, Lei Y, Wei J, et al. Alterations of Interhemispheric Functional Connectivity and Degree Centrality in Cervical Dystonia: A Resting-State fMRI Study. Neural Plast. 2019;2019:7349894. doi:10.1155/2019/7349894
13. Zhou J, Li K, Luo X, et al. Distinct impaired patterns of intrinsic functional network centrality in patients with early- and late-onset Alzheimer's disease. Brain Imaging Behav. Oct 2021;15(5):2661-2670. doi:10.1007/s11682-021-00470-3
14. Sheng J, Zhang L, Feng J, et al. The coupling of BOLD signal variability and degree centrality underlies cognitive functions and psychiatric diseases. Neuroimage. Aug 15 2021;237:118187. doi:10.1016/j.neuroimage.2021.118187
15. Cui LB, Zhang YJ, Lu HL, et al. Thalamus Radiomics-Based Disease Identification and Prediction of Early Treatment Response for Schizophrenia. Front Neurosci. 2021;15:682777. doi:10.3389/fnins.2021.682777
16. Sun H, Chen Y, Huang Q, et al. Psychoradiologic Utility of MR Imaging for Diagnosis of Attention Deficit Hyperactivity Disorder: A Radiomics Analysis. Radiology. May 2018;287(2):620-630. doi:10.1148/radiol.2017170226
17. Wottschel V, Chard DT, Enzinger C, et al. SVM recursive feature elimination analyses of structural brain MRI predicts near-term relapses in patients with clinically isolated syndromes suggestive of multiple sclerosis. Neuroimage Clin. 2019;24:102011. doi:10.1016/j.nicl.2019.102011
18. Chen X, Zhang H, Zhang L, Shen C, Lee SW, Shen D. Extraction of dynamic functional connectivity from brain grey matter and white matter for MCI classification. Hum Brain Mapp. Oct 2017;38(10):5019-5034. doi:10.1002/hbm.23711
19. Chen X, Zhang H, Gao Y, et al. High-order resting-state functional connectivity network for MCI classification. Hum Brain Mapp. Sep 2016;37(9):3282-96. doi:10.1002/hbm.23240
20. Zhou B, An D, Xiao F, et al. Machine learning for detecting mesial temporal lobe epilepsy by structural and functional neuroimaging. Front Med. Oct 2020;14(5):630-641. doi:10.1007/s11684-019-0718-4
Figures