4753
Surface-based morphometric abnormalities in patients with early psychosis: an MP2RAGE-based study at 7T1Animal imaging and technology core (AIT), Center for Biomedical Imaging (CIBM), Ecole Polytechnique Fédérale de Lausanne (EPFL), Lausanne, Switzerland, 2Department of Psychiatry, Center for Psychiatric Neuroscience, Centre Hospitalier Universitaire Vaudois (CHUV) and University of Lausanne (UNIL), Lausanne, Switzerland, 3Service of General Psychiatry, Department of Psychiatry, Centre Hospitalier Universitaire Vaudois (CHUV) and University of Lausanne (UNIL), Lausanne, Switzerland, 4Center for Biomedical Imaging (CIBM), Lausanne, Switzerland, 5Radiology Department, Centre Hospitalier Universitaire Vaudois (CHUV) and University of Lausanne (UNIL), Lausanne, Switzerland, 6Diagnostic Neuroradiology, Centre Hospitalier Universitaire Vaudois (CHUV) and University of Lausanne (UNIL), Lausanne, Switzerland
Synopsis
Keywords: Psychiatric Disorders, Psychiatric Disorders, Early psychosis, First-episode schizophrenia
This study aims to investigate brain cortex alterations in early psychosis patients (n = 42) compared to healthy control subjects (n=35). Surface-based morphometric analysis using MP2RAGE images at 7T revealed significant clusters (corrected p<0.05) where the cortical area and cortex volume in early psychosis patients are reduced compared to healthy controls at the junction of lateral occipital, lingual and peri calcarine region at left hemisphere after permutation multiple comparison correction. Bilateral cortical areas, thickness, and volumes of the patients were reported to be changed at the surface vertex level.Introduction
Schizophrenia is a neurodevelopmental disorder affecting cerebral morphometry. Neuroimaging studies have revealed reductions in grey matter volumes in patients with schizophrenia, which are associated with psychotic symptoms and cognitive impairments 1-3. Most morphometrical studies of schizophrenia were performed based on MPRAGE images at 1.5T or 3T. It has been demonstrated that the MP2RAGE sequence leads to more excellent reproducibility and higher tissue contrast relative to MPRAGE 4,5. Our previous 7T study 6 using VBM analysis suggests the decreased GM concentration in subcortical regions (e.g. bilateral globus pallidus, right thalamus) in early psychosis (EP) patients. Due to subtle brain abnormalities in EP, it is essential to use more sensitive neuroimaging techniques to study cortical features. High sensitivity of 7T and MP2RAGE images, together with Surface-based morphometry (SBM), may facilitate the observation of subtle cortical changes at the early stage of the disease. This study aims to investigate cortical features in patients with EP compared to healthy controls via, for the first time, SBM analysis using MP2RAGE images at 7T.Methods
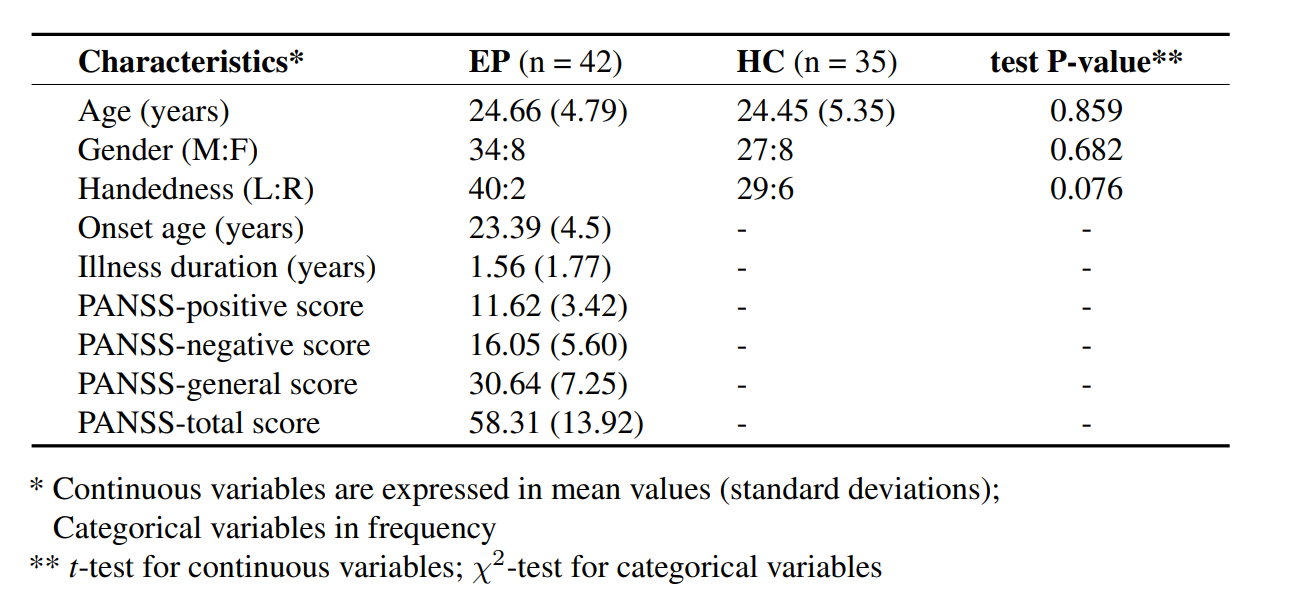
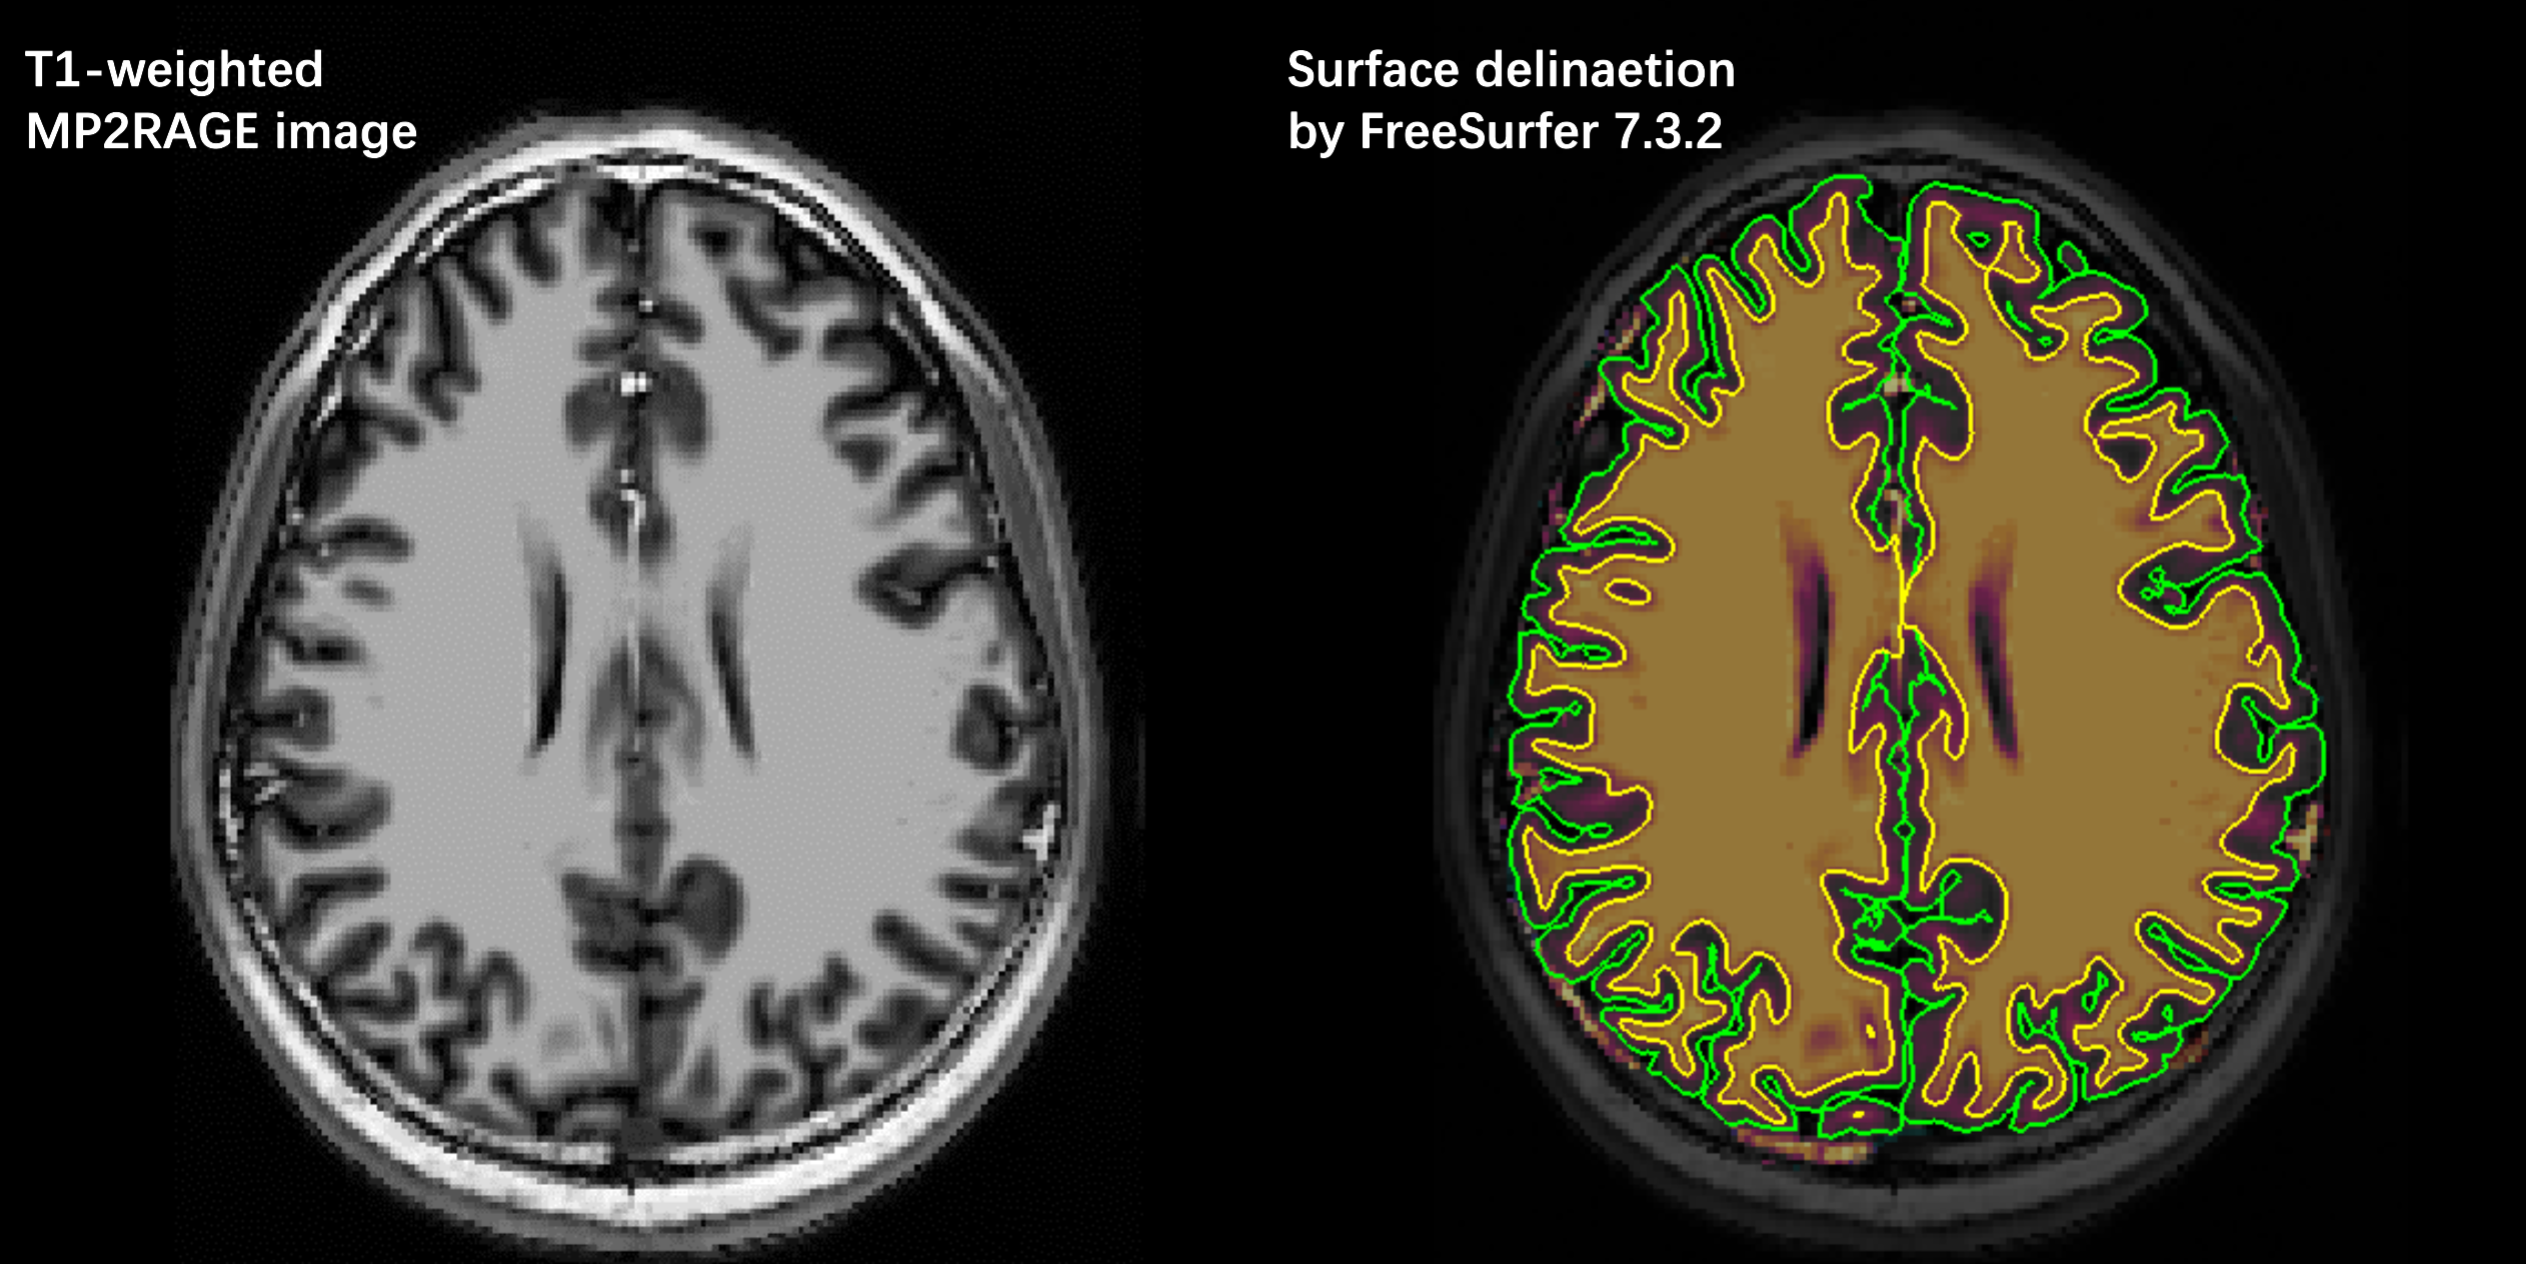
42 patients (34 males, 8 females), aged 18 to 33 and with less than 3 years of treatment, and 35 healthy controls (27 males and 8 females) 7 are included in the present study (Figure 1). They underwent magnetic resonance imaging scans in a 7 Tesla/68 cm MR scanner (Siemens Medical Solutions, Erlangen, Germany) with a 32-channel receive coil (NOVA Medical Inc., MA) with a single-channel volume transmit coil. 3D T1-weighted MR images were acquired using MP2RAGE (TE/TR = 1.87/5500 ms, TI1/TI2 = 750/2350 ms, α1/α2 = 4°/5°, slice thickness = 1 mm, FOV = 240 × 256 × 160 mm3, matrix size = 240 × 256 × 160, bandwidth = 240 Hz/Px)) 8.Surface-based morphometry (SBM) was applied to investigate anatomical features (i.e. cortical surface area, thickness, and volume) using FreeSurfer (version 7.3.2). Suggested by FreeSurfer’s guideline, bias correction through SPM12’s (Statistical Parametric Mapping) unified segmentation algorithm 9 was completed prior to the FreeSurfer process to partially compensate for the intensity inhomogeneity in an ultra-high field. General Linear Model (GLM) was used with nuisance covariates age, gender, and total intracranial volume (TIV) for the group analysis. Permutation with 1000 times was performed as cluster-wise multiple comparison correction. Corrected two-tailed P-value under 0.05 is regarded as significant. The cortical parcellation was based on Desikan-Killiany Atlas 10.
Results
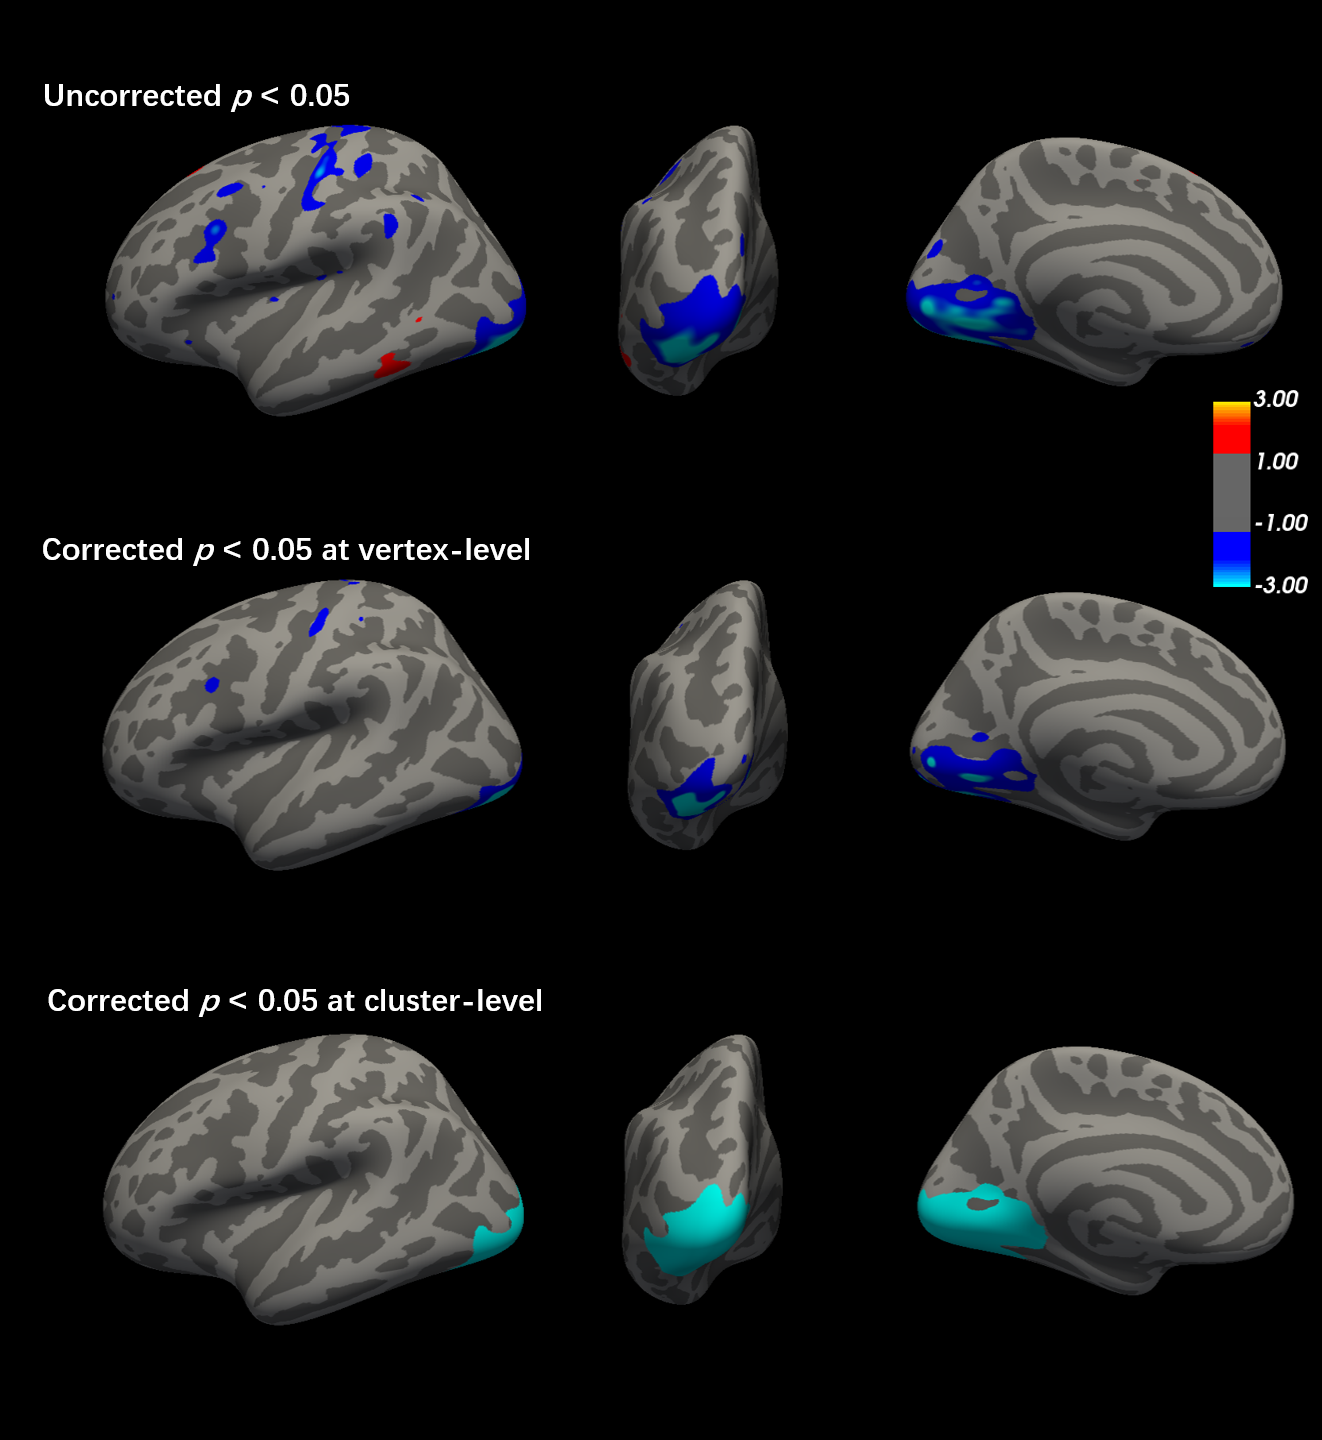
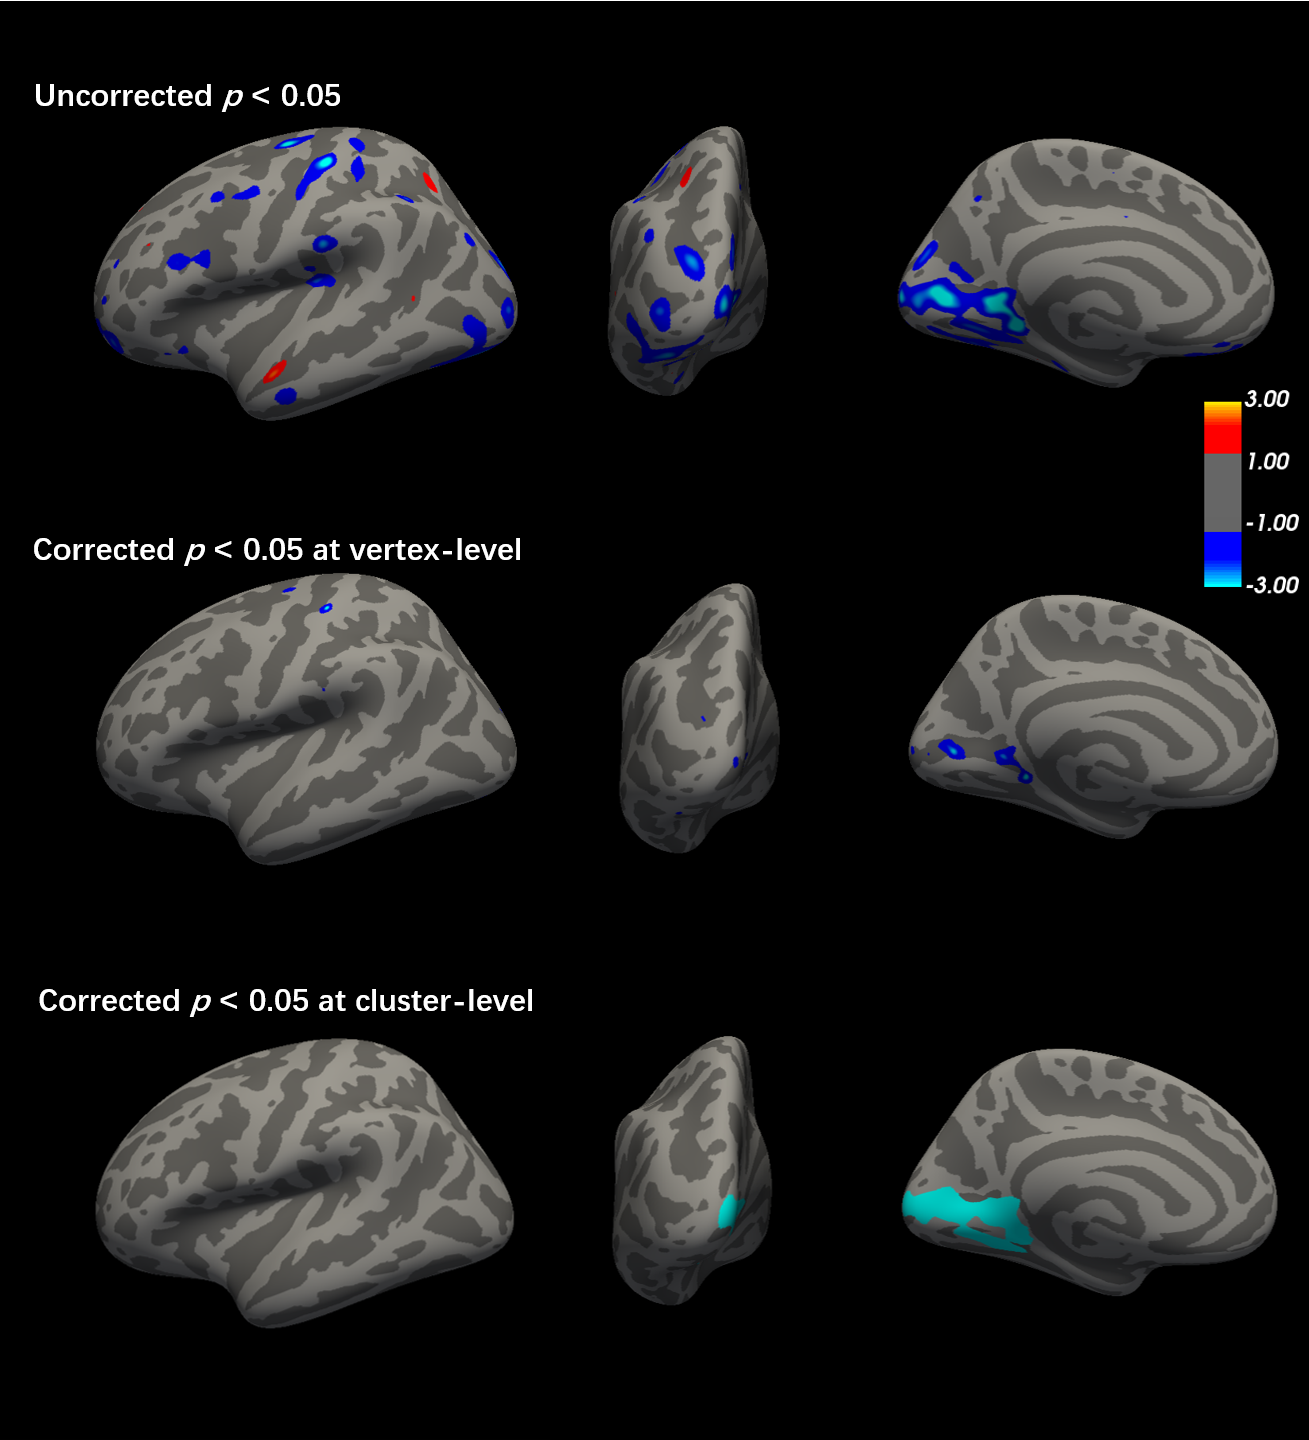
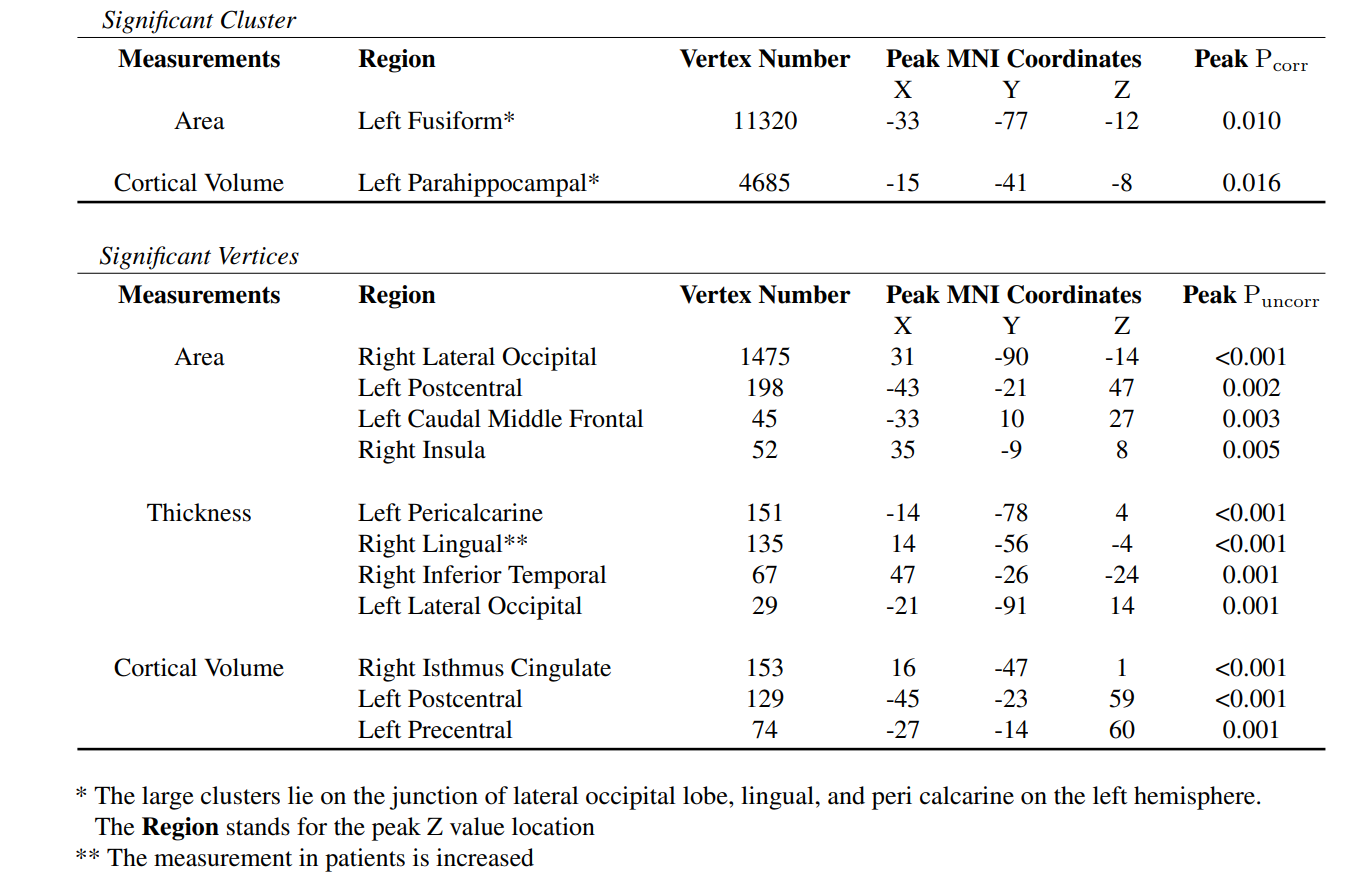
There is no significant difference in TIV and surface areas between patients and controls. The average cortical thickness of both left and right hemisphere are significantly reduced in the EP patients (left: p = 0.008, F = 7.26; right: p = 0.02, F = 5.72). At the cluster-wise level, the significant clusters were identified at the junction of the left lateral occipital, lingual and peri calcarine region where the cortical area and volume are shrunk in the patients. The peak P-value is located at the left fusiform (Figure 2) and para hippocampal (Figure 3), respectively. At the vertex-wise scale, some relatively small clusters where the cortical areas are reduced in the patient group were found at right lateral occipital, left postcentral, left caudal middle frontal, and right insula. The cortical thickness was decreased at left pericalcarine, right inferior temporal, and left lateral occipital lobe in the EP patient. The thickness increased slightly at the right lingual in patients. The cortical volume reduction was also highlighted in right isthmus cingulate, left postcentral, and left precentral (Figure 4).Discussion and conclusion
This is the first 7T MP2RAGE-based SBM study in patients with EP. The most significant clusters with reduced cortical area and volume in EP were identified at the junction of left lateral occipital, lingual and peri calcarine region. The clusters, where the surface area and cortex volume in patients were aberrant, largely overlap. Previous studies 11-13 using MRRAGE images at 3T and 1.5T failed to report significant alterations in the occipital lobe of EP patients. However, research on chronic schizophrenia 14,15 consistently reported abnormal geometric changes in the occipital area. Therefore, our current results suggest that the use of ultra-high field and MP2RAGE images may enable the detection of morphological alterations at the early stage of the disease. Our findings of other aberrations at temporal and occipital regions over the brain cortex in the patient group are consistent with most of the morphometric studies 16,17 in schizophrenia. A previous meta-analysis 18 showed that the majority of the cortex thinning and surface area shrinkage in patients with schizophrenia were situated in frontal and temporal lobe regions. Considering EP cases, studies mostly identified the cortical changes appearing at temporal and anterior cingulate cortex 19,20. The different outcomes between ours and studies in chronic patients could be the cortex alteration expansion to the frontal part with the duration of illness.In conclusion, the results of surface-based analysis using MP2RAGE images at an ultra-high magnetic field provide evidence of different cortical structural features between EP patients and controls. Equipped with such sensitive techniques, we may capture the subtle alterations at the early stage of neurological disorder. The findings are comparable with the relevant neuroimaging studies.
Acknowledgements
We thank the funding supports from National Center of Competence in Research (NCCR) “SYNAPSY - The Synaptic Bases of Mental Diseases” from the Swiss National Science Foundation (n° 51AU40_125759 to KQD), Swiss National Science Foundation (n° 320030_189064), Brixham Foundation, Alamaya Foundation, and Biaggi Foundation. We also acknowledge access to the facilities and expertise of the CIBM Center for Biomedical Imaging, a Swiss research center of excellence funded and supported by Lausanne University Hospital (CHUV), University of Lausanne (UNIL), Ecole Polytechnique Fédérale de Lausanne (EPFL), University of Geneva (UNIGE) and Geneva University Hospitals (HUG).References
1. S. Lui et al., ‘Association of cerebral deficits with clinical symptoms in antipsychotic-naive first-episode schizophrenia: an optimized voxel-based morphometry and resting state functional connectivity study’, Am J Psychiatry, vol. 166, no. 2, pp. 196–205, Feb. 2009, doi: 10.1176/appi.ajp.2008.08020183.
2. C. Shah et al., ‘Common pattern of gray-matter abnormalities in drug-naive and medicated first-episode schizophrenia: a multimodal meta-analysis’, Psychol Med, vol. 47, no. 3, pp. 401–413, Feb. 2017, doi: 10.1017/S0033291716002683.
3. K. E. Lewandowski, S. Bouix, D. Ongur, and M. E. Shenton, ‘Neuroprogression across the Early Course of Psychosis †’, Journal of Psychiatry and Brain Science, vol. 5, no. 1, Feb. 2020, doi: 10.20900/jpbs.20200002.
4. G. Okubo et al., ‘MP2RAGE for deep gray matter measurement of the brain: A comparative study with MPRAGE’, J Magn Reson Imaging, vol. 43, no. 1, pp. 55–62, Jan. 2016, doi: 10.1002/jmri.24960.
5. A. Droby et al., ‘Whole brain and deep gray matter structure segmentation: Quantitative comparison between MPRAGE and MP2RAGE sequences’, PLOS ONE, vol. 16, no. 8, p. e0254597, Aug. 2021, doi: 10.1371/journal.pone.0254597.
6. Z. Wang, M. Cleusix, R. Jenni, P. Conus, K. Q. Do, and L. Xin, ‘Structural abnormalities in patients with early psychosis: a MP2RAGE-based morphometric study at 7T’, presented at the International Society for Magnetic Resonance in Medicine, London, 2022.
7. P. S. Baumann et al., ‘Treatment and early intervention in psychosis program (TIPP-Lausanne): Implementation of an early intervention programme for psychosis in Switzerland’, Early Interv Psychiatry, vol. 7, no. 3, pp. 322–328, Aug. 2013, doi: 10.1111/eip.12037.
8. J. P. Marques, T. Kober, G. Krueger, W. van der Zwaag, P.-F. Van de Moortele, and R. Gruetter, ‘MP2RAGE, a self bias-field corrected sequence for improved segmentation and T1-mapping at high field’, Neuroimage, vol. 49, no. 2, pp. 1271–1281, Jan. 2010, doi: 10.1016/j.neuroimage.2009.10.002.
9. J. Ashburner and K. J. Friston, ‘Unified segmentation’, NeuroImage, vol. 26, no. 3, pp. 839–851, Jul. 2005, doi: 10.1016/j.neuroimage.2005.02.018.
10. R. S. Desikan et al., ‘An automated labeling system for subdividing the human cerebral cortex on MRI scans into gyral based regions of interest’, NeuroImage, vol. 31, no. 3, pp. 968–980, Jul. 2006, doi: 10.1016/j.neuroimage.2006.01.021.
11. S. Rigucci et al., ‘Anatomical substrates of cognitive and clinical dimensions in first episode schizophrenia’, Acta Psychiatrica Scandinavica, vol. 128, no. 4, pp. 261–270, 2013, doi: 10.1111/acps.12051.
12. D. Tordesillas-Gutierrez et al., ‘Grey matter volume differences in non-affective psychosis and the effects of age of onset on grey matter volumes: A voxelwise study’, Schizophr Res, vol. 164, no. 1–3, pp. 74–82, May 2015, doi: 10.1016/j.schres.2015.01.032.
13. L. Asmal, S. du Plessis, M. Vink, B. Chiliza, S. Kilian, and R. Emsley, ‘Symptom attribution and frontal cortical thickness in first-episode schizophrenia’, Early Intervention in Psychiatry, vol. 12, no. 4, pp. 652–659, 2018, doi: 10.1111/eip.12358.
14. C. C. Schultz et al., ‘The visual cortex in schizophrenia: alterations of gyrification rather than cortical thickness--a combined cortical shape analysis’, Brain Struct Funct, vol. 218, no. 1, pp. 51–58, Jan. 2013, doi: 10.1007/s00429-011-0374-1.
15. K. Li, J. A. Sweeney, and X. P. Hu, ‘Context-dependent dynamic functional connectivity alteration of lateral occipital cortex in schizophrenia’, Schizophrenia Research, vol. 220, pp. 201–209, Jun. 2020, doi: 10.1016/j.schres.2020.03.020.
16. C. U. Lee et al., ‘Fusiform gyrus volume reduction in first-episode schizophrenia: a magnetic resonance imaging study’, Arch Gen Psychiatry, vol. 59, no. 9, pp. 775–781, Sep. 2002, doi: 10.1001/archpsyc.59.9.775.
17. N. I, Y. Ra, S. H, and G. C, ‘Patterns of cortical thinning in different subgroups of schizophrenia’, The British journal of psychiatry : the journal of mental science, vol. 206, no. 6, Jun. 2015, doi: 10.1192/bjp.bp.114.148510.
18. T. G. M. van Erp et al., ‘Cortical Brain Abnormalities in 4474 Individuals With Schizophrenia and 5098 Control Subjects via the Enhancing Neuro Imaging Genetics Through Meta Analysis (ENIGMA) Consortium’, Biological Psychiatry, vol. 84, no. 9, pp. 644–654, Nov. 2018, doi: 10.1016/j.biopsych.2018.04.023.
19. J. S. Kim, C. K. Chung, H. J. Jo, J. M. Lee, and J. S. Kown, ‘Regional thinning of cerebral cortical thickness in first-episode and chronic schizophrenia’, International Journal of Imaging Systems and Technology, vol. 22, no. 1, pp. 73–80, 2012, doi: 10.1002/ima.22002.
20. K. Wen et al., ‘Cortical thickness abnormalities in patients with first episode psychosis: a meta-analysis of psychoradiologic studies and replication in an independent sample’, Psychoradiology, vol. 1, no. 4, pp. 185–198, Dec. 2021, doi: 10.1093/psyrad/kkab015.
Figures