4752
Reduction of Hippocampal Subfield Volumes in Treatment-Resistant Depression using ASHS: A 7-Tesla Study
Judy Alper1, Gaurav Verma1, Shams Rashid1, and Priti Balchandani1
1Icahn School of Medicine at Mount Sinai, New York, NY, United States
1Icahn School of Medicine at Mount Sinai, New York, NY, United States
Synopsis
Keywords: Psychiatric Disorders, High-Field MRI
Major depressive disorder has complex pathophysiology. It is critical to understand treatment-resistant depression (TRD) specifically, as there are many patients for whom no sufficient treatment exists. In this study we assess volumetric differences in hippocampal subfields between TRD patients and healthy controls (HC) using automatic segmentation of hippocampal subfields and ultra-high field MRI. 13 TRD patients and 13 HC underwent imaging using 7-Tesla MRI. ASHS software produced automated hippocampal segmentation for volumetric analysis. Compared to HC, TRD patients showed reduced right-hemisphere CA2/3 subfield volume. Determining biomarkers for TRD pathophysiology may elucidate the underlying mechanisms of treatment-resistant depression.Introduction
Major depressive disorder (MDD) is a prevalent health problem with complex pathophysiology that is not clearly understood. In addition to understanding the biological basis for MDD, it is critical to understand treatment-resistant depression (TRD), as there are many patients for whom no sufficient treatment exists [1]. It is estimated that 20-30% of patients with depression experience resistance to treatment [2], and TRD represents approximately half of the treatment costs for MDD overall [3]. Prior work has implicated the hippocampus in MDD [4], but how hippocampal subfields influence or are affected by TRD requires further characterization with high-resolution data. This will help ascertain the accuracy and reproducibility of previous subfield findings. The objective of this study was to assess volumetric differences in hippocampal subfields between treatment-resistant depression patients and HC using automatic segmentation of hippocampal subfields (ASHS) [5] software and ultra-high field MRI.Methods
Subjects: 13 TRD patients and 13 HC, matched for age and biological sex, underwent imaging using 7-Tesla MRI. TRD patients were defined as patients with a lifetime history of one or more anti-depressant failures.Image acquisition protocol: A 32-channel Nova Medical head coil was used to acquire brain images for segmentation. The 90-minute imaging protocol included MP2RAGE (TR 6000 ms, TI1 1050 ms, TI2 3000 ms, TE 5.06 ms, voxel 0.70 x 0.70 x 0.70 mm3) and T2 TSE (TR 9000 ms, TE 69 ms, voxel 0.45x0.45x2 mm3) scans acquired at a coronal oblique oriented perpendicular to the long axis of the hippocampus.
Hippocampal subfield segmentation: ASHS software was applied to the imaging data to perform automated hippocampal segmentation and provide volumetrics for analysis. The subfields delineated by ASHS included the cornu-ammonis (CA) regions, including CA1, CA2/3, and CA4/DG, as well as the the subiculum. High resolution T1 and T2 weighted images were used as inputs to perform optimal segmentation with ASHS.
Statistics: All hippocampal subfields were normalized to total brain volume. Because the data were not normally distributed, the nonparametric Mann-Whitney U test was used to compare subfield volumes by group. Effect sizes (η2) were also calculated for each comparison. Significance was set at 0.05. Correction for multiple comparisons was performed using adaptive false discovery rate (FDR) [6]. Given the small sample size, permutation testing [7] was also performed to check the significant values for false positives and verify the statistical significance of the models.
Results
The results of ASHS hippocampal subfield segmentation for one representative subject are shown in Figure 1. Compared to HC, TRD patients showed reduced right-hemisphere CA2/3 subfield volume (p = 0.03, η2 = 0.44), as shown in Figure 2, using ASHS. The full set of results for this group comparison is shown in Table 1. These findings in the right CA2/3 subfield survived correction for multiple comparisons with adaptive FDR. Subsequent statistical analysis with permutation testing confirmed the statistical significance of the CA2/3 subfield volume findings.Conclusion
Determining biomarkers for TRD pathophysiology through segmentation on high-resolution MRI data can enable better assessment of biological response to treatment selection and may elucidate the underlying mechanisms of resistance to treatment in depression. Significant volumetric differences between TRD patients and controls were found in CA2/3 in the right hemisphere, with smaller volumes in patients, a pattern which is concordant with the literature on hippocampal subfield changes associated with stress-related disorders [8]. This preliminary finding indicates that a larger study in TRD patients versus controls is warranted.Acknowledgements
NIH R01 MH109544Icahn School of Medicine Capital Campaign, Biomedical Engineering Imaging Institute and Department of Diagnostic, Molecular, and Interventional Radiology
The Ehrenkranz Laboratory for Human Resilience, a component of the Depression and Anxiety Center for Discovery and Treatment at the Icahn School of Medicine at Mount Sinai, and by a generous gift from the Gottesman Foundation to Mount Sinai
CCNY Department of Biomedical Engineering
References
1. Murrough, J.W. and D.S. Charney, Is there anything really novel on the antidepressant horizon? Current psychiatry reports, 2012. 14(6): p. 643-649.2. Rush, A.J., et al., Acute and longer-term outcomes in depressed outpatients requiring one or several treatment steps: a STAR* D report. American Journal of Psychiatry, 2006. 163(11): p. 1905-1917.
3. Greden, J.F., The burden of disease for treatment-resistant depression. Journal of Clinical Psychiatry, 2001. 62: p. 26-31.
4. Brown, S.S., et al., Structural MRI at 7T reveals amygdala nuclei and hippocampal subfield volumetric association with major depressive disorder symptom severity. Scientific reports, 2019. 9(1): p. 1-10.
5. Yushkevich, P.A., et al., Automated volumetry and regional thickness analysis of hippocampal subfields and medial temporal cortical structures in mild cognitive impairment. Human brain mapping, 2015. 36(1): p. 258-287.
6. Blanchard, G. and É. Roquain, Adaptive False Discovery Rate Control under Independence and Dependence. Journal of Machine Learning Research, 2009. 10(12).
7. Jacob, Y., et al., Anger modulates influence hierarchies within and between emotional reactivity and regulation networks. Frontiers in Behavioral Neuroscience, 2018. 12: p. 60.
8. Travis, S.G., et al., Effects of cortisol on hippocampal subfields volumes and memory performance in healthy control subjects and patients with major depressive disorder. Journal of affective disorders, 2016. 201: p. 34-41.
Figures
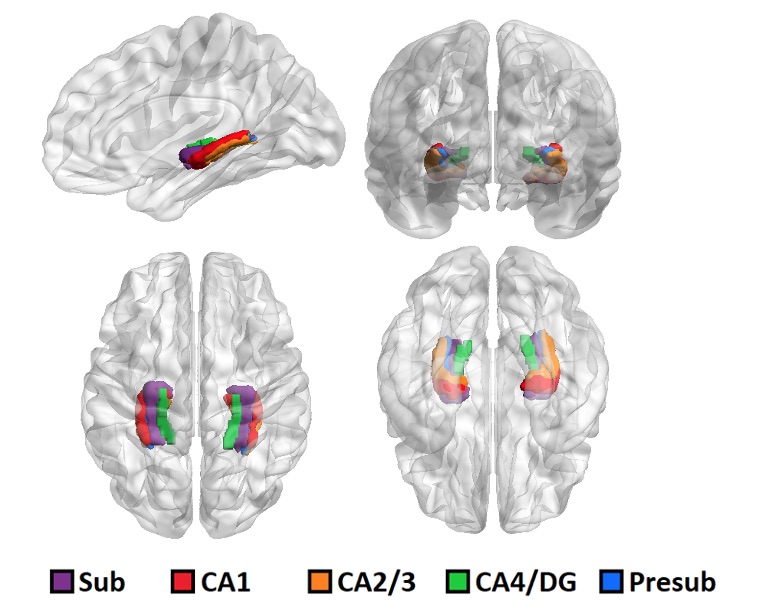
Figure 1. 3D rendering of one representative subject’s brain with an overlay of the automated hippocampal subfields segmentation
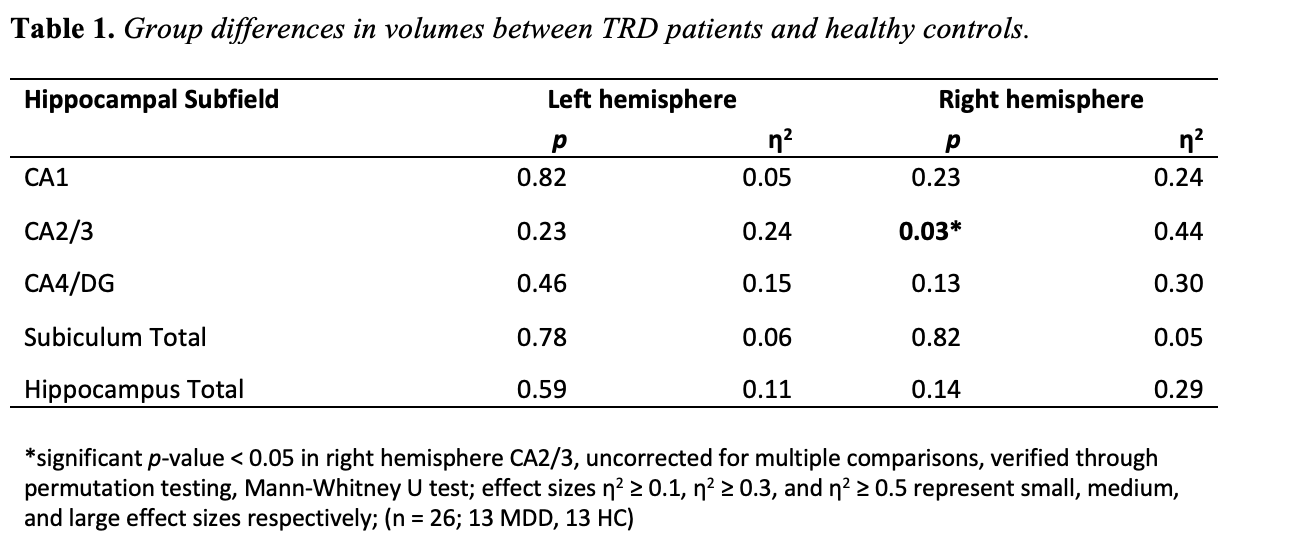
Table 1. Group differences in volumes between TRD patients and healthy controls. *significant p-value < 0.05 in right hemisphere CA2/3, corrected for multiple comparisons, verified through permutation testing, Mann-Whitney U test; effect sizes η2 ≥ 0.1, η2 ≥ 0.3, and η2 ≥ 0.5 represent small, medium, and large effect sizes respectively; (n = 26; 13 MDD, 13 HC)
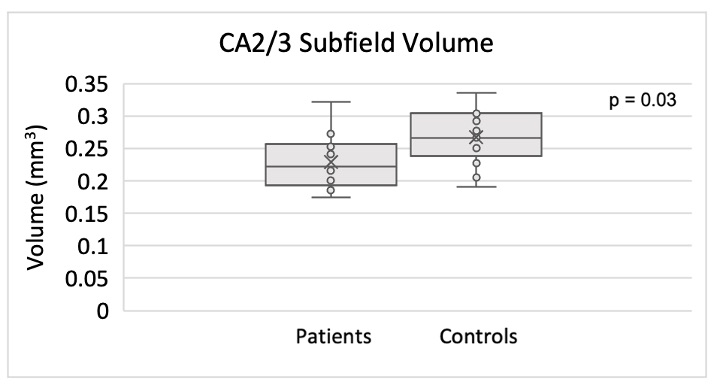
Figure 2. Smaller CA2/3 subfield volume in the right hippocampus of TRD patients compared to controls using ASHS.
DOI: https://doi.org/10.58530/2023/4752