4749
Multi-parametric MRI-based Radiomics integrated with Clinical Features for Predicting the Ki-67 Labeling Index in Nasopharyngeal Carcinoma1Department of Clinical Medicine of Ningxia Medical University, Yinchuan, China, 2the First Hospital Affiliated to Hainan Medical College, Haikou, China, 3GE Healthcare, Beijing, China, 4General Hospital of Ningxia Medical University, Yinchuan, China
Synopsis
Keywords: Cancer, Head & Neck/ENT, multi-parametric MRI-based radiomics
To investigate the value of a nomogram based on multi-parametric MRI-based radiomics combined with clinical imaging features in predicting the Ki-67 LI in nasopharyngeal carcinoma. Least absolute shrinkage and selection operator (LASSO) regression was performed to select radiomics features. A nomogram was established using multivariable logistic regression. The receiver operating characteristic (ROC) curves, calibration, and decision curves were performed to evaluate the predictive performance of the different models. The nomograms constructed by integrating radiomics score (Rad-Score) with clinical imaging factors outperformed the clinical or the radiomics models alone.Summary of Main Findings
The nomogram based on multi-parametric MRI-based radiomics combined with clinical imaging features had a high performance in predicting Ki-67 labeling index (LI) before treatment in patients with nasopharyngeal carcinoma (NPC), which is superior to a single model and can be used as a non-invasive prediction tool.Introduction
Nasopharyngeal carcinoma (NPC) is a malignant tumor originating from the nasopharyngeal mucosal epithelium 1. Previous study has reported that the proliferation mode and speed of tumor cells were closely correlated with the malignant degree and prognosis of NPC 2. Ki-67, as a nuclear antigen expressed in the proliferative phase of the tumor cells, can accurately represent the proliferative activity of tumor cells 3. Therefore, accurate prediction of Ki-67 labeling index (LI) is helpful to evaluate the prognosis of NPC patients. However, Ki-67 LI can only be obtained by immunohistochemical staining of pathological tissue in clinical practice, which is invasive and only represent a small part of the tumor tissue. Radiomics can extract high-throughput non-visual features from the conventional medical images, which are closely associated with the Ki-67 expression level, gene mutation status, and prognosis of the malignant tumors 4. Multi-parametric MRI-based radiomics has demonstrated favorable results in predicting the Ki-67 LI in breast cancer, glioma, lung cancer, et al 4, 6, 7. However, there are few studies on Ki-67 LI prediction based on multi-parametric MRI radiomics in patients with NPC. So the purpose of this study was to investigate the value of multi-parametric MRI-based radiomics integrated with clinical imaging features in assessing Ki-67 LI in patients with NPC.Material and Methods
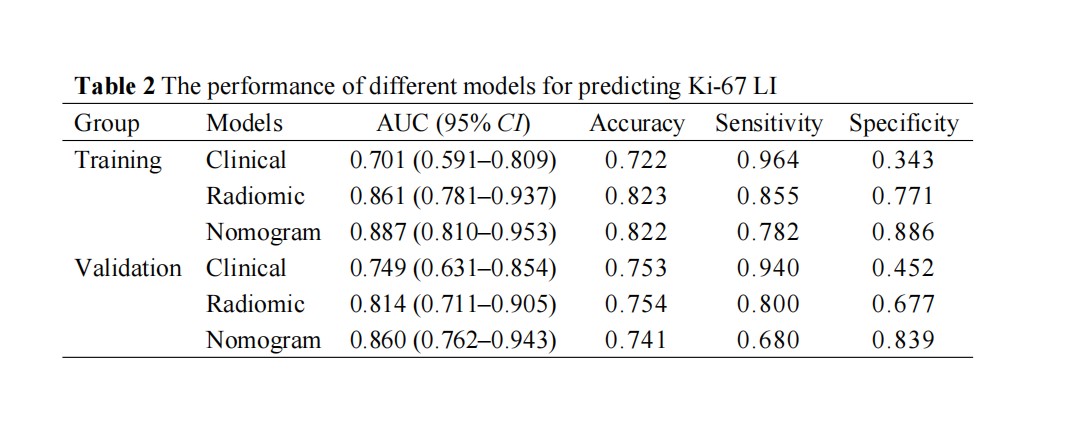
A total of 171 NPC patients were included in our study, they were randomly divided into the training (n = 103, 52.03±8.25years, 65 male) and validation (n = 68, 53.59±10.56years, 39 male) cohorts, at a 3:2 ratio. The contrast-enhanced (CE) MR examinations of the nasopharynx were conducted by using head and neck coils with 1.5-T MR scanners (SIGNATM HDx; GE Healthcare, Milwaukee, WI, USA). The detailed parameters for imaging sequences are reported in Table 1. We used 3D-Slicer (www.slicer.org, version 4.13.0) to segment the (Region of interest, ROI) of NPC lesions manually slice-by-slice on the axial CE_T1WI (Fig. 1), excluding hemorrhage, calcification, or necrosis/cystic, and then mapped to the T1WI and T2WI_FS images. Subsequently, the “PyRadiomics” package was performed to extract radiomics features, and LASSO regression was applied to select features for Rad-Score calculation. Univariate and multivariate logistic regression analyses were performed to select the clinical predictors of high Ki-67 LI. The nomogram was constructed using multivariate logistic regression. (Receiver operating characteristic, ROCs) and calibration curves were plotted, and AUCs with 95% confidence interval (CI) was calculated to evaluated the performance of different models. Decision curve analysis (DCA) was used to estimate the clinical usefulness of the nomogram. P < 0.05 indicates a significant difference.Results
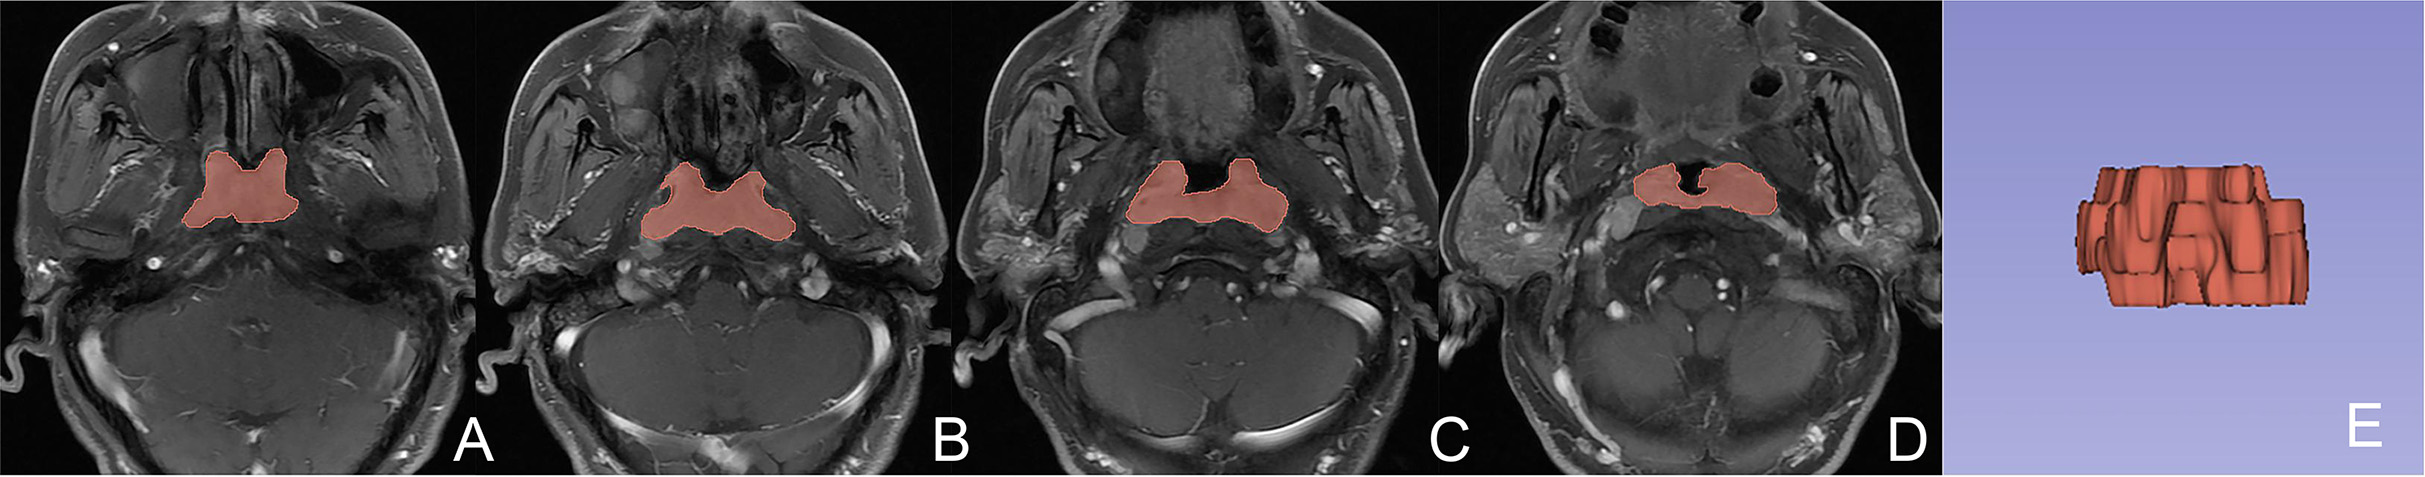
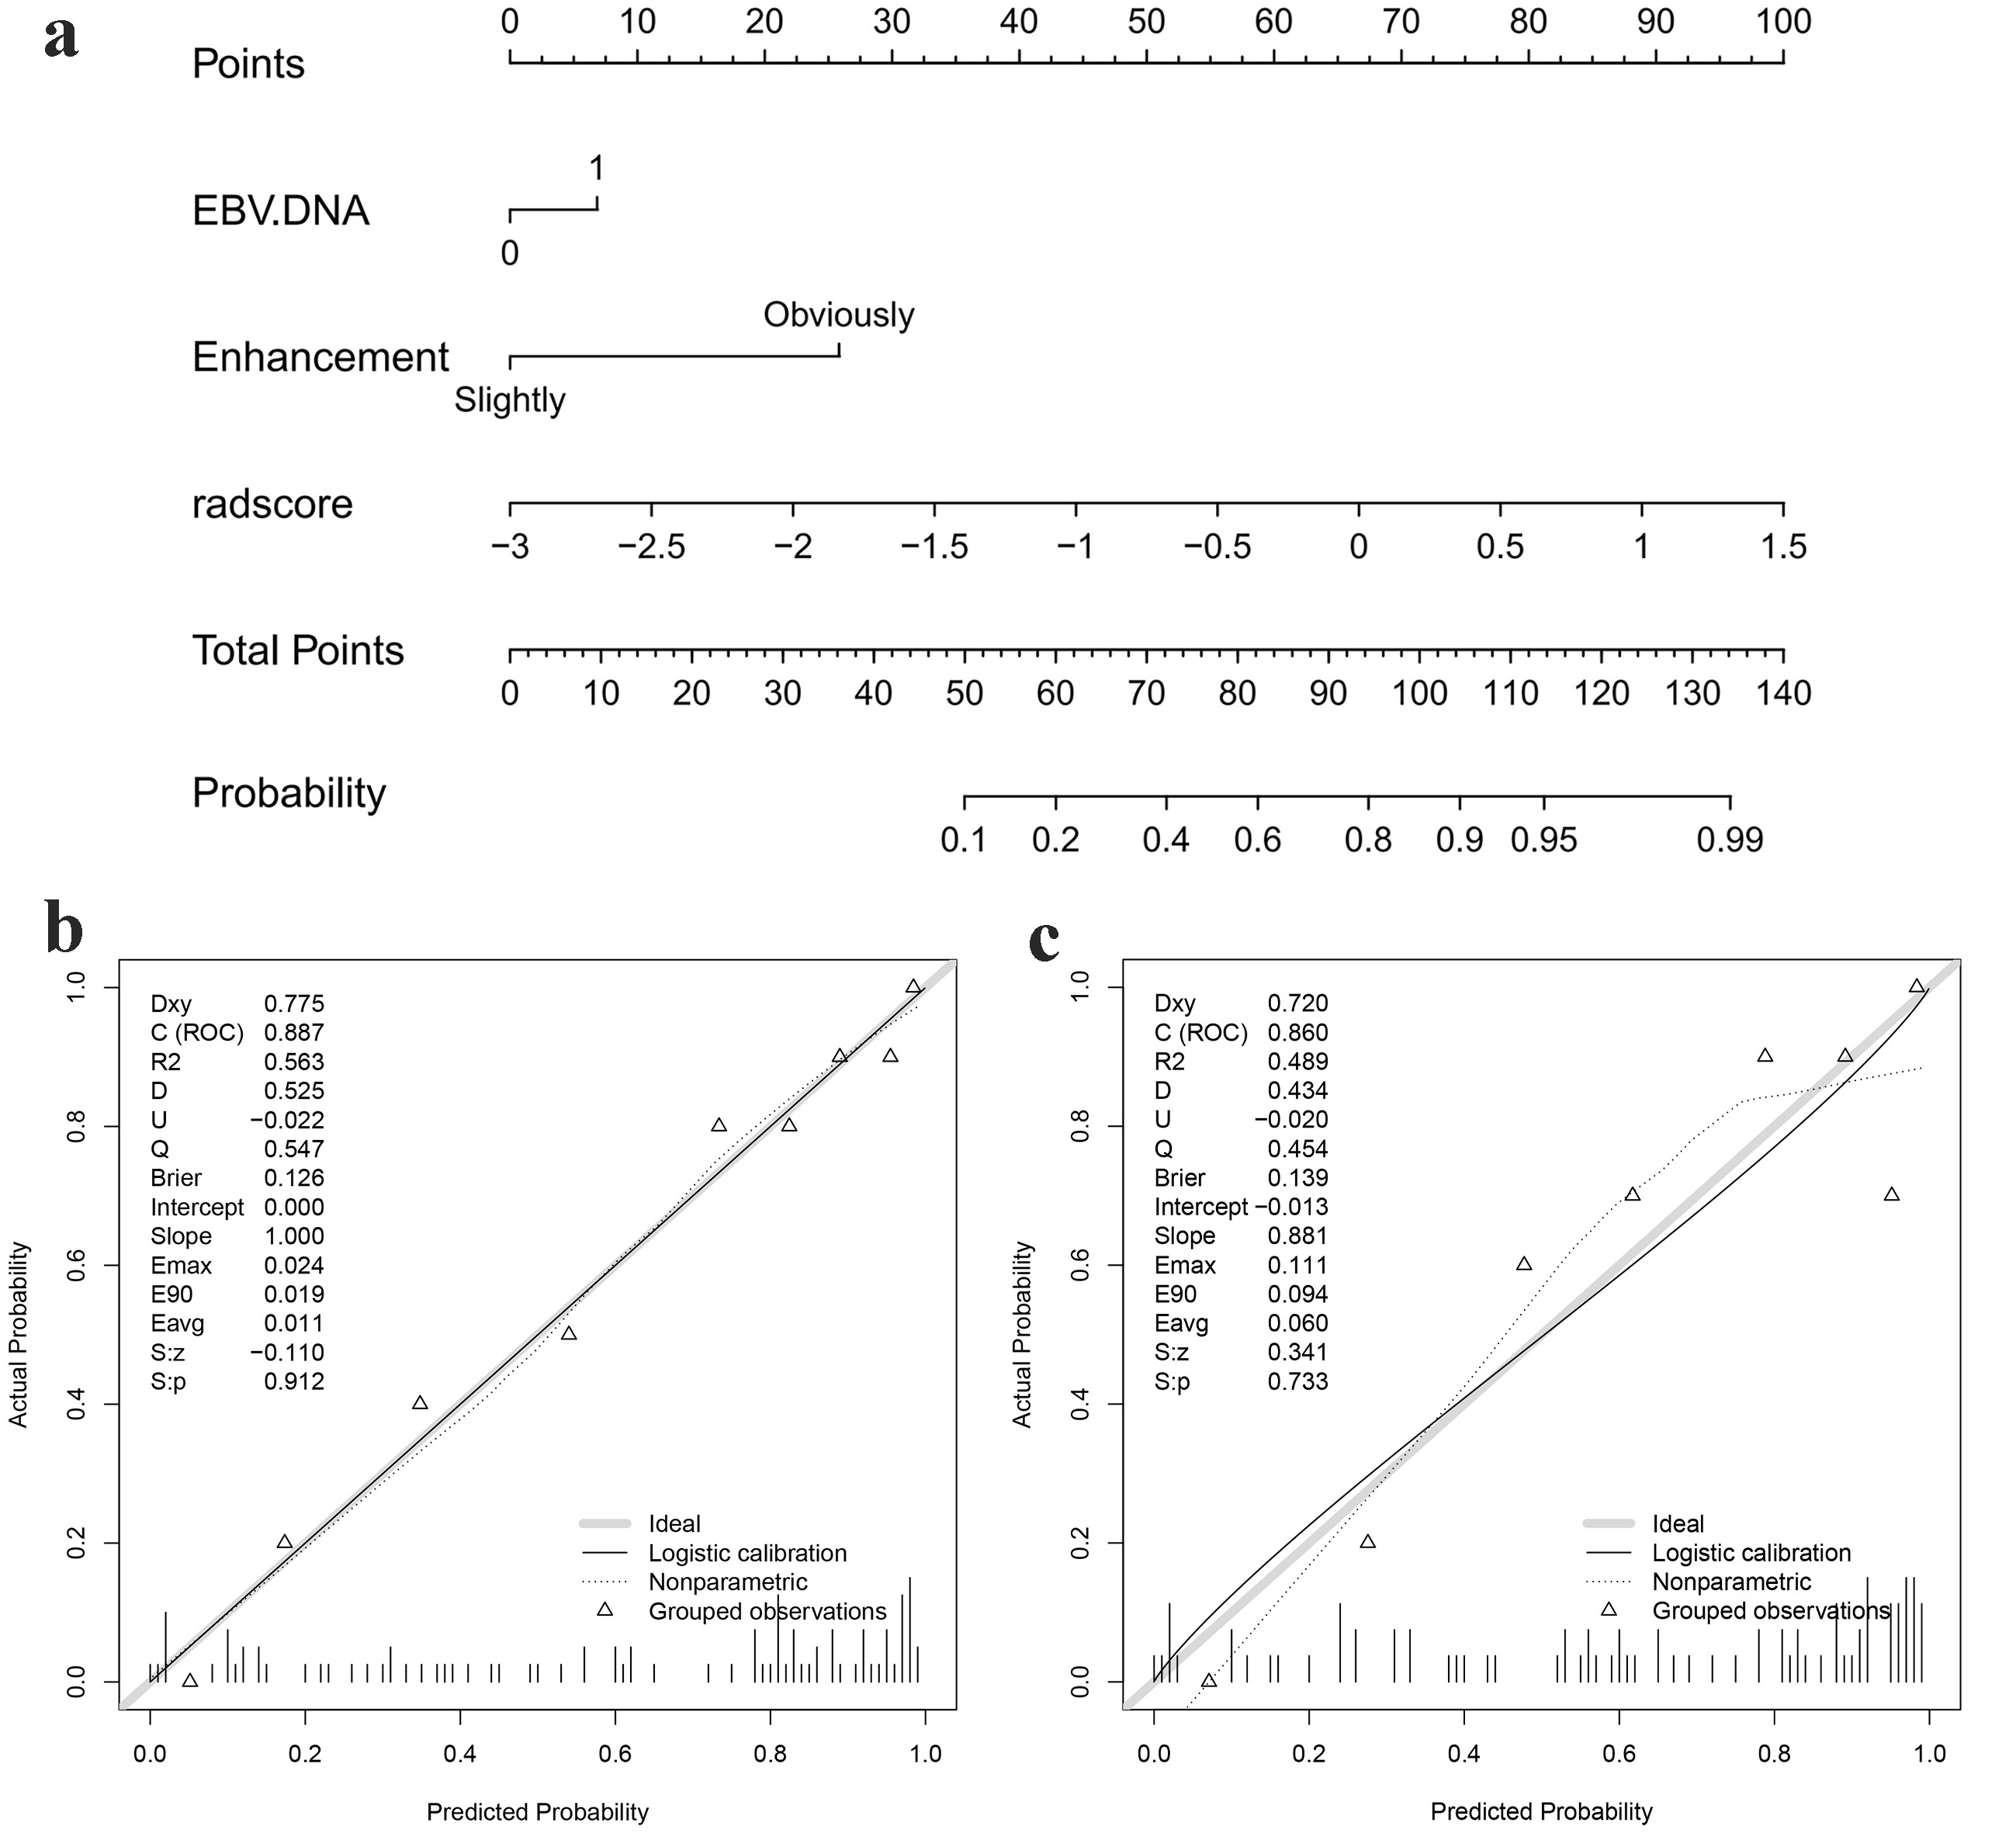
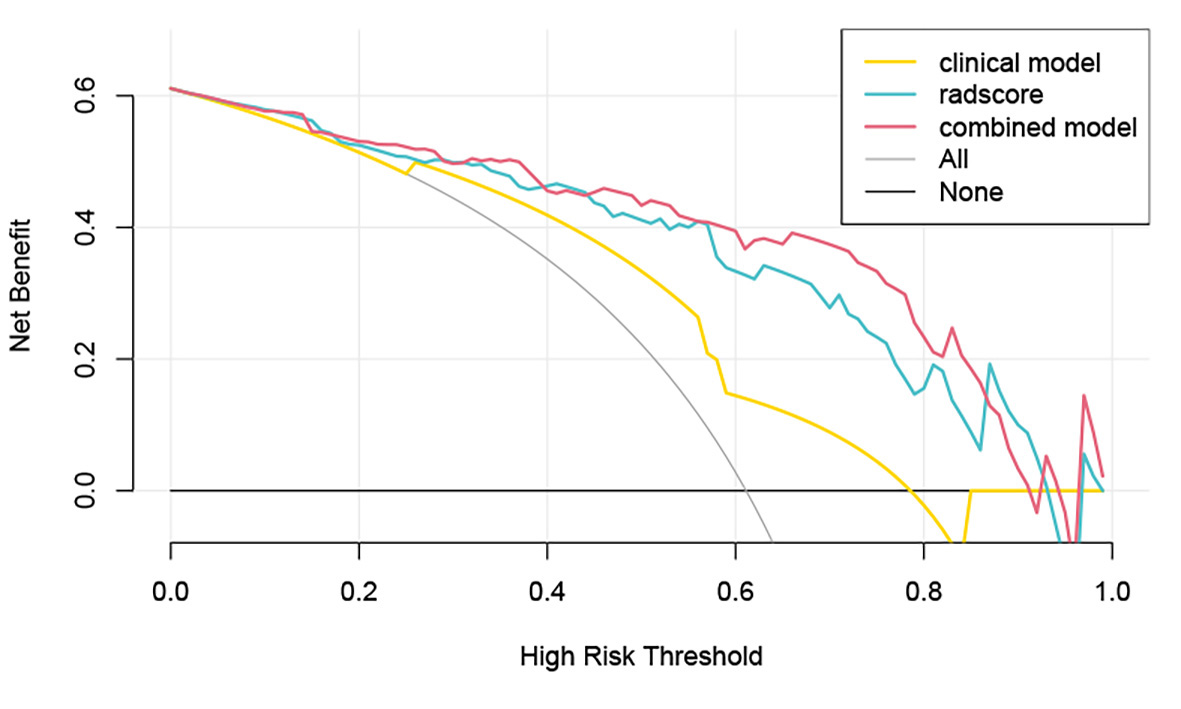
EBV-DNA≥5000IU/ml (odds ratio [OR] = 3.809, P = 0.007) and tumor enhancement (OR = 4.064, P = 0.005) were identified as the clinical predictors of high Ki-67 LI and a clinical model was established based on the above two factors. 7, 4, and 2 radiomics features related to the Ki-67 LI were finally selected from T1WI_CE, TIWI and T2WI_FS respectively by LASSO-logistic regression for establishing a radiomics model. As shown in Fig. 2a, A nomogram for predicting Ki-67 LI was established by integrating the Rad-Score, EBV-DNA, and tumor enhancement. The calibration curves of the nomogram demonstrated good agreements between the estimated and observed outcomes in both training and validation cohorts (Fig. 2b, c). As is shown in Table 2, The AUCs of the nomogram were higher than those of the clinical or radiomic models (AUC for training group: 0.887 vs. 0.701, 0.861; for validation group: 0.860 vs. 0.749, 0.814). DCA showed that when the risk threshold probability was within the range of 0.1 to 0.8, the nomogram had higher net benefit than the simple clinical or radiomics model (Fig. 3).Discussion and Conclusion
Our study revealed that a high Ki-67 LI was more common in NPC patients with markedly enhanced tumor lesions and EBV-DNA ≥ 5000IU/ml. However, the clinical model based on the above two factors showed moderate performance, with AUCs of 0.701 and 0.749 in the training and validation cohorts, respectively. It may be because the conventional clinical factors only provided anatomical information limited to the human eye, but cannot comprehensively reflect the internal heterogeneity of the tumors. Therefore, our study integrated radiomics features with the clinical and imaging factors to establish a nomogram to quantify the weight of risk factors of high Ki-67 LI. Moreover, the predictive performance of the nomogram was significantly improved when the rad-score was added to the clinical model as compared with the clinical model along in both the training and validation cohorts (AUCs: 0.887 vs. 0.701, 0.861 vs. 0.749, respectively). This indicates that the multi-parametric MRI-based radiomics features reflecting the functional metabolism of tumor cells could better describe tumor heterogeneity than the conventional morphological features. In conclusion, the nomogram developed from multiparametric MRI-based radiomics integrated with clinical and imaging features could serve as a reliable tool for non-invasively predicting Ki-67 LI in patients with NPC.Acknowledgements
This study was supported by grants from The Key Research and Development Program of Ningxia (No.2019BEG03033) and Natural Science Foundation of Ningxia(2022AAC03472).Author contributions: conception and design: Zhuo Wang, Zhiqiang Chen; acquisition of data: Zhuo Wang, Shaoru Zhang, Xiaohua Chen, Yunshu Zhou, Shaoru Zhang, Shili Liu; Data analysis and interpretation: Zhiqiang Chen and Zhuo Wang; drafting the article and revising it critically for important intellectual content: Zhuo Wang; final approval of manuscript: all authors. The authors declare no conflicts of interest.References
[1] de Martel C, Georges D, Bray F, et al. Global burden of cancer attributable to infections in 2018: a worldwide incidence analysis. Lancet Glob Health. 2020 Feb;8(2): e180-e190. DOI: 10.1016/S2214-109X (19)30488-7.
[2] Shi Z, Jiang W, Chen X, et al. Prognostic and clinicopathological value of Ki-67 expression in patients with nasopharyngeal carcinoma: a meta-analysis. Ther Adv Med Oncol. 2020 Sep 20; 12:1758835920951346. DOI: 10.1177/1758835920951346.
[3] Stamatiou K, Vagnarelli P. Chromosome clustering in mitosis by the nuclear protein Ki-67. Biochem Soc Trans. 2021 Dec 17;49(6):2767-2776. DOI: 10.1042/BST20210717.
[4] Dong Y, Jiang Z, Li C, et al. Development and validation of novel radiomics-based nomograms for the prediction of EGFR mutations and Ki-67 proliferation index in non-small cell lung cancer. Quant Imaging Med Surg. 2022 May;12(5):2658-2671. DOI: 10.21037/qims-21-980.
[5] Bruixola G, Remacha E, Jiménez-Pastor A, et al. Radiomics and radiogenomics in head and neck squamous cell carcinoma: Potential contribution to patient management and challenges. Cancer Treat Rev. 2021 Sep; 99:102263. DOI: 10.1016/j.ctrv.2021.102263.
[6] Li C, Song L, Yin J. Intratumoral and Peritumoral Radiomics Based on Functional Parametric Maps from Breast DCE-MRI for Prediction of HER-2 and Ki-67 Status. J Magn Reson Imaging. 2021 Sep;54(3):703-714. DOI: 10.1002/jmri.27651.
[7] Su C, Jiang J, Zhang S, et al. Radiomics based on multicontrast MRI can precisely differentiate among glioma subtypes and predict tumour-proliferative behaviour. Eur Radiol. 2019 Apr;29(4):1986-1996. DOI: 10.1007/s00330-018-5704-8.
Figures
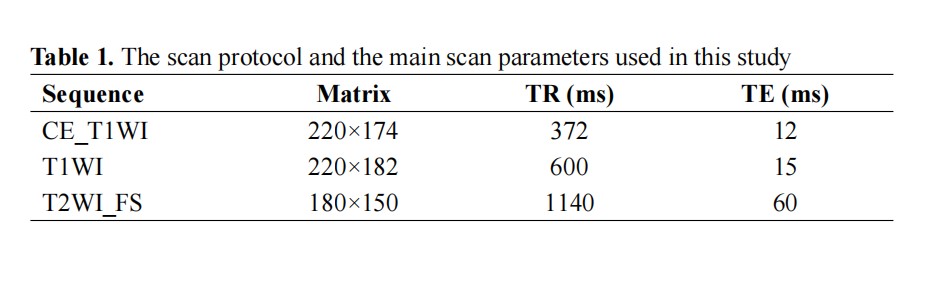
Abbreviation: CE_T1WI, contrast-enhanced T1-weighted imaging, T1WI, T1-weightedImaging, T2WI_FS, T2-weighted fast suppressed.
Field of view (FOV): 220 × 220 mm2, slice thickness: 5 mm, slice gap: 1 mm; all images were collected in transverse view.