4748
Multi-parametric MRI Radiomics Combined with Clinical Factors to Predict the Response to Neoadjuvant Chemotherapy in Nasopharyngeal Carcinoma1Department of Clinical Medicine of Ningxia Medical University, Yinchuan, China, 2Department of Radiology, the First Hospital Affiliated to Hainan Medical College, Haikou, China, 3GE Healthcare, Beijing, China, 4General Hospital of Ningxia Medical University, Yinchuan, China
Synopsis
Keywords: Cancer, Head & Neck/ENT, multi-parametric MRI-based radiomics
This study aims to evaluate the predictive performance of the nomogram integrating multi-parametric MRI-based radiomics and clinical characteristics in detecting therapeutic response to neoadjuvant chemotherapy (NAC) in nasopharyngeal carcinoma (NPC) patients. Least absolute shrinkage and selection operator (LASSO) regression was performed to select radiomics features. A nomogram was constructed using multivariable logistic regression. The receiver operating characteristic (ROC) curves, calibration, and decision curves were performed to assess the discriminative performance of the clinical, radiomics, and the combined models. The nomograms developed by integrating radiomics score (Rad-Score) with clinical factors outperformed the clinical model alone.Summary of Main Findings
The nomogram integrating multi-parametric MRI-based radiomics and clinical characteristics manifested good efficacy in predicting the response to neoadjuvant chemotherapy in patients with nasopharyngeal carcinoma.Introduction
Nasopharyngeal carcinoma (NPC) is a malignant tumor originating from the nasopharyngeal mucosal epithelium1. For locoregionally advanced NPC (LA-NPC), additional neoadjuvant chemotherapy (NAC) followed by concurrent chemoradiotherapy (CCRT) has been recommended as the first-line strategy. However, it was reported that 23.1% of the NPC patients could not benefit from NAC2. Therefore, there is a clinical need to identify NAC responders from non-responders before the treatment for personalized therapeutic options. Multi-parametric MRI-based radiomics, as a popular method to study tumor heterogeneity, has shown favorable results in predicting the diagnosis, tumor response, recurrence and metastasis of malignant tumors3, 4. So the purpose of this study was to investigate the value of multi-parametric MRI-based radiomics integrated with clinical features in predicting the response to NAC in patients with NPC.Material and Methods
184 patients with pathologically confirmed NPC (104 responders and 80 non-responders) were enrolled retrospectively in this study, they were randomly divided into the training (n = 110, 51.39±9.80 years, 65 male) and validation (n = 72, 49.76±12.75 years, 43 male) cohorts, at a 3:2 ratio. After obtaining written informed consent, all patients underwent MR examinations on a 1.5T MR scanner (SIGNATM HDx; GE Healthcare, Milwaukee, WI, USA). The scan protocols and the scan parameters were listed in Table 1. We used 3D-Slicer (www.slicer.org, version 4.13.0) to segment the ROIs of NPC lesions manually slice-by-slice on the axial CE_T1WI, T1WI, and T2WI_FS images (Fig. 1). We made all ROIs placement from the solid portion of the lesion, excluding hemorrhage, calcification, or necrosis/cystic. Subsequently, the “PyRadiomics” package was performed to extract radiomics features, and then least absolute shrinkage and selection operator (LASSO) regression was applied to select features for Rad-Score calculation. Continuous variables were compared by the students’ t test, while categorical variables were analyzed by the chi-square, corrected chi-square, or Fisher’ s exact tests, to compare clinical characteristics between NAC responders and non-responders. The nomogram was constructed using multivariate logistic regression. The receiver operating characteristic (ROC) and calibration curves were plotted, and AUCs with 95% confidence interval (CI) was calculated to evaluate the performance of the clinical, radiomics, and the combined models. P < 0.05 indicates a significant difference.Results
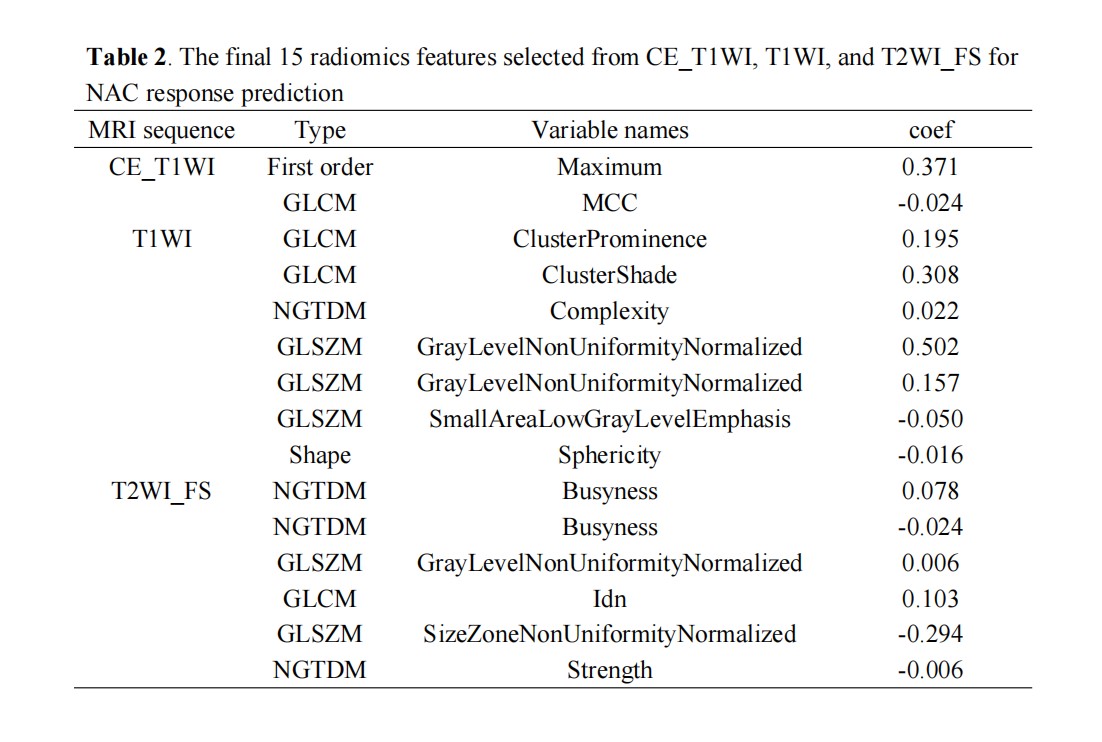
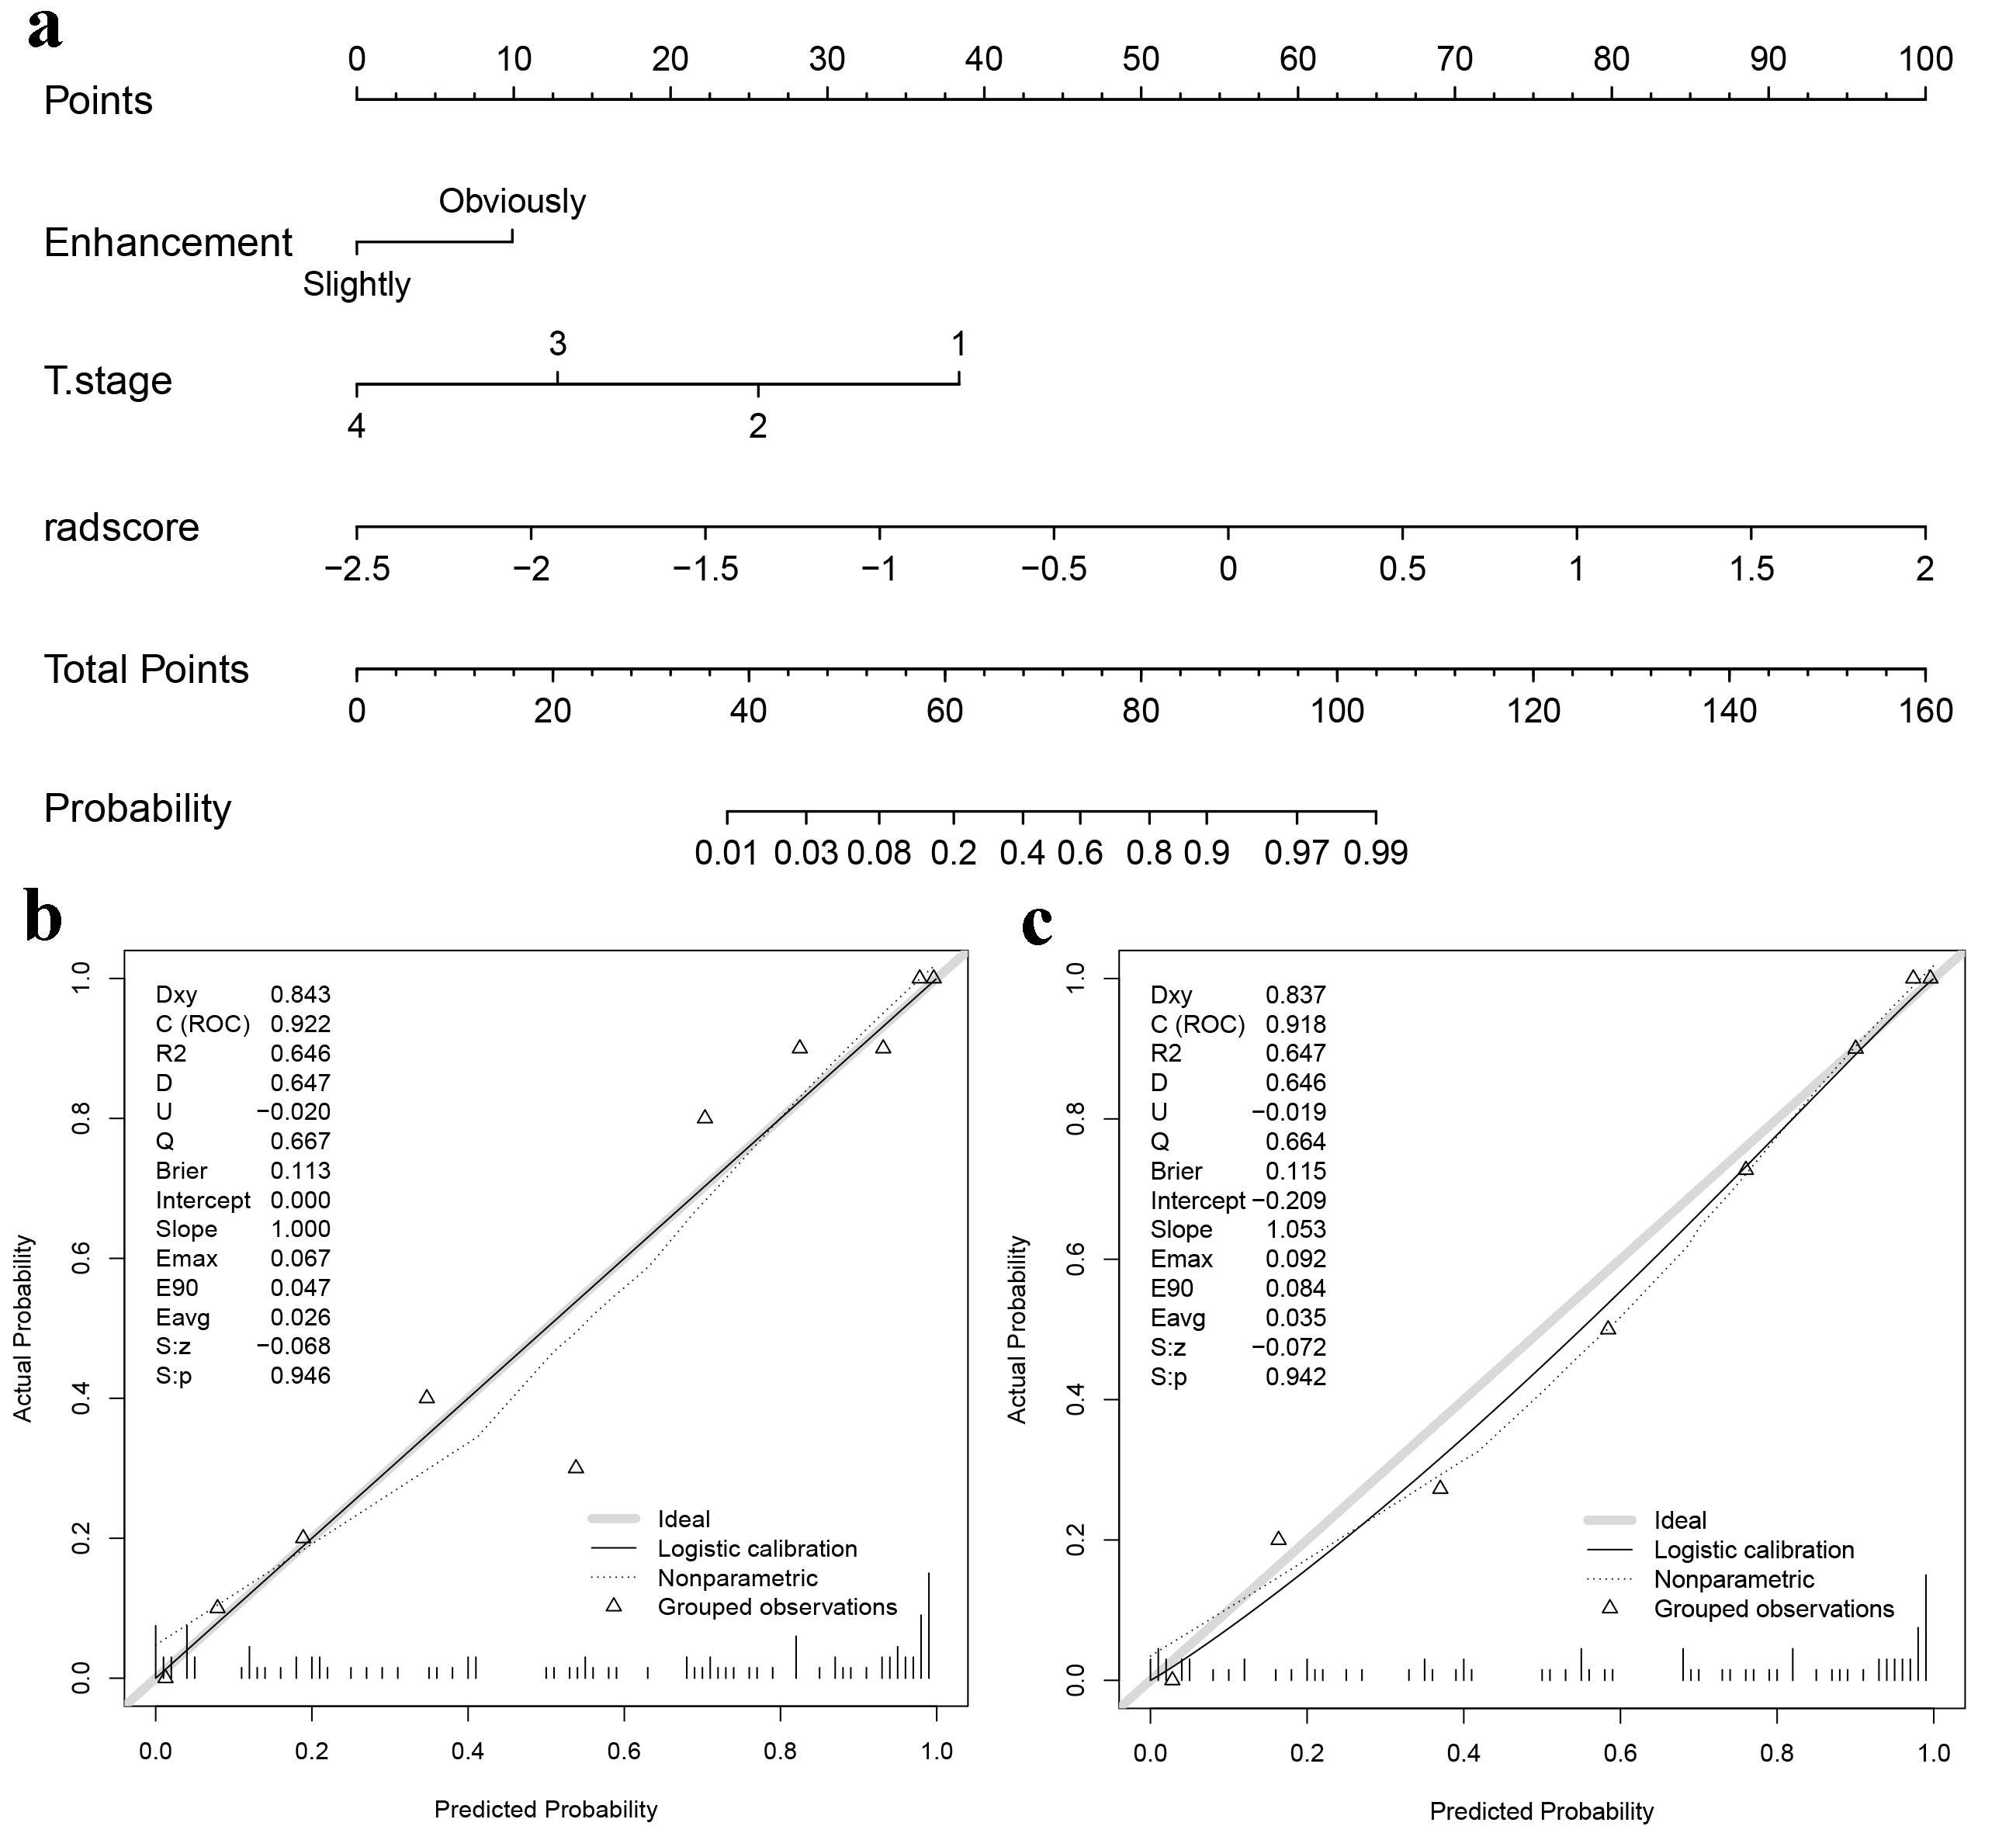
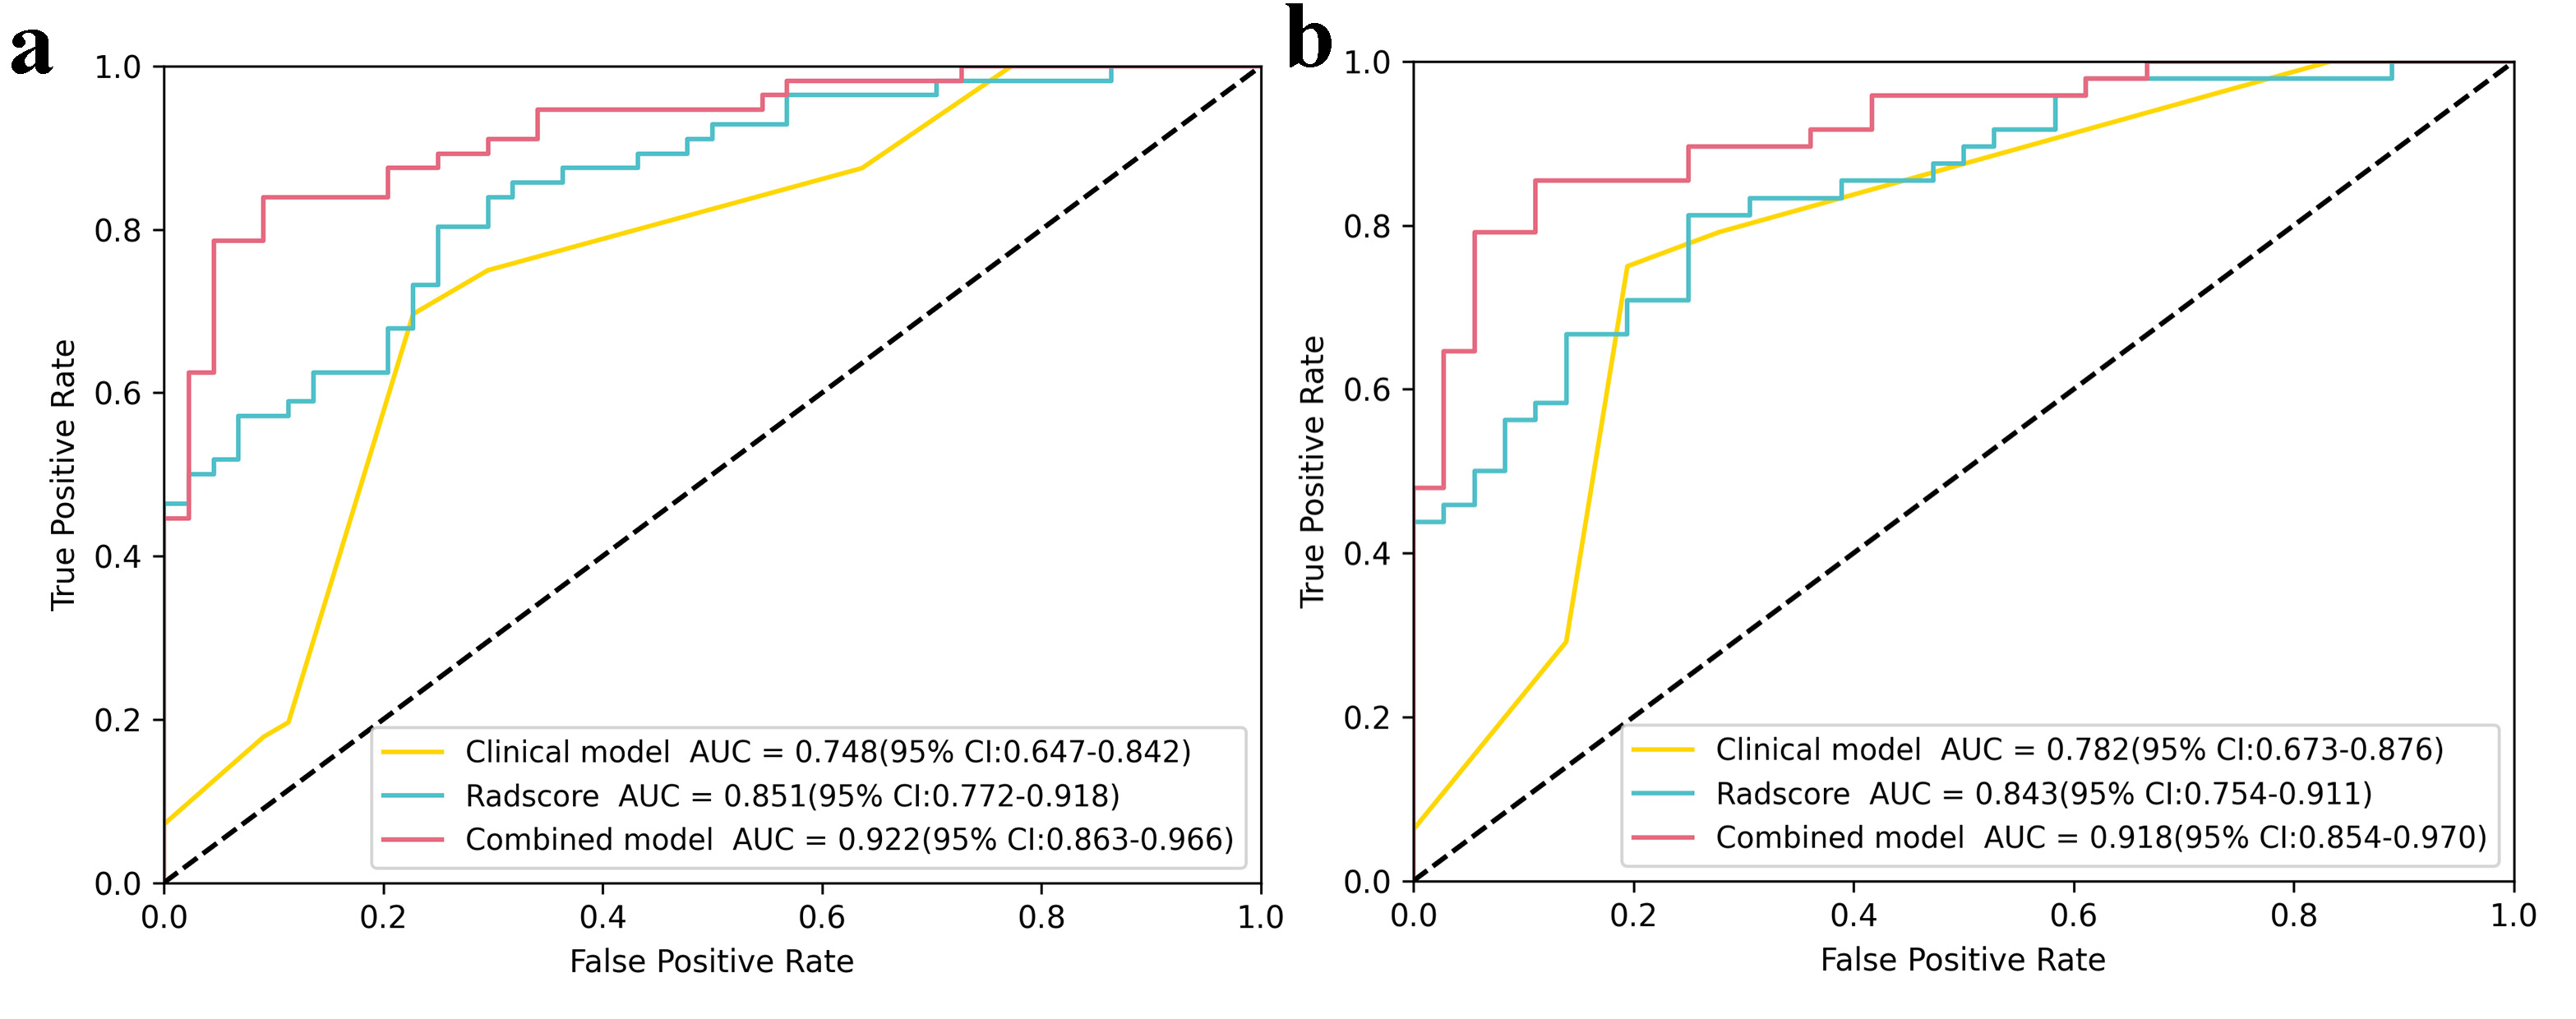
T stage (odds ratio [OR] = 0.335, P = 0.001) and enhancement degree (OR = 5.177, P = 0.003) were the independent clinical predictors for identifying NAC responders from non-responders. The clinical model was established using the above two factors. As is shown in Table 2, two, seven, and six radiomics features related to the sensitivity of NAC were selected from T1WI_CE, TIWI and T2WI_FS respectively by LASSO-logistic regression for Rad-Score calculation to build a radiomics model. As shown in Fig. 2, A nomogram for predicting NAC response was developed by integrating the Rad-Score, T stage, and enhancement degree. The ROC curves showed that the nomogram had the best predictive performance compared with clinical or radiomics models (AUC for training group: 0.922 vs. 0.748, 0.851; for testing group: 0.918 vs. 0.782, 0.843) (Fig.3), and there were significant differences in the AUCs between the nomogram and the other two models (Delong test, P < 0.05).Discussion and Conclusion
Our study revealed that the radiomics model based on Multi-parametric MR images exhibited favorable predictive efficacy. The nomograms developed by integrating radiomics features with clinical variables outperformed the clinical model alone. The AUCs of the radiomics model for detecting NAC response in the training and validation cohorts were 0.851 and 0.843, respectively, higher than the results reported by the previous studies (0.81 and 0.76) 5. This may be because that we extracted radiomics features from multiple MR images rather than from a single sequence. Therefore, the spatial heterogeneity of the tumor, which is closely correlated with the sensitivity of NAC, could be fully mined. Additionally, the addition of clinical factors to radiomics greatly improved the predictive performance of the nomogram in both the training and validation cohorts (AUCs: 0.922 vs. 0.851, 0.918 vs. 0.843, respectively) (Delong's test, P < 0.05), which was consistent with the results reported by Hu et al 5.In conclusion, the nomogram developed from multi-parametric MRI-based radiomics and clinical features could serve as a reliable tool for non-invasively predicting early response to NAC in NPC.Acknowledgements
This study was supported by grants from The Key Research and Development Program of Ningxia (No.2019BEG03033) and Natural Science Foundation of Ningxia(2022AAC03472).
Author contributions: conception and design: Zhuo Wang, Zhiqiang Chen; acquisition of data: Zhuo Wang, Shaoru Zhang, Xiaohua Chen, Yunshu Zhou, Shaoru Zhang, Shili Liu; Data analysis and interpretation: Zhiqiang Chen and Zhuo Wang; drafting the article and revising it critically for important intellectual content: Zhuo Wang; final approval of manuscript: all authors. The authors declare no conflicts of interest.
References
[1] Wang G, He L, Yuan C, et al. Pretreatment MR imaging radiomics signatures for response prediction to induction chemotherapy in patients with nasopharyngeal carcinoma. Eur J Radiol. 2018 Jan; 98:100-106. doi: 10.1016/j.ejrad.2017.11.007.
[2] Liao H, Chen X, Lu S, et al. MRI-Based Back Propagation Neural Network Model as a Powerful Tool for Predicting the Response to Induction Chemotherapy in Locoregionally Advanced Nasopharyngeal Carcinoma. J Magn Reson Imaging. 2022 Aug;56(2):547-559. doi: 10.1002/jmri.28047.
[3] Liu W, Yu B, Luo Y, et al. Survival benefit of induction chemotherapy for locally advanced nasopharyngeal carcinoma: prognosis based on a new risk estimation model. BMC Cancer. 2021 May 29;21(1):639. doi: 10.1186/s12885-021-08381-8.
[4] Zhao L, Gong J, Xi Y, et al. MRI-based radiomics nomogram may predict the response to induction chemotherapy and survival in locally advanced nasopharyngeal carcinoma. Eur Radiol. 2020 Jan;30(1):537-546. doi: 10.1007/s00330-019-06211-x.
[5] Hu C, Zheng D, Cao X, et al. Application Value of Magnetic Resonance Radiomics and Clinical Nomograms in Evaluating the Sensitivity of Neoadjuvant Chemotherapy for Nasopharyngeal Carcinoma. Front Oncol. 2021 Nov 1; 11:740776. doi: 10.3389/fonc.2021.740776.
Figures
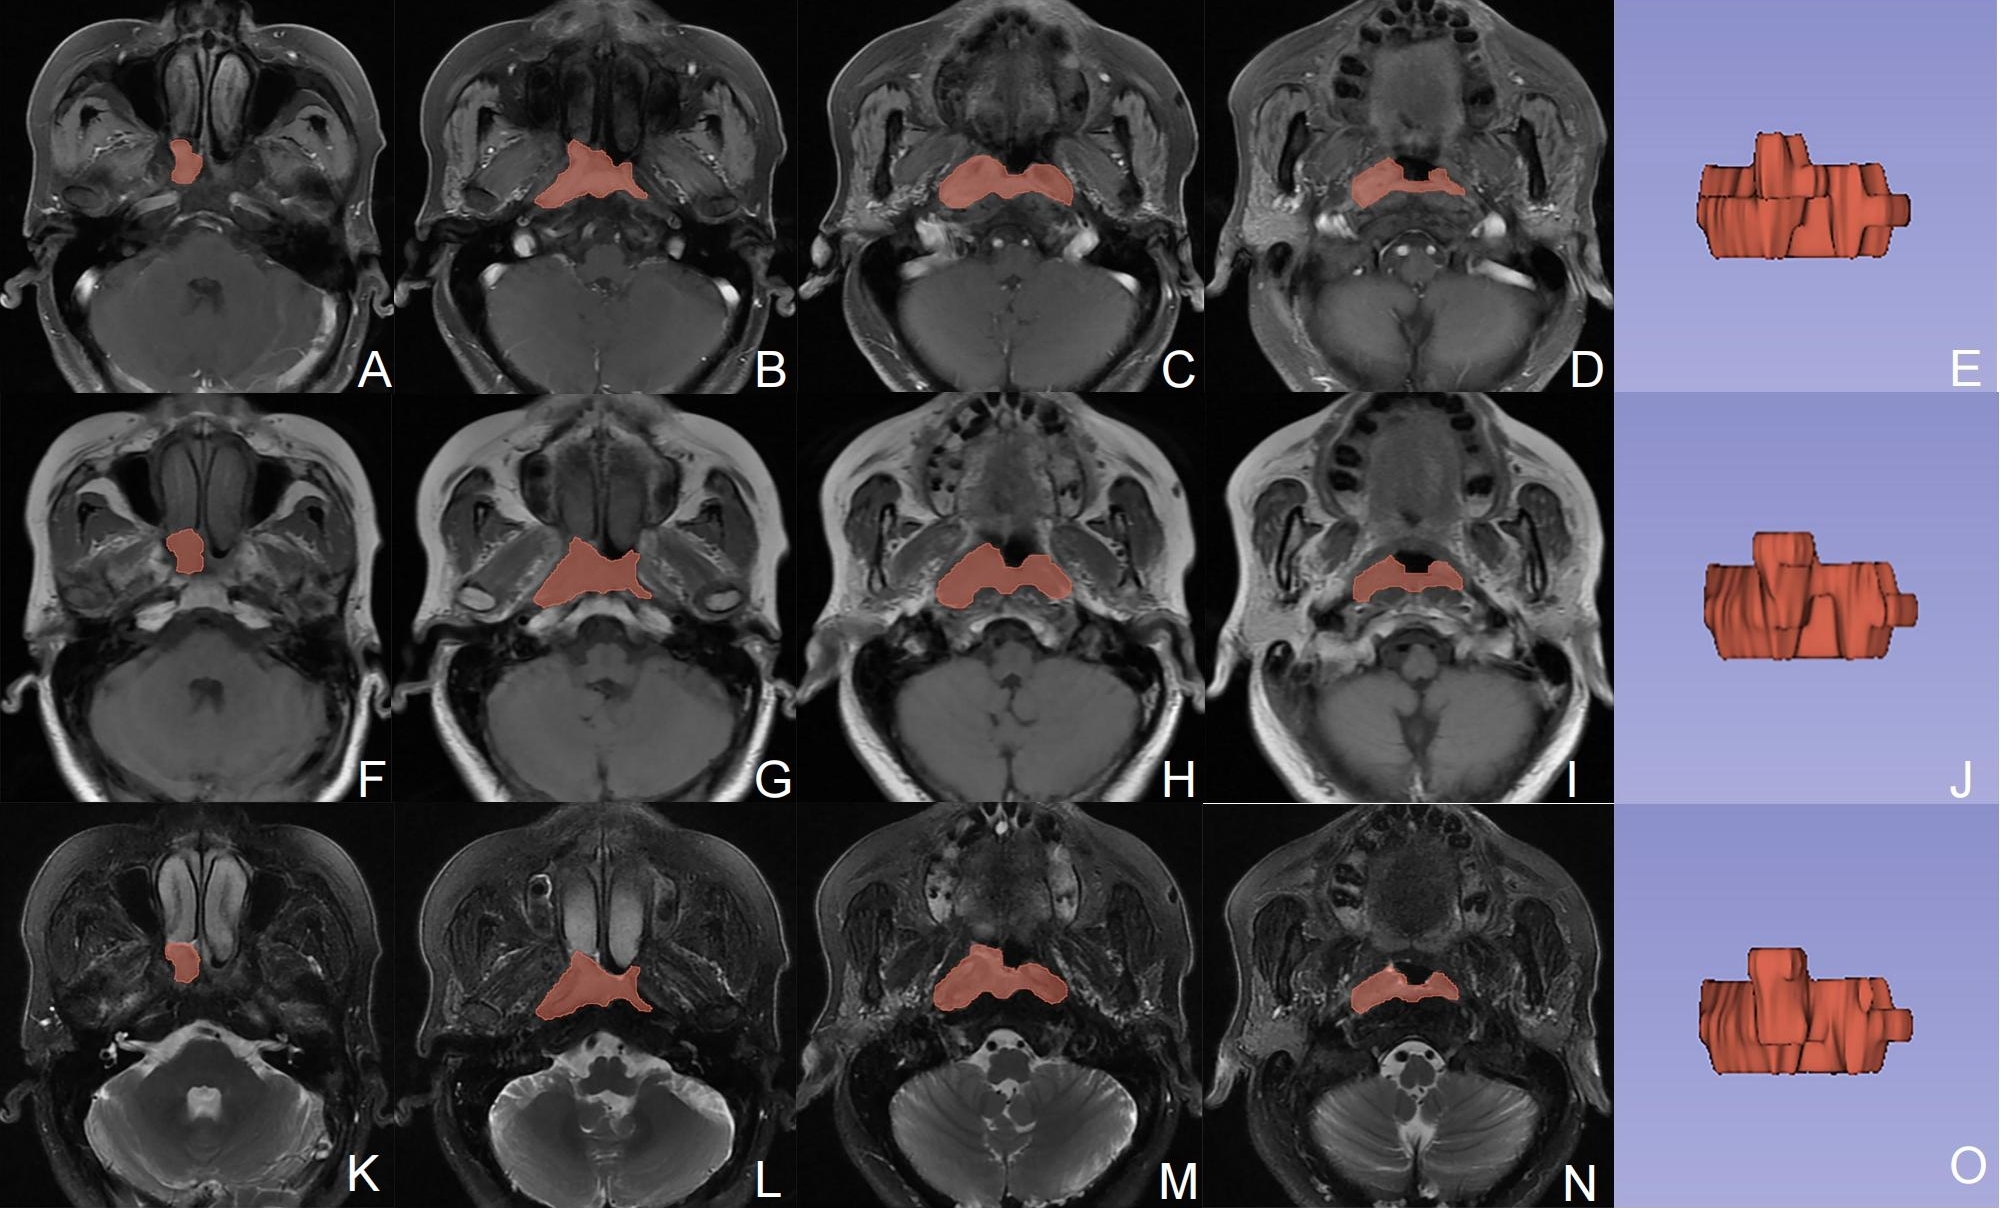
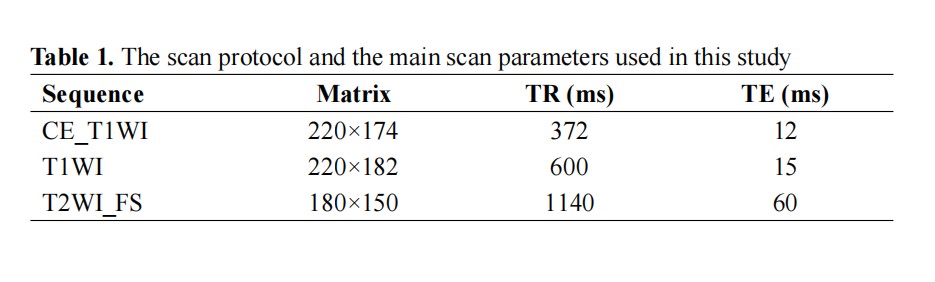
Abbreviation: CE_T1WI: contrast-enhanced T1-weighted imaging, T1WI, T1-weightedImaging, T2WI_FS, T2-weighted fast suppressed.
Field of view (FOV): 220 × 220 mm2, slice thickness/gap: 5/1 mm; all images were collected in transverse view.