4743
A neural network to estimate the hip center of rotation for a fully-automated range of motion analysis in femoroacetabular impingement.
Eros Montin1,2, Daniele Panozzo3, and Riccardo Lattanzi1,2,4
1Center for Advanced Imaging Innovation and Research (CAI2R) Department of Radiology, Radiology Department, New York University Grossman School of Medicine, New York, New York, USA, New York, NY, United States, 2Bernard and Irene Schwartz Center for Biomedical Imaging, Department of Radiology, New York University Grossman School of Medicine, New York, New York, USA, New York, NY, United States, 3New York University, New York, New York, USA, BROOKLYN, NY, United States, 4Vilcek Institute of Graduate Biomedical Sciences, New York University Grossman School of Medicine, New York, New York, USA, New York, NY, United States
1Center for Advanced Imaging Innovation and Research (CAI2R) Department of Radiology, Radiology Department, New York University Grossman School of Medicine, New York, New York, USA, New York, NY, United States, 2Bernard and Irene Schwartz Center for Biomedical Imaging, Department of Radiology, New York University Grossman School of Medicine, New York, New York, USA, New York, NY, United States, 3New York University, New York, New York, USA, BROOKLYN, NY, United States, 4Vilcek Institute of Graduate Biomedical Sciences, New York University Grossman School of Medicine, New York, New York, USA, New York, NY, United States
Synopsis
Keywords: Machine Learning/Artificial Intelligence, Joints
We evaluated three neural network architectures for the automatic identification of the center of the femur head on 3D water-only Dixon MRI. We trained using a mixture of real and augmented data. The mean error of the best-performing network was three-time lower compared to a manual annotation and on the order of 1 voxel. We combined the network to create the first fully automated pipeline to assess the hip range of motion from 3D MR.Introduction
Femoroacetabular impingement (FAI) is a pathological condition of the hip joint characterized by an abnormal shape of the bones that results in cartilage erosion from contact between the acetabular rim and femoral head-neck junction during hip motion[1-3]. Computed Tomography (CT) has been used to create patient-specific simulation models to determine the contact points during hip motion and assess the joint range of motion (ROM)[3]. However, CT results in potentially harmful ionizing radiations in the pelvis area[4]. It has been recently shown that CT could be replaced by magnetic resonance imaging (MRI)[3], by means of a 3D Dixon-based pulse sequence that enables the automatic segmentation of bones[4,5]. All previous approaches need user intervention to identify the center of the femur head (CFH), which is commonly used as the center of rotation of the joint. This study focused on the development of a neural network to automatically find the CFH, with the overall goal of creating a fully automated pipeline for the evaluation of hip ROM (Figure 1).Material and Methods
For this study, we used data from 40 hip joints (left and right) of 17 patients (13F/4M,37.1±5.7years), who underwent an MRI examination before arthroscopic surgery. Three patients had a follow-up MRI after one year. The study was approved by the IRB. The exam included a 3D Dixon MRI of the pelvis [8], acquired with a FOV = 320x320 mm2,320x320 matrix size,1 mm slice thickness without gap, centered on the patient's pelvis. The femur and acetabulum were automatically segmented using a pre-trained U-Net network[5,6] on the water-only Dixon images and the results were checked by an expert radiologist. After that, the CFH of each joint was estimated as the center of a sphere fitted in a semi-automatic way to a 3D mesh of the femoral head using an ad-hoc script(Figure 2). The obtained CFH was assumed as the ground truth for training. For comparison, the CFH also annotated manually the MRI data by clicking a point on an axial section through the femoral head. Images, segmented regions of interest (ROIs), and the CFH coordinates were used to train three variations of a LeNET architecture (Figure 3) with an input size of 80x80x80 voxels. The first architecture (LeNET) takes as input the images and the ROIs and gives as output an array with three values representing the CFH coordinates x, y, and z. The second architecture (LeNETv1) takes as input the images while the ROIs are concatenated after the first convolution so that the segmentation becomes one of the feature maps of the network for the second convolutional layer and the same output of LeNET. The third one (LeNET3) has the same input as LeNET, but gives three outputs, each with a scalar value representing the three coordinates (x,y,z) of the CFH. The 40 hip datasets were randomly subdivided into 30 (15 patients) training sets and 10 validation sets. Images and ROIs were normalized by their maximum and resized to a field of view of 80x80x80 mm3 and 80x80x80 voxels to fit the network input. All three networks were trained using 320 Epochs, batch size = 16, Adam optimizer (lr 0.001), and the mean of the Euclidean distance of CFH as a loss. Every batch was composed of 4 real and 12 augmented datasets. The latter was created on the fly by transforming the MRI, ROIs, and CFH coordinates using 6 rototranslations randomly selected from a uniform distribution ranging between ±5 degrees for the two first Euler’s angles (left/right axes and anterior/posterior), ±15 for the (inferior/superior) and ±5 mm for translations.Results
Figure 4 shows that LeNET and LeNETv1 had a median error of fewer than 1 mm2 while the performance of LeNET3 was significantly worse (p<0.01). In particular, the mean error for LeNET over the 10 validation data was 0.95 mm(±0.43 mm), for LeNETv1 was 1.11 mm(±0.66 mm), and for LeNET3 was 40.01 mm (±0.01 mm).Discussion
Among the proposed networks, LeNET had the best performance. Less than 1 mm is comparable to the spatial resolution of the images and considerably better than the error obtained by manually selecting the CFH on MRI slices, which was more than 2.9 mm(±1.44). In the example in Figure 5, the femur and acetabulum are automatically segmented from the water-only Dixon images of a representative patient[5], a 3D mesh of the bones is generated, LeNET identifies the CFH, which is used as the center of rotation to simulate the hip ROM buy detecting collisions between the head-neck junction of the femur and the rim of the acetabulum. The final ROM is estimated statistically by repeating the analysis 100 times while uniformly varying the CFH coordinates by 1 mm in space, to reliably overcome the average error of the LeNET network.Conclusion
Despite the limited number of data available, this work demonstrates that it is possible to automatically estimate the CFH to create an automatic pipeline for the 3D simulation of the hip ROM using MRI data. In future work, we will increase the number of training data to further improve the accuracy of the CFH estimation and indirectly the reliability of the ROM assessment.Acknowledgements
his work was supported by NIH R01 AR070297 and performed under the rubric of the Center for Advanced Imaging Innovation and Research (CAI2R, www.cai2r.net), an NIBIB National Center for Biomedical Imaging and Bioengineering (NIH P41 EB017183).References
- Griffin, D. R., Dickenson, E. J., O’Donnell, J., Agricola, R., Awan, T., Beck, M., Clohisy, J. C., Dijkstra, H. P., Falvey, E., Gimpel, M., Hinman, R. S., Hölmich, P., Kassarjian, A., Martin, H. D., Martin, R., Mather, R. C., Philippon, M. J., Reiman, M. P., Takla, A., … Bennell, K. L. (2016). The Warwick Agreement on femoroacetabular impingement syndrome (FAI syndrome): An international consensus statement. British Journal of Sports Medicine, 50(19), 1169–1176. https://doi.org/10.1136/bjsports-2016-096743
- Naili, J. E., Stålman, A., Valentin, A., Skorpil, M., & Weidenhielm, L. (2021). Hip joint range of motion is restricted by pain rather than mechanical impingement in individuals with femoroacetabular impingement syndrome. Archives of Orthopaedic and Trauma Surgery. https://doi.org/10.1007/s00402-021-04185-4
- Lerch, T. D., Degonda, C., Schmaranzer, F., Todorski, I., Cullmann-Bastian, J., Zheng, G., Siebenrock, K. A., & Tannast, M. (2019). Patient-Specific 3-D Magnetic Resonance Imaging–Based Dynamic Simulation of Hip Impingement and Range of Motion Can Replace 3-D Computed Tomography–Based Simulation for Patients With Femoroacetabular Impingement: Implications for Planning Open Hip Preservation Surgery and Hip Arthroscopy. American Journal of Sports Medicine, 47(12),
- Wylie JD, Jenkins PA, Beckmann JT, Peters CL, Aoki SK, Maak TG. Computed Tomography Scans in Patients With Young Adult Hip Pain Carry a Lifetime Risk of Malignancy. Arthroscopy. 2018 Jan;34(1):155-163.e3. doi: 10.1016/j.arthro.2017.08.235. PMID: 29100768.
- Montin, E., Deniz, C. M., Rodrigues, T. C., Gyftopoulos, S., Kijowski, R., ; Lattanzi, R. (2022). Automatic segmentation of the hip bony structures on 3D Dixon MRI datasets using transfer learning from a neural network developed for the shoulder. 30th Scientific Meeting of the International Society for Magnetic Resonance in Medicine (ISMRM) London (UK), 07-12 May 2022, 1412.
- Cantarelli Rodrigues, T., Deniz, C. M., Alaia, E. F., Gorelik, N., Babb, J. S., Dublin, J.,; Gyftopoulos, S. (2020). Three-dimensional MRI Bone Models of the Glenohumeral Joint Using Deep Learning: Evaluation of Normal Anatomy and Glenoid Bone Loss. <i>Radiology: Artificial Intelligence</i>, <i>2</i>(5), e190116. https://doi.org/10.1148/ryai.2020190116
Figures
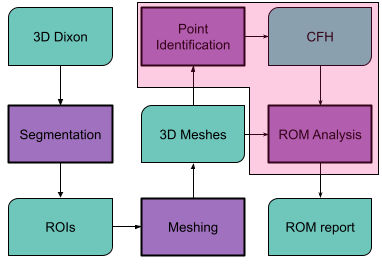
Workflow of a fully automatic pipeline for the estimation of the hip ROM from MRI. The Dicom images of the water-only Dixon dataset are processed to automatically segment the femur and acetabulum. The two resulting ROIs are then separately reconstructed into 3D meshes, and the CFH is extracted from the femur ROI. The CFH is used as the center of rotation of the joint to analyze the hip ROM. The magenta box highlights the parts automatized in this work.
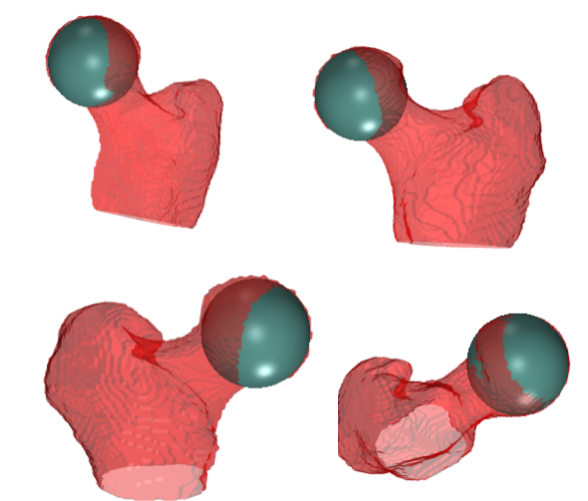
A representative example of a sphere fitted to the head of the femur to estimate the coordinates of its center (CFH), which were then used as input to train the neural networks. We used a semiautomated method to fit a sphere to the femur head, which consisted in clicking 4 points on the surface of the femoral head in axial, sagittal, and coronal views. The CFH was set at the center of the sphere.
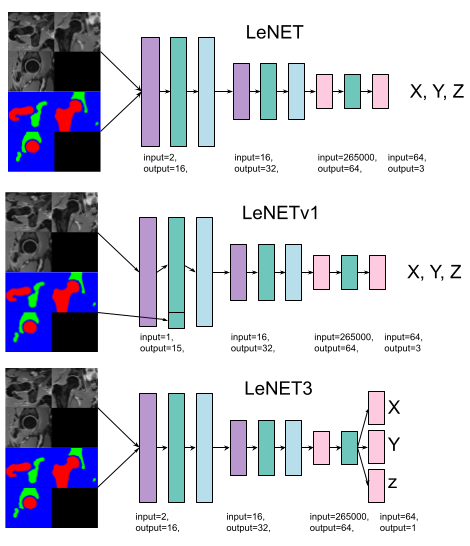
The three network architectures that we considered in the study. Violet boxes represent 3D convolutional blocks, green boxes leakyReLU with a slope equal to 0.1, light blue boxes max-pooling blocks with stride and kernel equal to 2, and pink ones are single-layer feed-forward network blocks.Images and ROIs were to a volume of 512 cm^3 (80x80x80 mm) and normalized to their maximum value.
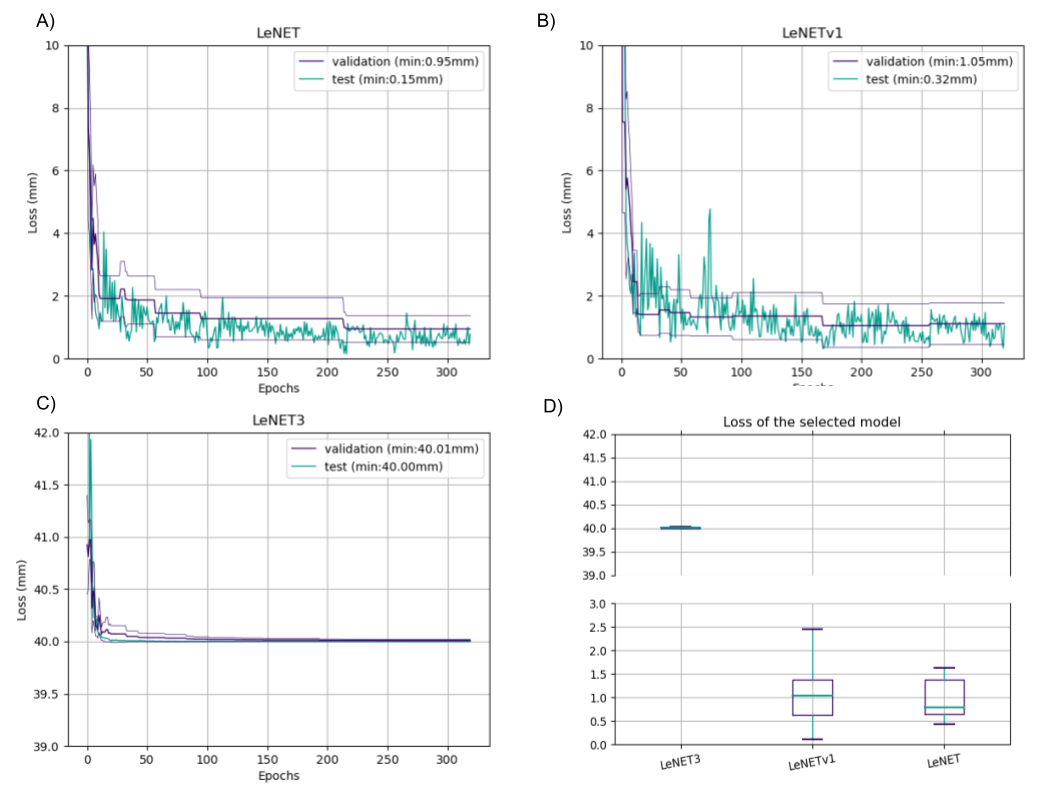
The results for the 3 networks. LeNET had the best performance with an error on the validation data of 0.95 mm (±0.43 mm)
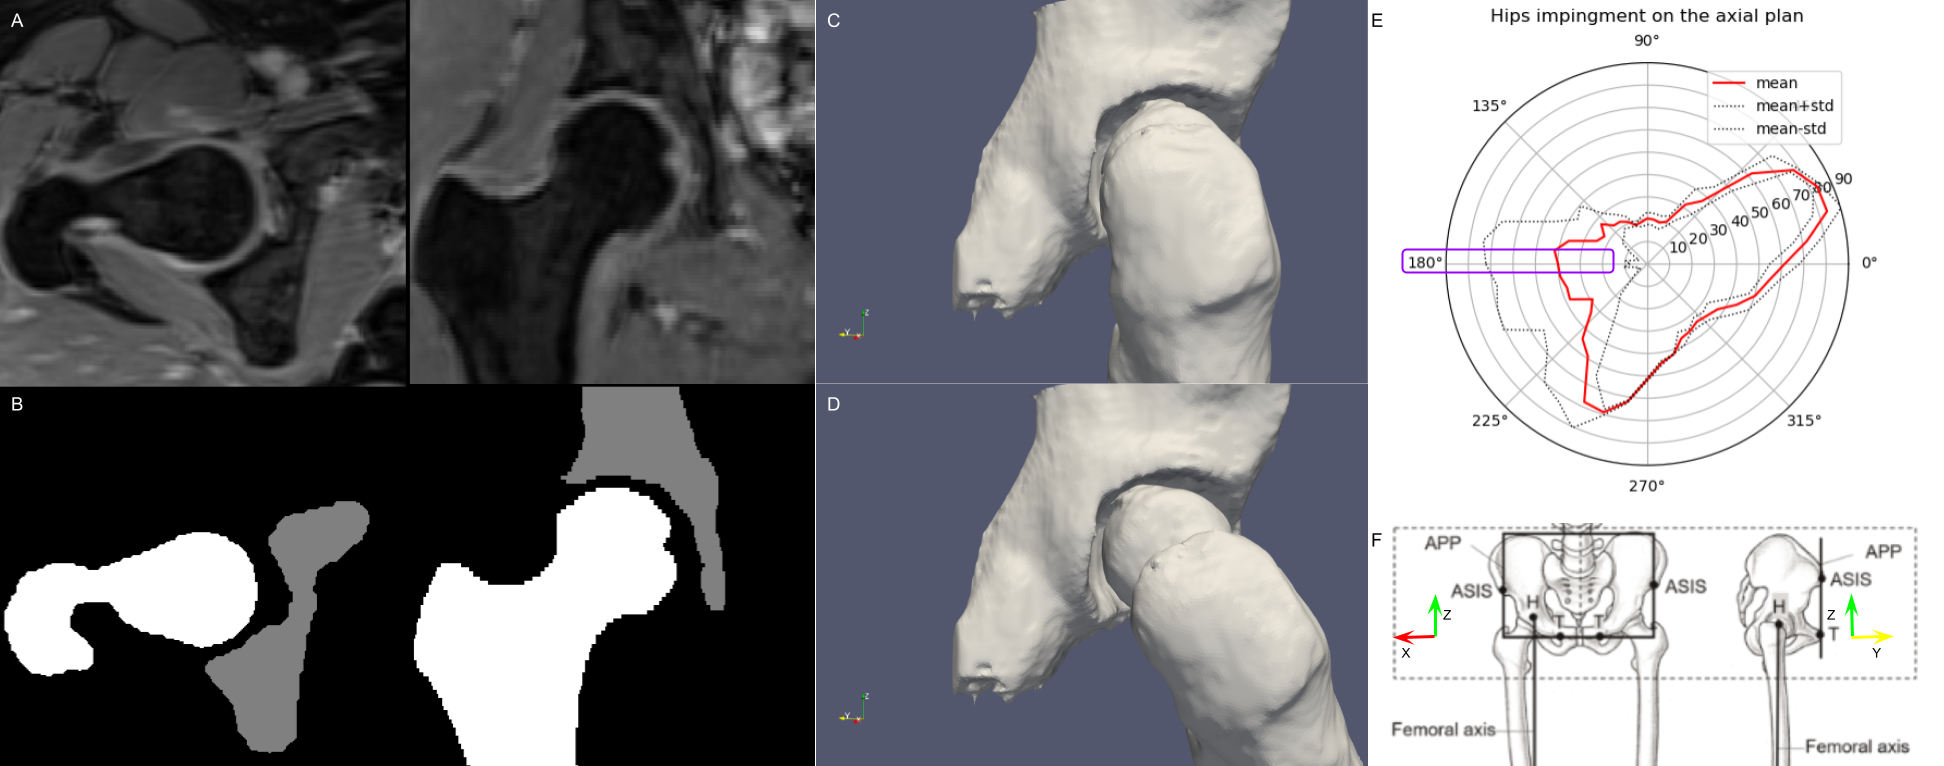
An example of the pipeline presented in the abstract. A and B show the input Dixon images and the result of automatic segmentation, respectively. C shows the 3D model of the hip in the neutral position, whereas D shows the impingement position in a representative rotation (25 deg). In E, every point in the red line represents the mean of the maximum angle reached when rotating the femur along a particular direction. The results of the analysis are highlighted for hip flexion, corresponding to the 180 degrees direction on the axial plane (X, Y), according to the coordinates space defined in F.
DOI: https://doi.org/10.58530/2023/4743