4741
Distinction of True-Progression from Pseudo-progression in Glioblastomas using ML Model based on Quantitative mpMRI and Molecular Signatures1Centre for Biomedical Engineering, Indian Institute of Technology, Delhi, India, 2Departments of Radiology, Perelman School of Medicine at the University of Pennsylvania, Philadelphia, PA, United States, 3Department of Electrical Engineering, Indian Institute of Technology, Delhi, India, 4Yardi School of Artificial Intelligence, Indian Institute of Technology, Delhi, India, 5Clinical Pathology and Laboratory, Perelman School of Medicine at the University of Pennsylvania, Philadelphia, PA, United States, 6Neurosurgery, Perelman School of Medicine at the University of Pennsylvania, Philadelphia, PA, United States, 7Medicine, Perelman School of Medicine at the University of Pennsylvania, Philadelphia, PA, United States, 8Department of Molecular and Clinical Cancer Medicine, University of Liverpool, United Kingdom, Liverpool, United Kingdom, 9Department of Biomedical Engineering, All India Institute of Medical Sciences, New Delhi, India
Synopsis
Keywords: Machine Learning/Artificial Intelligence, Brain
Glioblastoma patients (n=93) exhibiting enhancing lesions within 6 months after completion of standard therapy underwent anatomical imaging, diffusion and perfusion MRI. The median values of parameters (MD, FA, CL, CP, CS and rCBV) were computed from the enhancing regions. O6-methylguanine-DNA-methyltransferase (MGMT) promoter methylation status was available from 75 patients. Subsequently, these patients were classified as TP (n=55) or PsP (n=20). The data were randomly split into training and testing sets. The best model for differentiating TP from PsP was obtained using quadratic SVM classifier with a training accuracy of 90.9%, cross-validation accuracy of 85.5% and testing accuracy of 85%.Introduction
Pseudoprogression (PsP) refers to treatment-related clinico-radiologic changes mimicking true progression (TP) that occurs in patients with glioblastoma (GBM), predominantly within the first 6 months after the completion of surgery and concurrent chemoradiation therapy (CCRT) with temozolomide.1,2 Accurate differentiation of TP from PsP is essential for making informed decisions on appropriate therapeutic intervention as well as for prognostication of these patients.3,4 Using quantitative and physiologic MRI techniques, some studies have reported a threshold value from one parameter5,6 or a combination of a few parameters7,8 in distinguishing TP from PsP with variable success. On the other hand, radiomics approach utilizing supervised machine learning provides rich diagnostic information from MRI data which is beyond the capabilities of human interpretation, thus offering improved discriminatory power for binary classification.9 This study was conducted with a hypothesis that radiomics features derived from diffusion tensor imaging (DTI) and dynamic susceptibility contrast (DSC)-perfusion-weighted imaging (PWI) along with molecular signatures will facilitate distinction of TP from PsP with high accuracy.Methodology
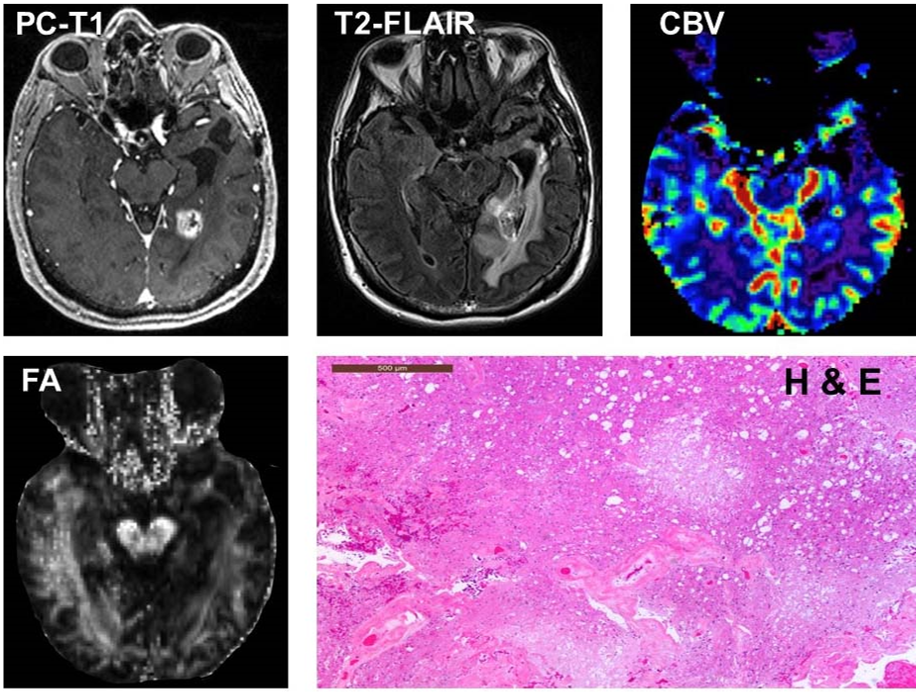
A cohort of 93 patients with GBM exhibiting enhancing lesions within 6 months after completion of CCRT was included retrospectively. These patients underwent anatomical imaging, DTI and DSC-PWI on a 3T magnet. Patients harboring methylated O6-methylguanine-DNA-methyltransferase (MGMT) promoters are associated with more favorable prognosis and survival outcomes than those with unmethylated genotype.10 In the current study, MGMT status was available from 75 patients. Therefore, the final data analysis was performed from these 75 patients. Subsequently, these patients were classified as TP (n=55) or PsP (n=20) based on histological features obtained from tumor specimens following repeat surgery or mRANO criteria.11 Pixel-wise mean diffusivity (MD), fractional anisotropy (FA), coefficient of linear anisotropy (CL), planar anisotropy (CP), and spherical anisotropy (CS) maps from DTI and leakage-corrected cerebral volume (CBV) maps were generated from DSC-PWI using methods described previously.12,13 The DTI derived maps, CBV maps, and T2-FLAIR images were resliced and co-registered to post-contrast T1-weighted images. A semiautomatic approach was used to segment the contrast-enhancing regions of each lesion by using a signal intensity-based thresholding method. The median values of DTI metrics (MD, FA, CL, CP, and CS) from the enhancing regions were computed. The CBV values from the enhancing regions were normalized by corresponding values from contralateral normal white matter regions to obtain relative CBV (rCBV). The top 90th percentile rCBV values were also measured from the enhancing regions and were reported as rCBVmax. To address the issue of imbalance sample size between two groups (TP and PsP), synthetic-minority-oversampling-technique (SMOTE) was applied to augment the PsP cases from 20 to 35 resulting in a total sample size of 110. Random forest approach was applied to compute the feature importance. The data were randomly split into training (n=90) and testing (n=20) sets. Based on feature importance, feature selection was performed with a sequential forward feature selection (SFFS) approach. The 6-fold cross-validation approach was applied to training dataset for confirming our findings. To develop a robust prediction model in distinguishing TP from PsP, several machine learning classifiers [K-nearest neighbours (KNN), logistic regression (LR), support vector machine (SVM), RF, and neural networks (NN)] were employed. Different parameters and hyperparameters corresponding to different considered models were also optimized.Results
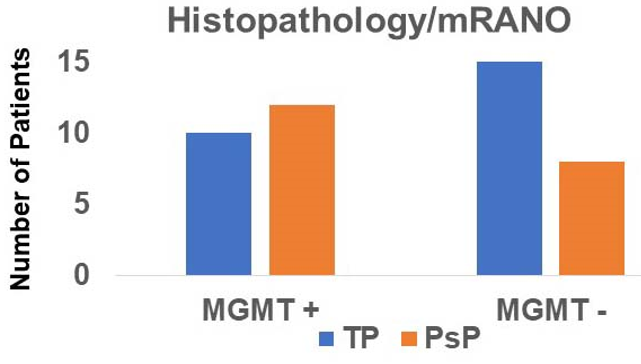
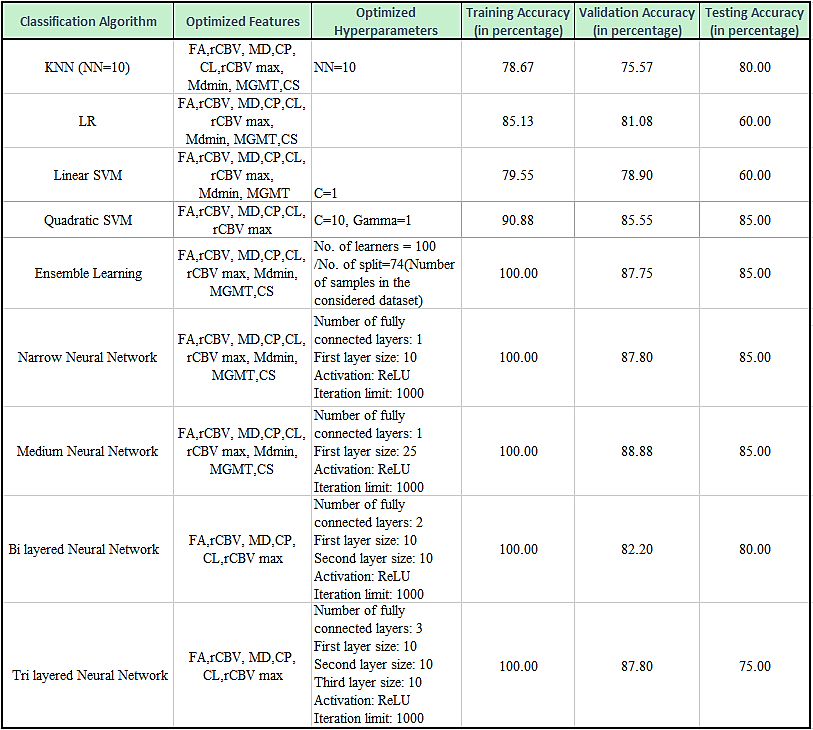
The presentative anatomical images, FA, CBV and histopathological images from each of TP and PsP patients are shown as figures 1 and 2, respectively. Bar plots (Figure 3) show that the frequency of GBMs harboring MGMT promotor methylation status was significantly higher in PsP than in TP (p<0.01). The Best nine diagnostic performances of multiple machine learning algorithms, and feature selection modules are presented in Table 1. The medium neural network classifier provided the best discriminatory power in distinguishing TP from PsP with a training accuracy of 100%, cross-validation accuracy of 88.9% and testing accuracy of 85%. To avoid the issue of data overfitting, quadratic SVM classifier was selected to build the predictive model in distinguishing TP from PsP with a training accuracy of 90.9%, cross-validation accuracy of 85.5% and testing accuracy of 85%.Discussion
We developed an operator independent, and automated machine learning based predictive model by capturing physiologic MRI based features from contrast enhancing regions of neoplasms in distinguishing TP from PsP in GBM patients treated with CCRT. Our findings revealed that RF and NN (medium, bilayered and trilayered) classifiers provided better discriminatory accuracies than other classifiers; however, RF and NN classifiers were constrained by data overfitting problems. On other hand, quadratic SVM was least limited by data overfitting and provided high discriminatory accuracies from training and testing data sets. Some studies have shown potential of radiomic signatures, derived from diffusion and perfusion MRI in differentiating between TP and PsP.14-17 While most of these studies used only apparent diffusion coefficient (ADC), a single parameter derived from diffusion MRI, we comprehensively analyzed DTI data and computed several tensor-based indices. Our work is also an extension of these previous studies by the fact that we used molecular information as obtained from MGMT status in addition to quantitative MRI parameters to develop a prediction model in the present study.Conclusion
Machine learning using quantitative multi-parametric MRI and molecular signatures may be a promising approach to differentiate TP from PsP in GBMs.Acknowledgements
Authors acknowledge the funding support from SERB, DST (project number: CRG/2019/005032).
References
1. Chawla S, Bukhari S, Afridi OM, Wang S, Yadav SK, Akbari H, Verma G, Nath K, Haris M, Bagley S, Davatzikos C, Loevner LA, Mohan S. Metabolic and physiologic magnetic resonance imaging in distinguishing true progression from pseudoprogression in patients with glioblastoma. NMR Biomed. 2022 Jul;35(7):e4719.
2. Thust SC, van den Bent MJ, Smits M. Pseudoprogression of brain tumors. J Magn Reson Imaging. 2018;48(3):571–589.
3. Roldan GB, Scott JN, McIntyre JB, et al. Population-based study of pseudoprogression after chemoradiotherapy in GBM. Can J Neurol Sci. 2009;36: 617–622.
4. Rossignol J, Srinageshwar B, Dunbar GL. Current therapeutic strategies for glioblastoma. Brain Sci. 2019;10(1):15.
5. Chu HH, Choi SH, Ryoo I, et al. Differentiation of true progression from pseudoprogression in glioblastoma treated with radiation therapy and concomitant temozolomide: comparison study of standard and high-b-value diffusion-weighted imaging. Radiology. 2013;269:831–840.
6. Lee WJ, Choi SH, Park CK, et al. Diffusion-weighted MR imaging for the differentiation of true progression from pseudoprogression following concomitant radiotherapy with temozolomide in patients with newly diagnosed high-grade gliomas. Acad Radiol. 2012;19:1353–1361.
7. Prager AJ, Martinez N, Beal K, et al. Diffusion and perfusion MRI to differentiate treatment-related changes including pseudoprogression from recurrent tumors in high-grade gliomas with histopathologic evidence. Am J Neuroradiol. 2015;36:877–885.
8. Wang S, Martinez-Lage M, Sakai Y, et al. Differentiating tumor progression from pseudoprogression in patients with glioblastomas using diffusion tensor imaging and dynamic susceptibility contrast MRI. Am J Neuroradiol. 2016;37:28–36.
9. Aerts HJ, Velazquez ER, Leijenaar RT, et al. Decoding tumour phenotype by noninvasive imaging using a quantitative radiomics approach. Nat Commun. 2014;5:4006.
10. Brandes AA, Tosoni A, Franceschi E, et al. Recurrence pattern after temozolomide concomitant with and adjuvant to radiotherapy in newly diagnosed patients with glioblastoma: correlation with MGMT promoter methylation status. J Clin Oncol. 2009;27:1275–1279.
11. Ellingson BM, Wen PY, Cloughesy TF. Modified Criteria for Radiographic Response Assessment in Glioblastoma Clinical Trials. Neurotherapeutics. 2017 Apr;14(2):307–20.
12. Wang S, Kim S, Chawla S, et al. Differentiation between glioblastomas and solitary brain metastases using diffusion tensor imaging. Neuroimage. 2009;44:653–660.
13. Chawla S, Wang S, Mohan S, et al. Differentiation of brain infection from necrotic glioblastoma using combined analysis of diffusion and perfusion MRI. J Magn Reson Imaging. 2019;49:184–194.
14. Kim JY, Park JE, Jo Y, et al. Incorporating diffusion- and perfusion-weighted MRI into a radiomics model improves diagnostic performance for pseudoprogression in glioblastoma patients. Neuro Oncol. 2019;21:404–414.
15. Akbari H, Rathore S, Bakas S, et al. Histopathology-validated machine learning radiographic biomarker for noninvasive discrimination between true progression and pseudo-progression in glioblastoma. Cancer. 2020;126:2625–2636.
16. Hu X, Wong KK, Young GS, Guo L, Wong ST. Support vector machine multiparametric MRI identification of pseudoprogression from tumor recurrence in patients with resected glioblastoma. J Magn Reson Imaging. 2011 Feb;33(2):296-305.
17. Park JE, Ham S, Kim HS, Park SY, Yun J, Lee H, Choi SH, Kim N. Diffusion and perfusion MRI radiomics obtained from deep learning segmentation provides reproducible and comparable diagnostic model to human in post-treatment glioblastoma. Eur Radiol. 2021 May;31(5):3127-3137.
Figures