4738
Deep learning tools to aid the evaluation of isthmic spondylolysis
Vadim Malis1, Suraj Achar2, Dosik Hwang3, and Won C. Bae1,4
1Radiology, University of California, San Diego, La Jolla, CA, United States, 2Family Medicine, University of California, San Diego, La Jolla, CA, United States, 3Electrical and Electronics Engineering, Yonsei University, Seoul, Korea, Republic of, 4VA San Diego Healthcare System, San Diego, CA, United States
1Radiology, University of California, San Diego, La Jolla, CA, United States, 2Family Medicine, University of California, San Diego, La Jolla, CA, United States, 3Electrical and Electronics Engineering, Yonsei University, Seoul, Korea, Republic of, 4VA San Diego Healthcare System, San Diego, CA, United States
Synopsis
Keywords: Machine Learning/Artificial Intelligence, Bone, UTE, Deep Learning, Image Regression, Saliency Map
Isthmic spondylolysis results in fracture of pars interarticularis of the lumbar spine in young athletes. UTE MRI provide good bone contrast, although CT is still the gold standard. To take UTE MRI further, we developed supervised deep-learning tools to generate CT-like images and saliency maps of fracture probability from UTE MRI and CT, using ex vivo preparation of cadaveric spines. The results demonstrate feasibility of CT-like images to provide easier interpretability for bone fractures, due to improved image contrast and CNR, and the saliency maps to aid in quick detection of pars fracture by providing visual cues to the reader.PURPOSE
Isthmic spondylolysis,1 characterized by bone stress injury to the lumbar spine at pars interarticularis during sports,2, 3 is found in nearly half of adolescent athletes with persistent low back pain.2, 4-9 For clinical evaluation computed tomography (CT) current gold standard with sensitivity of ~90%.10 MRI is preferrable but it has ~20% lower sensitivity compared to CT.11-13 We have recently shown that ultrashort echo time (UTE) MRI marked improves the depiction of experimental spondylolysis.14 Building upon UTE imaging, our goal was to develop deep-learning based tools to further aid in the evaluation of spondylolysis by providing CT-like contrast and saliency map of fracture probability.METHODS
In our past study,14 we obtained cadaveric lumbar spines (n=4; 3 female, 1 male, 54 ± 18 years) en bloc, with muscles intact. At randomly chosen sites of pars interarticularis, fractures were created with a surgical saw to simulate spondylolysis (Figure 1). Samples were scanned at 3-T (GE Discovery 750) with MRI in the sagittal plane with conventional SE T2 (Figure 2A; TR=4600 ms, TE=102 ms, matrix=224x224, slice=3 mm, FOV=24 cm, time=2:14 min); 3D UTE (Figure 2B; TR=40 ms, TE=0.03 ms, spokes=6,000; matrix=256x256, slice=2 mm, FOV=24 cm, FA=2 deg, time = 4:00 min). CT scan (Figure 2D) was performed on a 256-MDCT scanner (GE Revolution): 120 kV, 100 mA, slice=0.625 mm, reconstruction diameter=50 cm, and matrix=512x512.Deep learning: Image Regression: We built an convolutional neural network (CNN) based on 2D U-Net15 (Figure 12) to perform a supervised image-to-image regression. UTE images were normalized, augmented (random rotation, translation, scaling) and used as the input (Figure 3A). The model has 64 convolution filters with 3x3 kernel size, 2 convolution operations at each step, with an encoder depth of 5. The output is the CT-like image (Figure 3B), fitted using root mean squared error against registered CT image (Figure 3C) as the ground truth.
Saliency Mapping: Another CNN model was built for pars defect detection. We used the same architecture, except at the output end we uses a softmax activation followed by pixel classification layer instead of regression layer. For training, UTE images (Figure 5A) were annotated using ImageJ by segmenting regions of pars fractures as binary images (Figure 5B). After training, we visualized the activation or “saliency map” of the final convolution layer prior to softmax activation, which shows the probability of the presence of the pars defect (Figure 5C).
Contrast-to-Noise Ratio (CNR): To compare image contrast between UTE, CT-like, and CT images, CNR was be determined (Figure 3D) between the bone and the defect, and between the bone and the muscle at n=11 pars fractures.
RESULTS
CT-Like Image: Compared to conventional MRI (Figure 2A), UTE images depict spinal bone distinctly (Figure 2B), and when inverted (Figure 2C), has a similar appearance to a CT image (Figure 2D). Even so, UTE images had characteristics that may hinder the detection of spondylolysis: uneven shading from posterior surface coils, varying signal intensities from the soft tissues, and a relatively low contrast for bone.Compared to UTE images that depicted both the bone and the air in the vertebral body (Figure 3A, square) and the facet joint (arrowhead) with similarly low signal intensity, our CT-like image correctly depicted the bone with high signal intensity and the air with low signal intensity (Figure 3C). The correspondence between CT (Figure 3B) and CT-like (Figure 3C) images was excellent, but the CT-like image was not as sharp. The CT-like image also facilitated 3D rendering and visualization: The 3D bone renders of the CT (Figure 4A) and CT-like (Figure 4B) were nearly identical, and the fracture was obvious on both (arrows).
For the CNR (Figure 3D) of bone vs. defect, UTE had the lowest value at ~35+/-14 (mean+/-SD), followed by CT-like at 97+/-31 and CT at 146+/-37. These differences were statistically significant (repeated measures ANOVA, each p<0.001). Trends were similar for CNR of bone vs. muscle.
Saliency Mapping: To demonstrate the feasibility and usefulness of saliency mapping to aid the detection of pars defect, we performed supervised learning using UTE images as the input (Figure 5A) and annotated regions of pars defect (Figure 5B) as the ground truth, but instead of performing segmentation, we plotted the activation or “saliency map” (Figure 5C) of the final convolution layer, showing the probability of fracture as a heat map. The map can be overlaid onto any registered image to emphasize probable regions with pars defect. As a demonstration, we created a fused 3D render of CT-like data with the saliency map (Figure 5D), which clearly highlights the fractured pars.
CONCLUSION
These results demonstrate the feasibility of using deep learning models to generate CT-like images and saliency maps of fracture probability from UTE source images. CT-like images provide easier interpretability for bone fractures, due to improved image contrast and CNR. Saliency maps can aid in quick detection of pars fracture by providing visual cues to the reader. The present study is limited to the data from ex vivo samples, and additional work in human subjects with spondylolysis is crucial for effective utilization of UTE MRI and deep learning tools for evaluation of isthmic spondylolysis.Acknowledgements
No acknowledgement found.References
- Wiltse LL, Newman PH, Macnab I. Classification of spondylolisis and spondylolisthesis. Clin Orthop Relat Res: 23-29, 1976.
- Fredrickson BE, Baker D, McHolick WJ, Yuan HA, Lubicky JP. The natural history of spondylolysis and spondylolisthesis. J Bone Joint Surg Am 66: 699-707, 1984.
- Bechtel W, Griffiths H, Eisenstadt R. The Pathogenesis of Spondylolysis. Investigative radiology 17: S29, 1982.
- Micheli LJ, Wood R. Back pain in young athletes. Significant differences from adults in causes and patterns. Arch Pediatr Adolesc Med 149: 15-18, 1995.
- Olsen TL, Anderson RL, Dearwater SR, Kriska AM, Cauley JA, Aaron DJ, LaPorte RE. The epidemiology of low back pain in an adolescent population. Am J Public Health 82: 606-608, 1992.
- Selhorst M, MacDonald J, Martin LC, Rodenberg R, Krishnamurthy R, Ravindran R, Fischer A. Immediate functional progression program in adolescent athletes with a spondylolysis. Phys Ther Sport 52: 140-146, 2021.
- Soler T, Calderon C. The prevalence of spondylolysis in the Spanish elite athlete. Am J Sports Med 28: 57-62, 2000.
- Reitman CA, Gertzbein SD, Francis WR, Jr. Lumbar isthmic defects in teenagers resulting from stress fractures. Spine J 2: 303-306, 2002.
- Deyo RA, Weinstein JN. Low back pain. N Engl J Med 344: 363-370, 2001.
- Miller R, Beck NA, Sampson NR, Zhu X, Flynn JM, Drummond D. Imaging modalities for low back pain in children: a review of spondyloysis and undiagnosed mechanical back pain. J Pediatr Orthop 33: 282-288, 2013.
- West AM, d'Hemecourt PA, Bono OJ, Micheli LJ, Sugimoto D. Diagnostic Accuracy of Magnetic Resonance Imaging and Computed Tomography Scan in Young Athletes With Spondylolysis. Clin Pediatr (Phila) 58: 671-676, 2019.
- Yamane T, Yoshida T, Mimatsu K. Early diagnosis of lumbar spondylolysis by MRI. J Bone Joint Surg Br 75: 764-768, 1993.
- Ulmer JL, Mathews VP, Elster AD, Mark LP, Daniels DL, Mueller W. MR imaging of lumbar spondylolysis: the importance of ancillary observations. AJR Am J Roentgenol 169: 233-239, 1997.
- Finkenstaedt T, Siriwanarangsun P, Achar S, Carl M, Finkenstaedt S, Abeydeera N, Chung CB, Bae WC. Ultrashort Time-to-Echo Magnetic Resonance Imaging at 3 T for the Detection of Spondylolysis in Cadaveric Spines: Comparison With CT. Invest Radiol 54: 32-38, 2019.
- Ronneberger O, Fischer P, Brox T. U-Net: Convolutional Networks for Biomedical Image Segmentation. 234-241, Year.
Figures
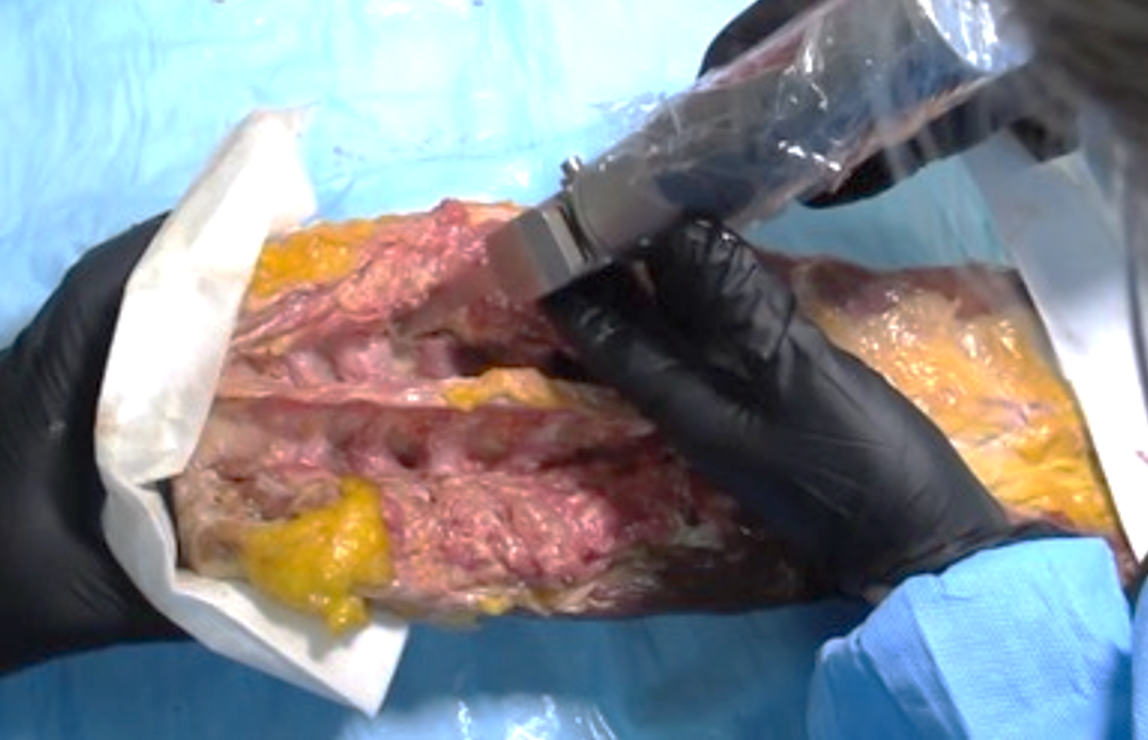
Figure 1. Experimental pars defect being created on a cadaveric lumbar spine with a bone saw.
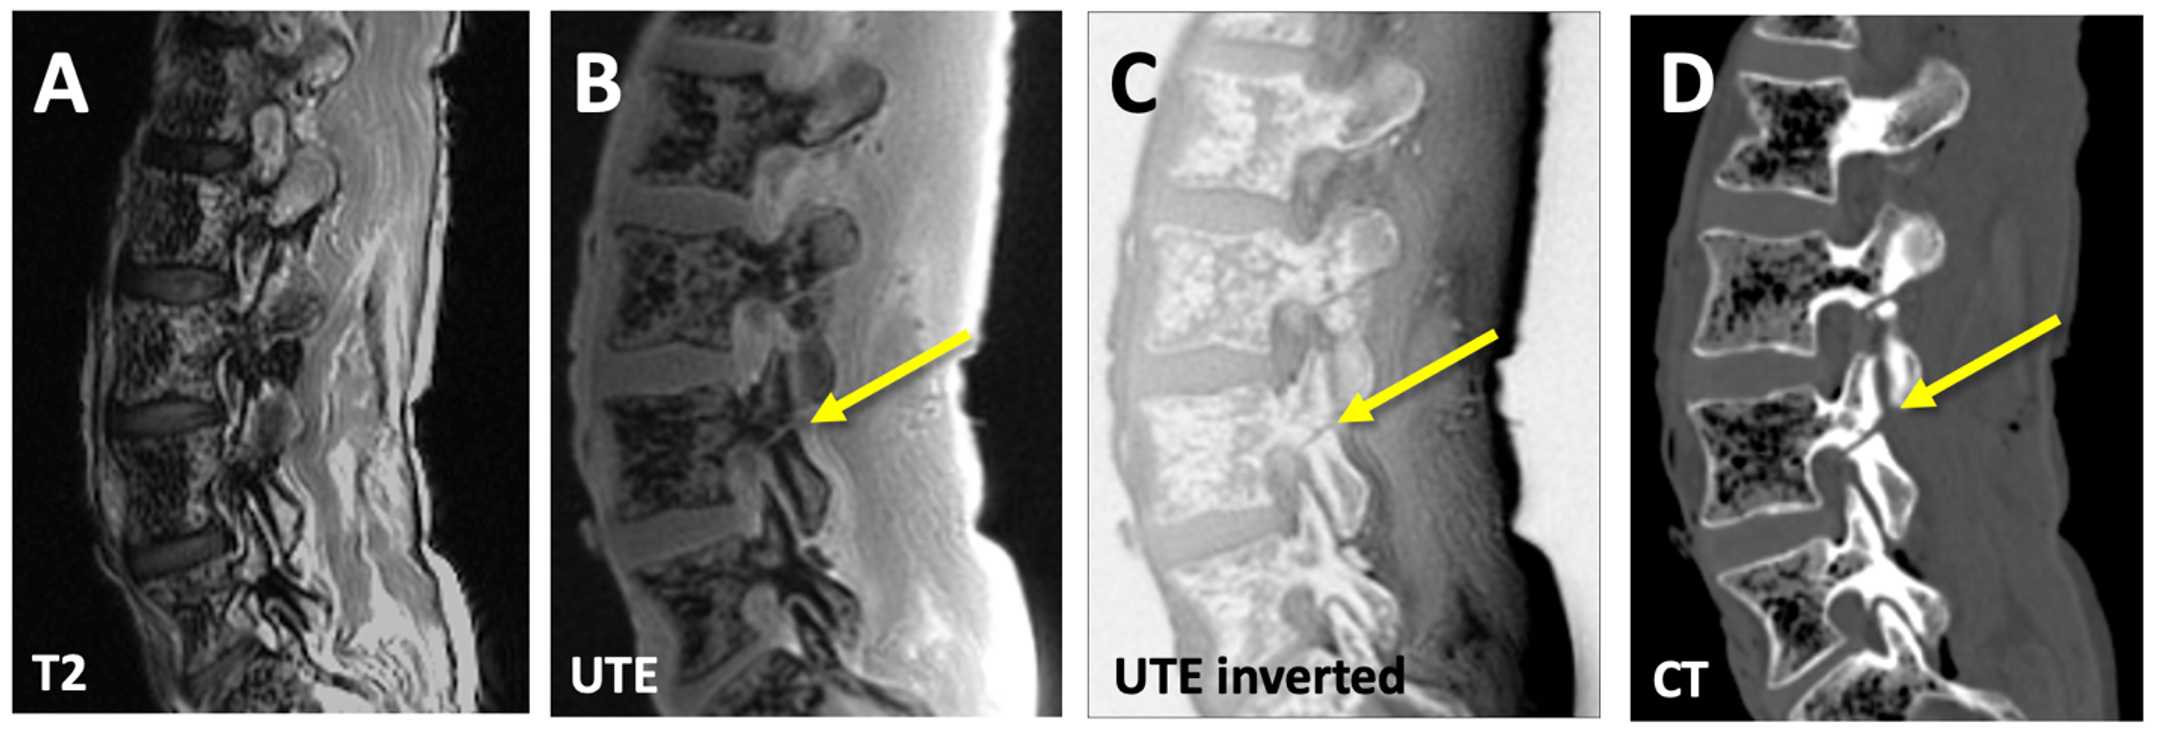
Figure 2. Right-sided imaging of a cadaveric spine, showing typical sagittal images of an experimental pars fracture at L4. On the conventional T2 images (A) the experimental pars defect on the right L5 level is not visible. In contrast, raw (B) and inverted (C) UTE images are able to depict the fracture (arrow), albeit with a lower contrast compared to the CT image (D).
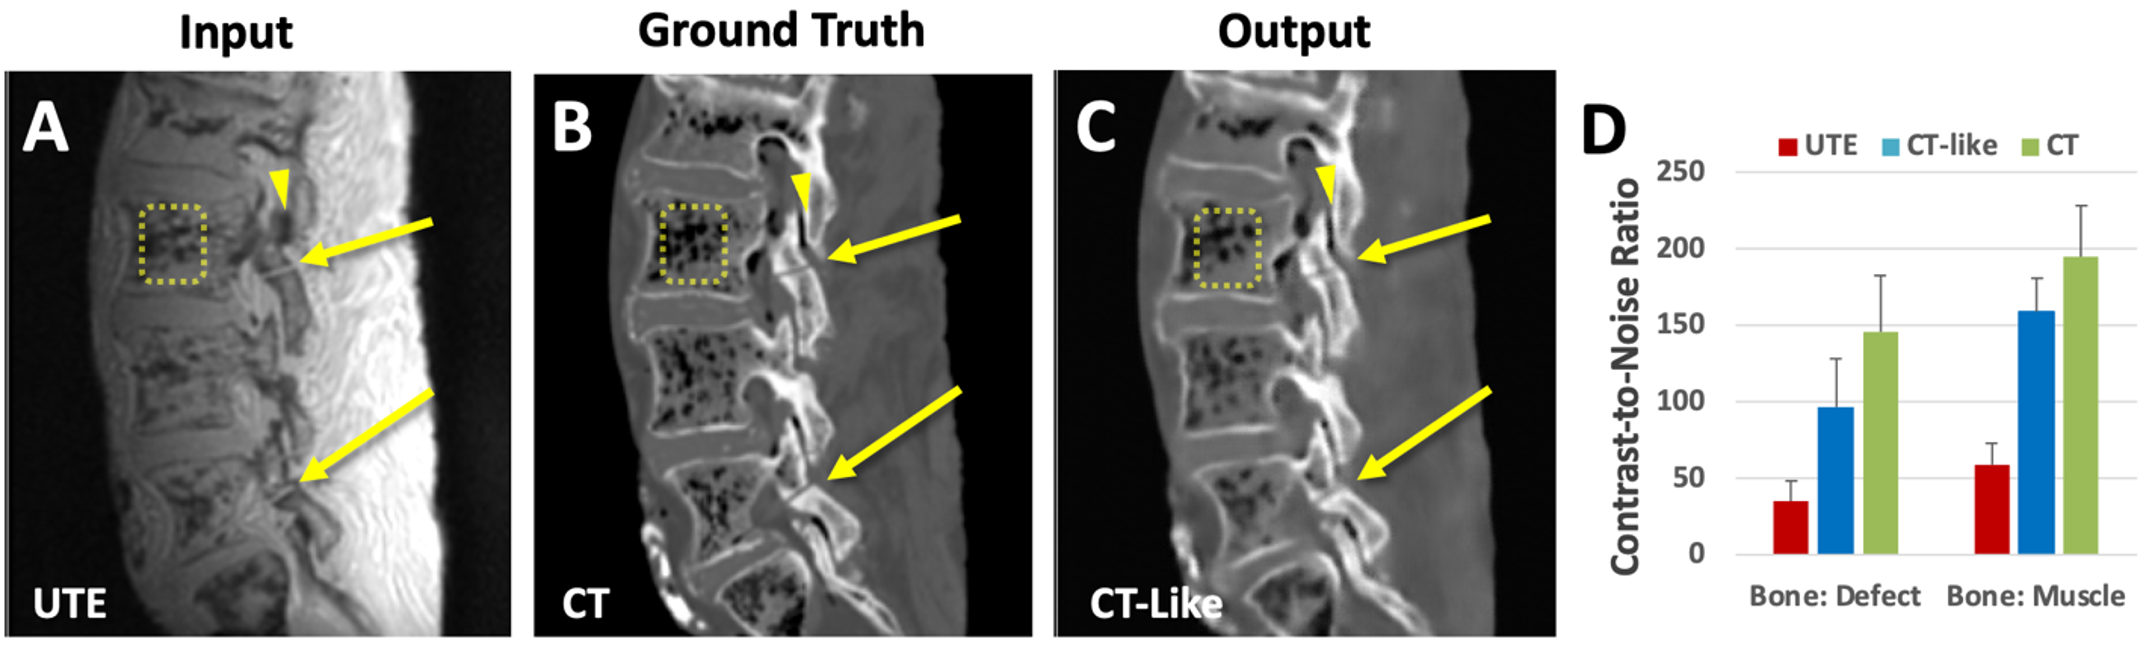
Figure 3. Regression of UTE images (A), trained on registered CT images at the ground truth (B), to CT-like images (C). Compared to UTE image (A) that depicted both the bone and air in the vertebral body (square) and facet joint (arrowhead) with low signal intensity, CT-like (B) and CT (C) images correctly depicted bone with high signal and the air with low signal intensity. (D) CNR measured on UTE, CT-like, and CT images.
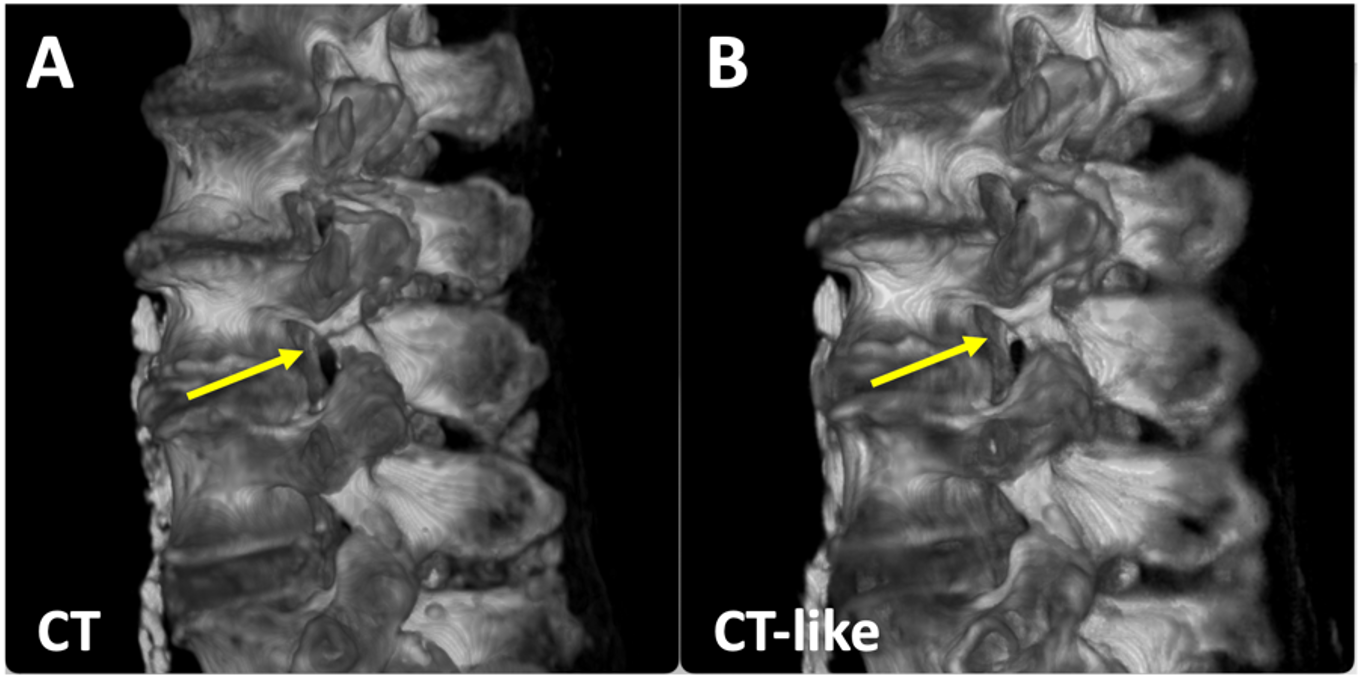
Figure 4. 3D bone renders of (A) CT and (B) CT-like datasets of a cadaveric spine showing the pars fracture (arrow).
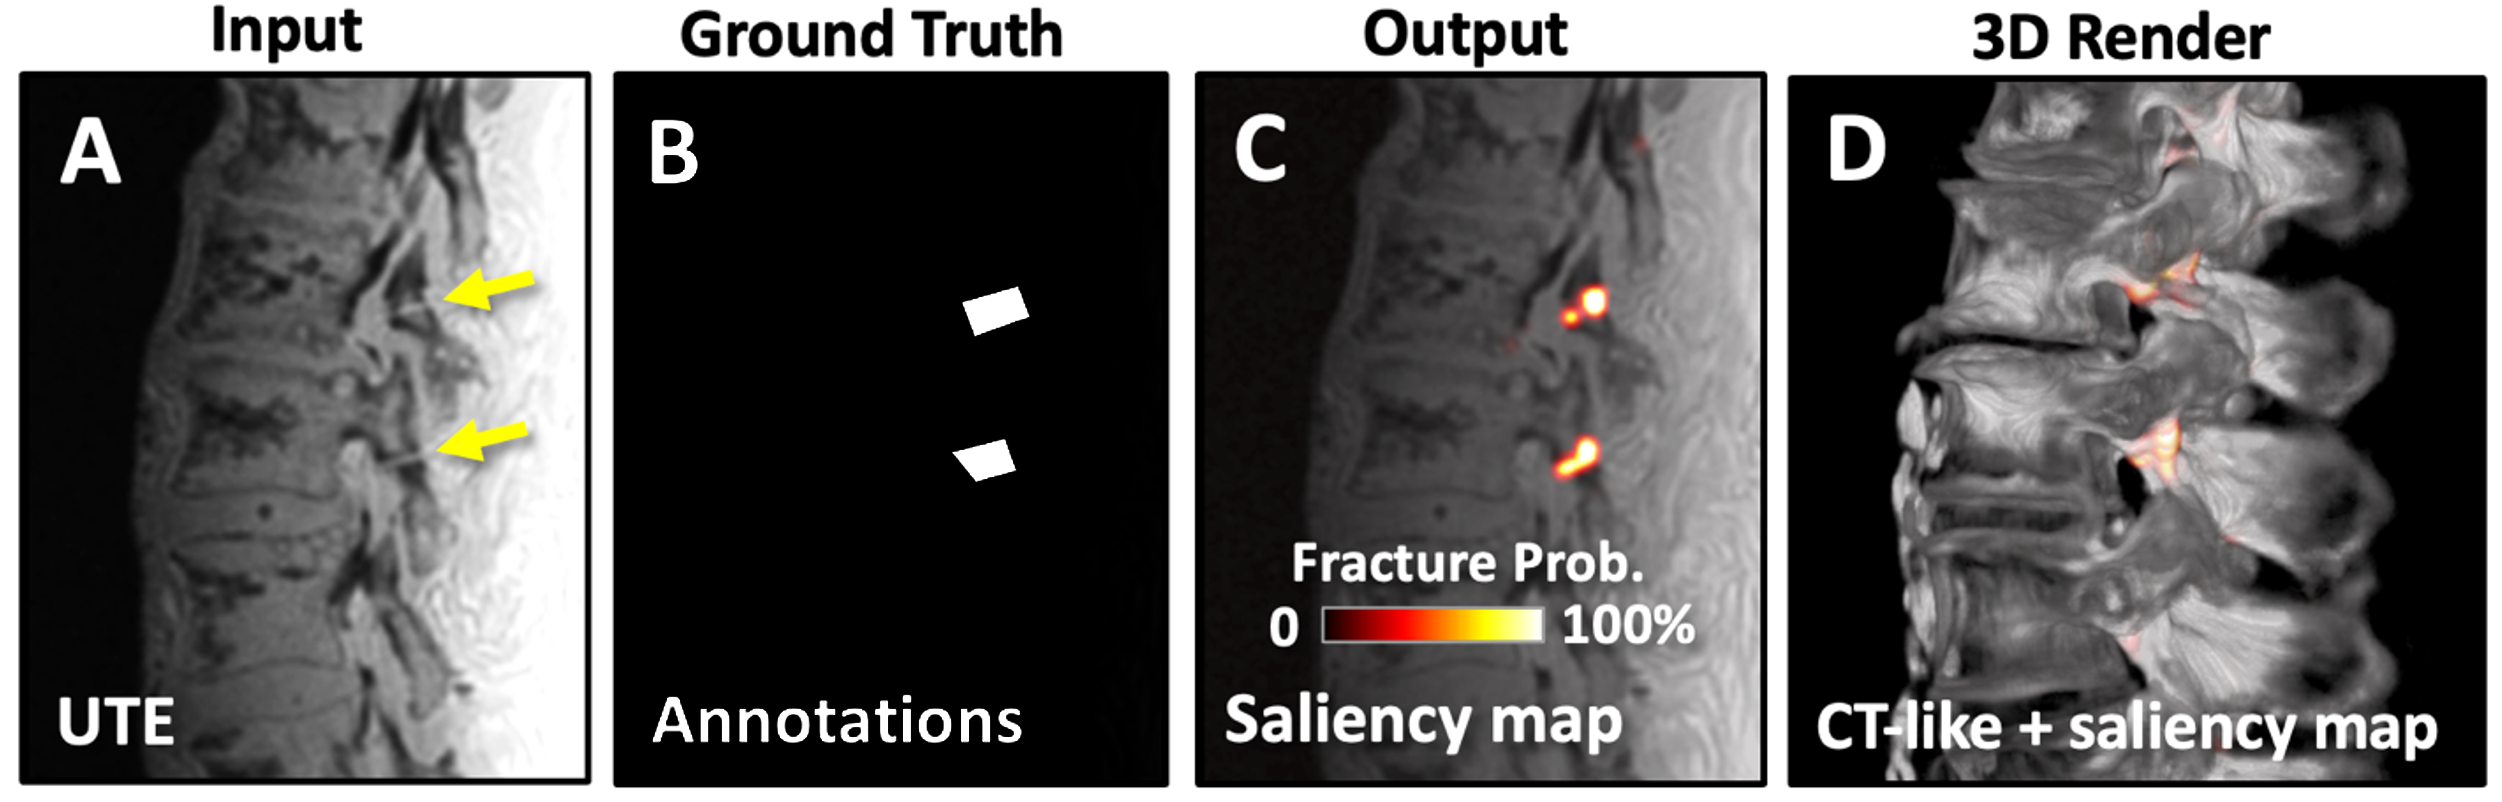
Figure 5. Deep learning model was trained using (A) UTE and (B) annotated images of the pars fracture (arrows) to generate (C) saliency maps showing the probability of pars fracture. (D) 3D fused rendering of CT-like and saliency map highlights the fractured areas.
DOI: https://doi.org/10.58530/2023/4738