4735
Conventional χ-separation compared to self calibrated method (BIOPHYSICSS-DL) with histological validation
Ilyes Benslimane1, Günther Grabner2, Simon Hametner3, Thomas Jochmann1,4, Robert Zivadinov1,5, and Ferdinand Schweser1
1Department of Neurology, Buffalo Neuroimaging Analysis Center, Buffalo, NY, United States, 2Department of Medical Engineering, Carinthia University of Applied Sciences, Klagenfurt, Austria, 3Department of Neuropathology and Neurochemistry, Medical University of Vienna, Vienna, Austria, 4Department of Computer Science and Automation, Technische Universität Ilmenau, Ilmenau, Germany, 5Department of Computer Science and Automation, Center for Biomedical Imaging, Clinical and Translational Science Institute at the University at Buffalo, Buffalo, NY, United States
1Department of Neurology, Buffalo Neuroimaging Analysis Center, Buffalo, NY, United States, 2Department of Medical Engineering, Carinthia University of Applied Sciences, Klagenfurt, Austria, 3Department of Neuropathology and Neurochemistry, Medical University of Vienna, Vienna, Austria, 4Department of Computer Science and Automation, Technische Universität Ilmenau, Ilmenau, Germany, 5Department of Computer Science and Automation, Center for Biomedical Imaging, Clinical and Translational Science Institute at the University at Buffalo, Buffalo, NY, United States
Synopsis
Keywords: Machine Learning/Artificial Intelligence, Brain
The χ-separation method determines para- and diamagnetic susceptibility tissue compartments correlating to iron and myelin in the brain respectively. The method presupposes subject invariant relaxometry coefficients and compartments disregarding the changes in those parameters in disease or postmortem cases. We implement a biophysically informed autoencoder network developed for single subject use (BIOPHYSICSS-DL) to determine underlying biophysical model coefficients from individual datasets. We expand the current model with different combinations of relaxometry and susceptibility data to produce a self-calibrated χ separation method finding the network comparable to standard methods for iron and predicts myelin distribution more closely to ground truth histology.Introduction
χ-separation is a recent method that receiving increased attention in the field of Quantitative Susceptibility Imaging (QSM). The method’s goal is the separation of paramagnetic (χ+, typically reflecting brain iron) and diamagnetic (χ-, typically myelin lipids) sources of tissue magnetic susceptibility.1,2 Several separation models have been proposed that combine QSM with R2* 3,4 or R2’ 4,5. These models rely on the opposite effects dia- and paramagnetic tissue components have on QSM. However, χ-separation makes a critical assumption that the proportionality coefficients relating tissue compartments to the MRI metrics are known a priori. Furthermore, the methods assume that the relaxation coefficients for para- and diamagnetic sources are identical.1,5,6 The first assumption is problematic for application in neurological diseases or postmortem tissues, where these coefficients are unknown and may be different between subjects, different brain regions or lesions. The second assumption is not supported by robust evidence.We previously introduced a neural network for self-calibrated χ-separation where the subject-specific proportionality coefficients are obtained directly from the data: BIOquantification through PHYSIcs-Constrained Single-Subject Deep Learning (BIOPHYSICSS-DL).7 In the present work, we systematically compared BIOPHYSICSS-DL to the conventional χ-separation method postmortem and in vivo.
Methods
BIOPHYSICSS-DL is an autoencoder-type network (Fig. 1) that decomposes a set of measured qMRI quantities {si} (input layer) into two sets of hidden parameters by the end of the encoder step: (i) biological tissue parameters {cj} and (ii) function parameters {pj} that determine the biophysical relationships that produce the transform {cj}→{si}. Two independent, fully connected networks were used as encoders for the prediction of {cj} and {pj}. To ensure an overdetermined problem, an additional a priori input parameter σ enables dependence on tissue type (e.g., white/gray matter) sharing values of {pj} between similar voxels. The decoder part of the network then is the analytically defined function families. The architecture can be trained on data from a single-subject exam without ground truth or a priori data of the underlying tissue content or the biophysical signal relationships.7R1, R2*, and QSM mapping of a cadaver head was performed in situ at 7T. The extracted and formalin-fixed brain was stained for iron and myelin using diaminobenzidine-enhanced Turnbull blue and Luxol fast blue-periodic acid Schiff, respectively. qMRI maps were manually co-registered to the stains. A volunteer was scanned using an hMRI protocol8 at 3T and reconstructed R1 and R2* using the hMRI tool,9 and QSM using HEIDI.10
Conventional χ-separation (model i) was performed analytically using the model proposed in Ref. 4 (r+ = r- = ± 262 Hz/ppm at 3T and adjusted ± 611 Hz/ppm for 7T). Network predicted χ-separation was set up with the following three models (ii-iv): (ii) Using conventional χ-separation inputs R2* and QSM (s1 and s2) with two source compartments (cFe and cMyl), first-order function families, and self-calibrating coefficients {pj} determined by the network. (iii) The same model as in (ii) but with R1 instead of R2*. (iv) The same model as in (ii) but with R1, R2*, and QSM and with second order function families. Compared to models (ii) and (iii), model iv is mathematically overdetermined. We trained the corresponding networks (ADAM,11 TensorFlow 2.2.0; NVIDIA GeForce RTX 2080 Ti) separately on the postmortem and in vivo qMRI data.
Results
The analytical χ-separation method (model i) produced similar effects (Fig. 2 top right) to those presented in recent literature, including hypointense DGM and anisotropy/orientation effects. BIOPHYSICSS-DL training completed after 20 minutes (5000 epochs; converged loss). In the postmortem data (Fig. 2), the self-calibrated method (model ii) produced residual iron signal in the myelin map. R1-QSM approach (model iii) accurately reproduced the myelin stains, and the iron map was closer to the histology than models (i) or (ii). Model (iv) results were qualitatively similar to model iii but were obtained consistently. Voxel-wise correlations (Fig. 3) demonstrate that model (iv) had comparable iron predictions to conventional χ separation but more accurate predictions of myelin when compared to the ground truth histology. Iron laden structures are preserved and distinguished in the model iv iron prediction such as the optical radiation and subcortical U-fibers as compared to model i (arrows in Fig. 4). Myelin prediction was significantly improved in DGM for model iv (Fig. 3) showing hypointense regions in the caudate, thalamus, and globus pallidus. (Fig. 4) In vivo results (Fig. 5) qualitatively reproduced postmortem outcomes, except for model iii. Inclusion of both R2* and R1 was required (model iv) to improve WM contrast on the iron map and produce a myelin map that resembled postmortem myelin histology.Discussion and Conclusion
Our study showed limited performance of conventional χ-separation in estimating myelin and iron, potentially due to insufficient data from R2* and QSM alone, the simplistic model, or the pre-determined coefficient r+/-. Network predicted χ-separation yielded slightly improved separation using R1 and instead of R2*, but iron contrast remained in the myelin maps. The limited performance in these models (ii and iii) may be explained by underdetermination of the mathematical problem. Using R1, R2*, and QSM (overdetermined) resulted in highly accurate myelin and improved iron maps although stains were neither used for training nor inference. Rapid clinical translation of the presented method may be achieved with sequences like MP2RAGEME.12Acknowledgements
Research reported in this publication was partially supported by the National Institute Of Neurological Disorders And Stroke of the National Institutes of Health under Award Number R01NS114227, the National Center for Advancing Translational Sciences of the National Institutes of Health under Award Number UL1TR001412, and by an equipment grant from Canon Medical Systems Corporation and Canon Medical Research USA, Inc. The content is solely the responsibility of the authors and does not necessarily represent the official views of the funding agencies. Furthermore, the research was supported by the Free State of Thuringia within the ThiMEDOP project (2018 IZN 0004) with funds of the European Union (EFRE), the Free State of Thuringia within the thurAI project (2021 FGI 0008), the German Academic Exchange Service (DAAD PPP 57599925), and an ISMRM Research Exchange Grant awarded to T.J.References
[1] Shin, H.-G. et al. (2021). Χ-separation: Magnetic susceptibility source separation toward iron and myelin mapping in the brain. NeuroImage, 240, 118371. [2] Chen, J. et al (2021). Decompose quantitative susceptibility mapping (QSM) to sub-voxel diamagnetic and paramagnetic components based on gradient-echo MRI Data. NeuroImage, 242, 118477. [3] Schweser, F., Deistung, A., Lehr, B. W., Sommer, K. & Reichenbach, J. R. SEMI-TWInS: Simultaneous Extraction of Myelin and Iron using a T2*-Weighted Imaging Sequence. in Proc ISMRM 19 (2011) p120. [4] Emmerich, J. et al. (2021). On the separation of susceptibility sources in quantitative susceptibility mapping: Theory and Phantom validation with an in vivo application to multiple sclerosis lesions of different age. Journal of Magnetic Resonance, 330, 107033. [5] Dimov, AV, Nguyen, TD, Gillen, KM, Marcille, M, Spincemaille, P, Pitt, D, et al. Susceptibility source separation from gradient echo data using magnitude decay modeling. Journal of Neuroimaging. 2022; 1– 8. https://doi.org/10.1111/jon.13014 [6] Dimov AV et al. Magnetic Susceptibility Source Separation Solely from Gradient Echo Data: Histological Validation. Tomography. 2022; 8(3):1544-1551. [7] Benslimane I., Grabner G., Hametner S., Jochmann T., Zivandinov R., Schweser F. Beyond qMRI: Biological tissue properties from single-subject unsupervised deep learning with theoretical signal constraints [abstract]. In ISMRM.; May 2022 London [8] Leutritz, Tobias et al. 2020. Multiparameter Mapping of Relaxation (R1, R2*), Proton Density and Magnetization Transfer Saturation at 3 T: A Multicenter Dual-Vendor Reproducibility and Repeatability Study. Human Brain Mapping 41(15):4232–47. [9] Tabelow, K. et al. 2019. hMRI – A toolbox for quantitative MRI in neuroscience and clinical research. Neuroimage 194, 191-210. [10] Schweser F, Sommer K, Deistung A, Reichenbach JR. Quantitative susceptibility mapping for investigating subtle susceptibility variations in the human brain. Neuroimage. 2012 Sep;62(3):2083-100. doi: 10.1016/j.neuroimage.2012.05.067. [11] D. P. Kingma and J. Ba, Adam: A Method for Stochastic Optimization, Dec. 2014. [12] Caan MWA, Bazin PL, Marques JP, de Hollander G, Dumoulin SO, van der Zwaag W. MP2RAGEME: T1 , T2* , and QSM mapping in one sequence at 7 tesla. Hum Brain Mapp. 2019 Apr 15;40(6):1786-1798. doi: 10.1002/hbm.24490.Figures
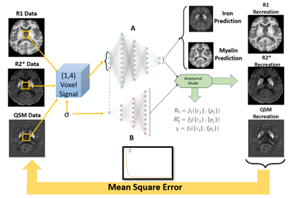
Figure 1. Sub-network A (main inversion network) takes as input a voxel’s
parametric data (here: R1, R2*, QSM) and the a priori ROI index (σ). The σ value is also the sole input in network B
(model parameter network). The network's latent space outputs the
biological properties {ci} (from A) as well as the model parameters
{pi} (from B). The forward simulation is performed in a biophysical
model layer that defines the function families based on analytically determined signal models. The root mean square error is used to determine the training loss to drive network prediction.
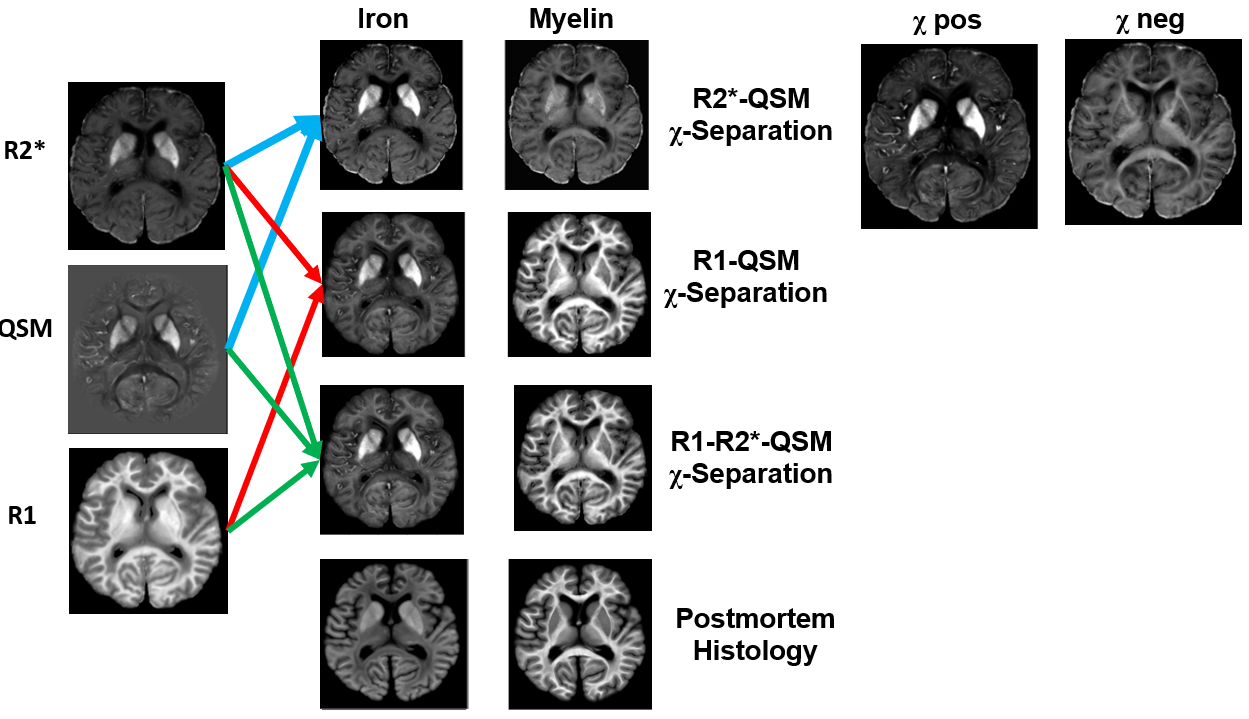
Figure 2. Postmortem results of χ separation models. MRI parameters maps are shown on the left. Conventional
χ-separation maps are shown in the top right. Arrows indicate model ii
(blue), model iii (red), and model iv (green). The ground truth
stains are shown for comparison at the bottom. Scatterplots show correlation
between model iv and ground truth stains.
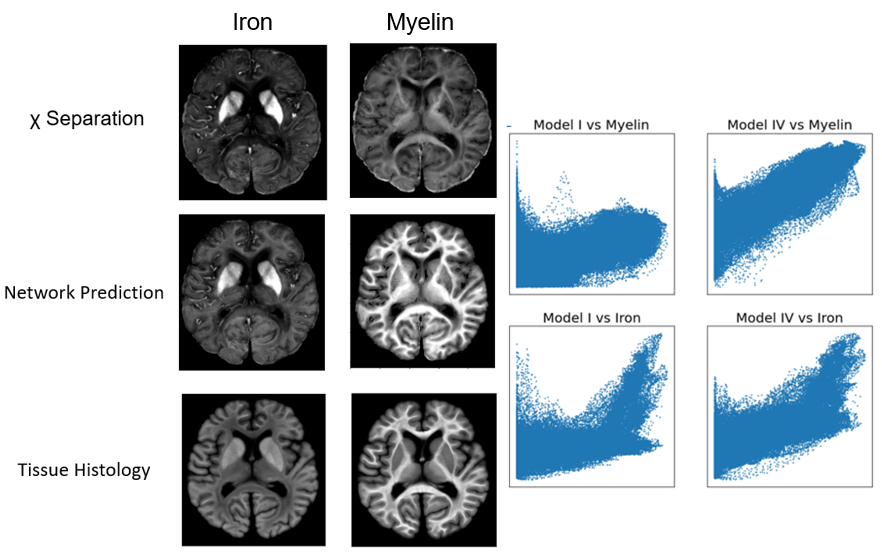
Figure 3. Conventional χ Separation (left to right: χ+,χ-) was performed analytically (Model I) and can be compared to corresponding iron and myelin compartments predicted (2nd row, left to right) by BIOPHYSICSS-DL network (Model IV). Bottom row (left to right) shows ground truth ex vivo histology stains for iron and myelin. Voxel-wise correlation scatter plots comparing Model I and Model IV to the histology data are shown and labelled to the right.
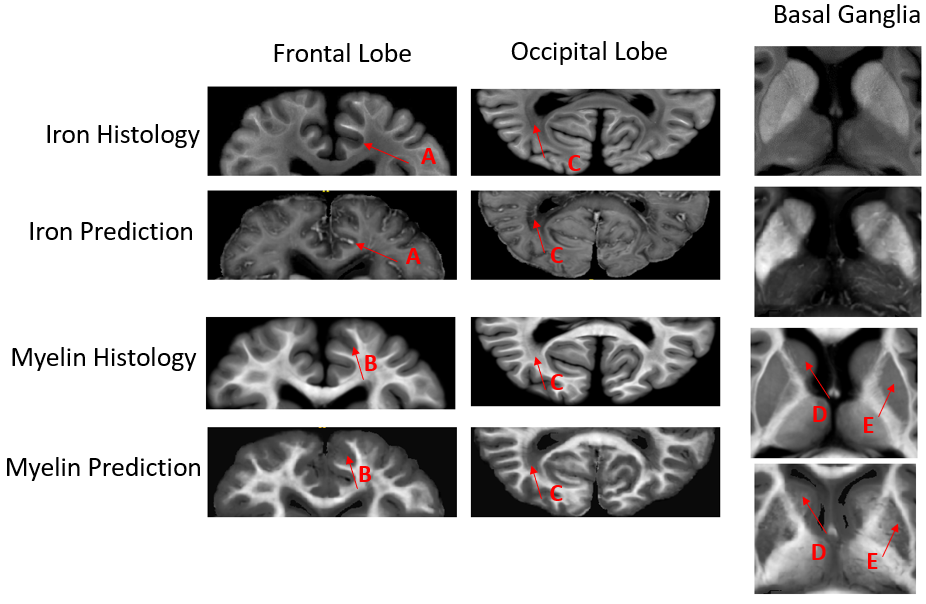
Figure 4. Comparison of histology images to BIOPHYSICSS-DL model (iv) predictions ex vivo. Frontal cortex images show U-fibers (A) represented in iron prediction distinctly from demyelinated cortical regions (B) in the myelin prediction. Optical radiations (C) can be distinguished from surrounding WM for both histology and prediction. Increased predicted iron concentration in the DGM compared to the histology can be attributed to saturation effects in the DAB-enhanced iron stain. Myelin prediction shows similar intensities in caudate (D) and putamen (E) as the histology map.
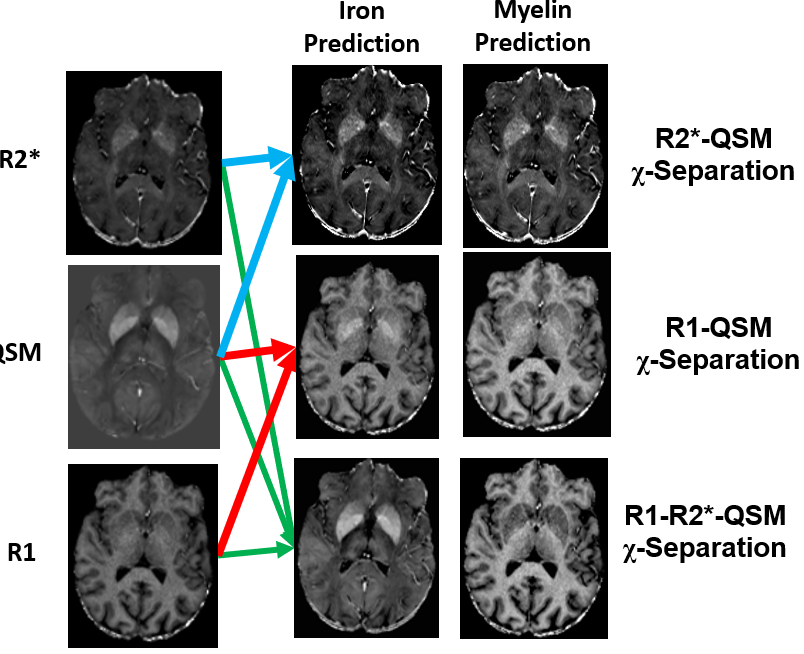
Figure 5. In vivo results. MRI parameters maps are shown on the left. Arrows indicate model ii (blue), model iii (red), and model iv (green). Model (iv) showed accurate hypointense contrast in the globus pallidus and homogeneous white matter myelin concentrations. The iron map showed increased iron contrast with increasing distance from the center of the brain, similar to the iron stain in Fig. 2.
DOI: https://doi.org/10.58530/2023/4735