4731
Analysis of regional differences in pH values obtained via 31P MRSI at 7T1Division of Medical Physics in Radiology, German Cancer Research Center (DKFZ), Heidleberg, Germany, 2Faculty of Physics and Astronomy, University of Heidelberg, Heidelberg, Germany, 3Division of Radiology, German Cancer Research Center (DKFZ), Heidleberg, Germany, 4Faculty of Medicine, University of Heidelberg, Heidelberg, Germany, 5Division of Neuroradiology, University Hospital Bonn, Bonn, Germany
Synopsis
Keywords: Non-Proton, Spectroscopy, Phosphorus, pH, cancer
In this study, we analyzed pH values obtained via high-resolution 31P MRSI at 7T in different subjects and different regions of the human brain, and identified a trend towards lower pH values in the frontal region compared to other brain regions. The potential regional variation should be taken into account in cases, where only small pH changes between different tissues are expected and partial volume effects might dominate.Introduction
The pH value in living tissue is of importance in cellular metabolism, and is a valuable biomarker for cancer imaging. 31P MRSI enables to non-invasively obtain pH values, and had recently been shown to acquire whole-brain maps of intra- and extracellular pH with reasonable spatial resolution at 7T1. Though the attainable spatial resolution is in principle high enough to separate various tissue types, partial volume effects might still hide regional pH differences across the human brain, particularly when healthy or tumorous pH changes are not well-pronounced. Therefore, the aim of this study was to analyze the variability of pH values obtained via high-resolution 31P MRSI at 7T in different subjects and different regions of the healthy human brain, and to identify potential implications for its application to research of glioma.Methods
Six healthy volunteers (4 male, age: 22-35) and two patients with low-grade glioma (2 male, age: 23&34) were examined on a 7T system (MAGNETOM, Siemens) using a 31P/1H coil with 32 31P receiver channels (Rapid Biomedical). The 31P MRSI data (isotropic nominal resolution: 12.5mm; effective voxel size Veff=5.7ml; Tmeas=51min) were acquired and processed as described in detail in1,2. All data processing was performed in MATLAB R2021a (MathWorks). The quantification of localized 31P spectra was performed with a home-built MATLAB implementation of AMARES3 using the model described in2, which includes intra- and extracellular inorganic phosphate resonances (Pi, ePi). Intra- and extracellular pH values (pHi, pHe) were calculated according to the modified Henderson-Hasselbalch4 equation using the quantified chemical shifts of Pi and ePi, respectively, and Phosphocreatine (PCr). For regional analysis, a frontal, parieto-temporal and occipital region-of-interest (ROI) was automatically selected in each subject with a home-build segmentation tool. This tool uses an automated segmentation for grey (GM) and white matter (WM) (SPM5) based on T1w and T2w images, combined with a brain atlas provided by the SPM extension automated anatomical labelling atlas6. In the patients, selection was performed only on the contralateral healthy brain tissue, and additionally a tumor ROI was selected by a radiologist using clinical 1H images.Results
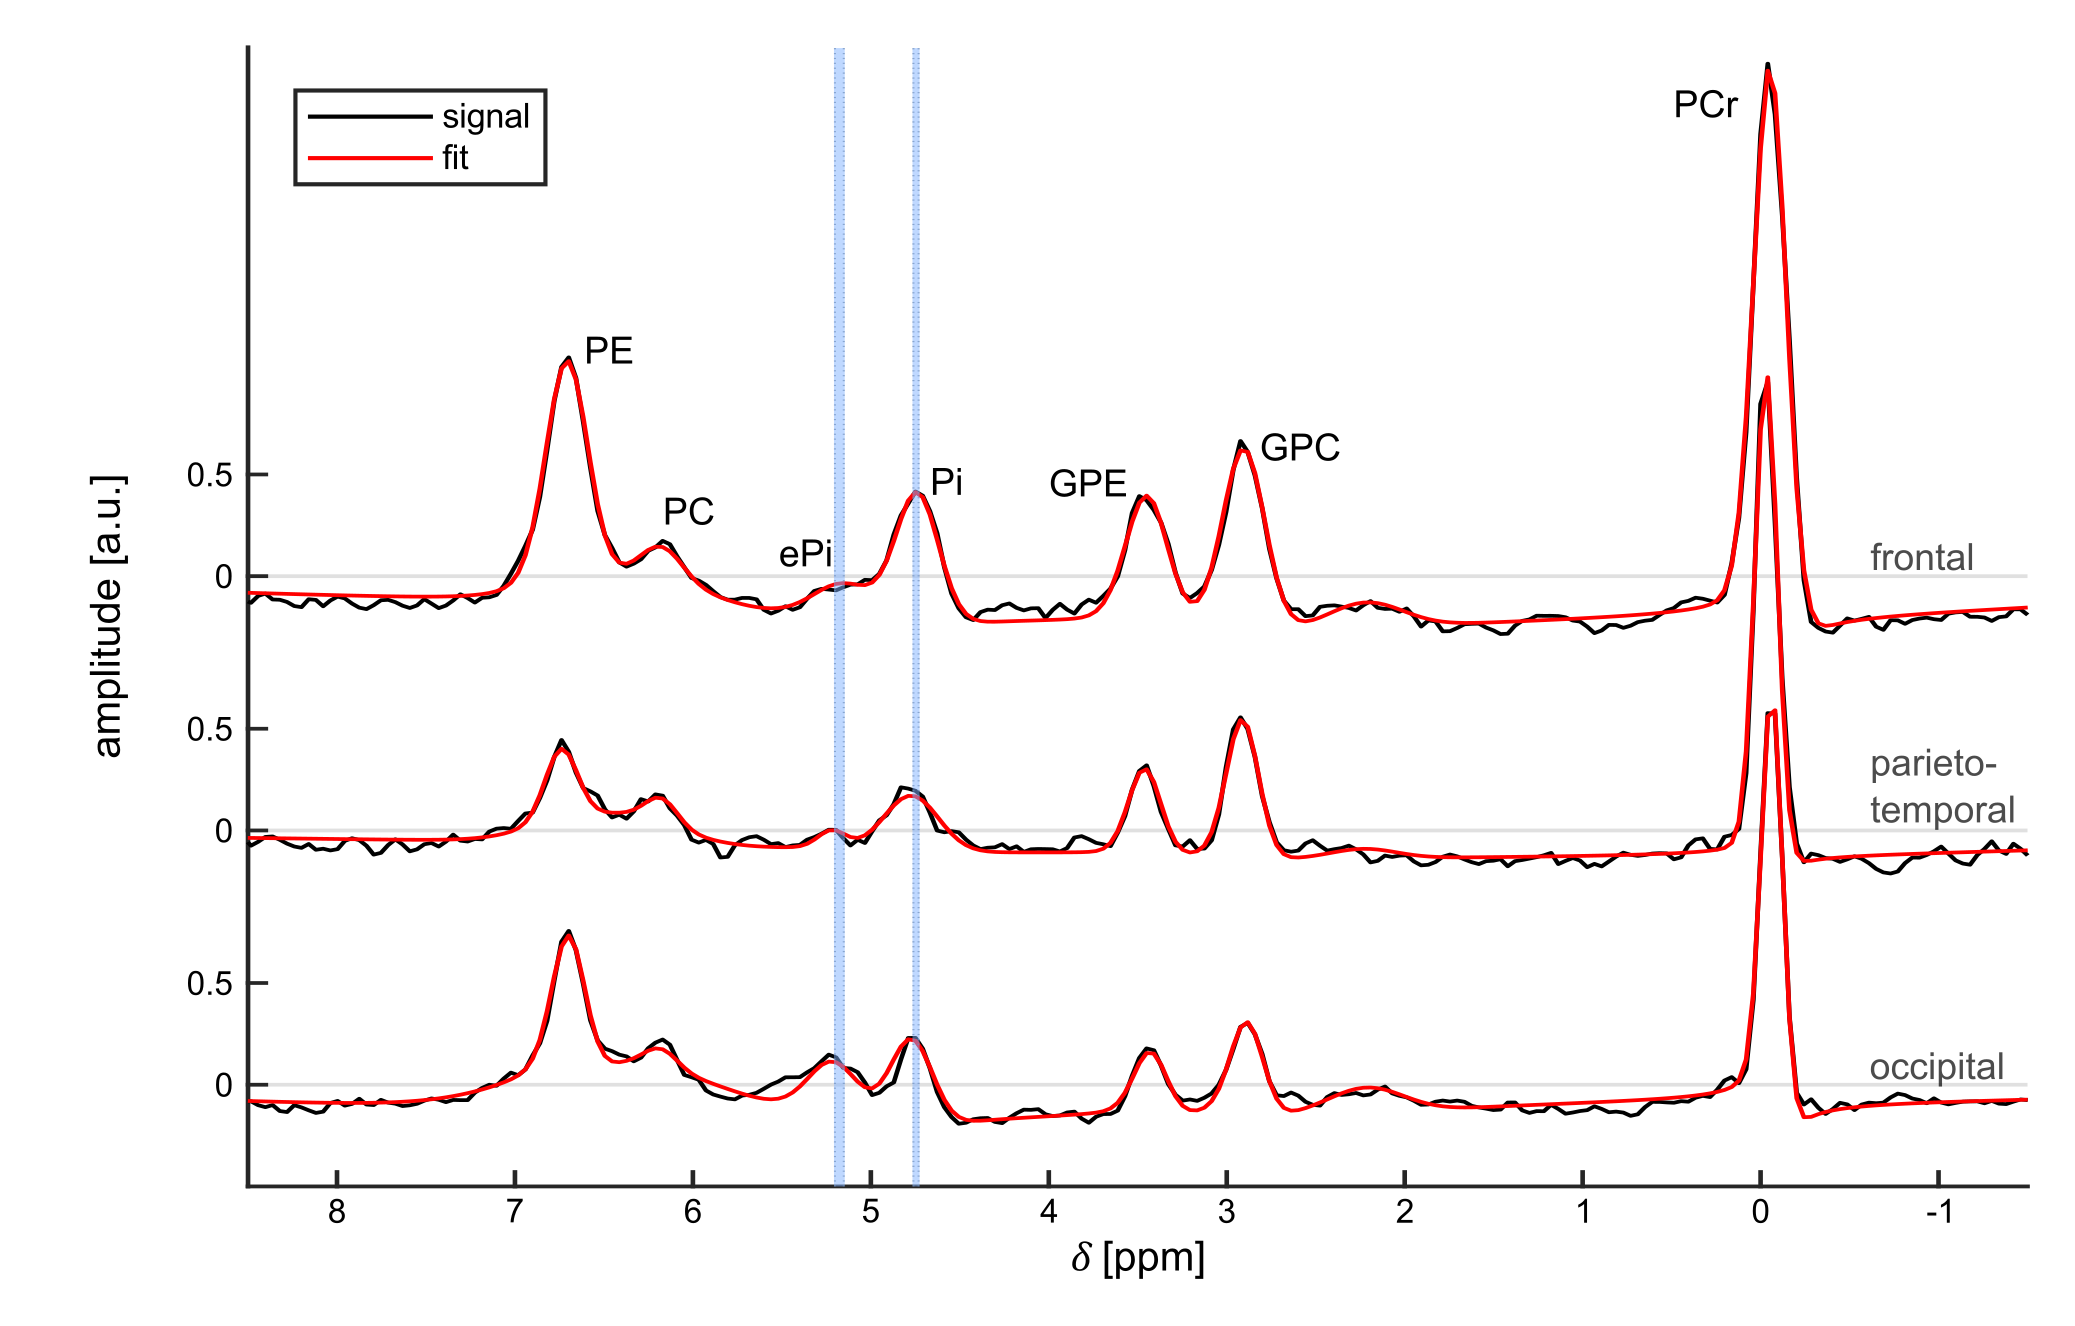
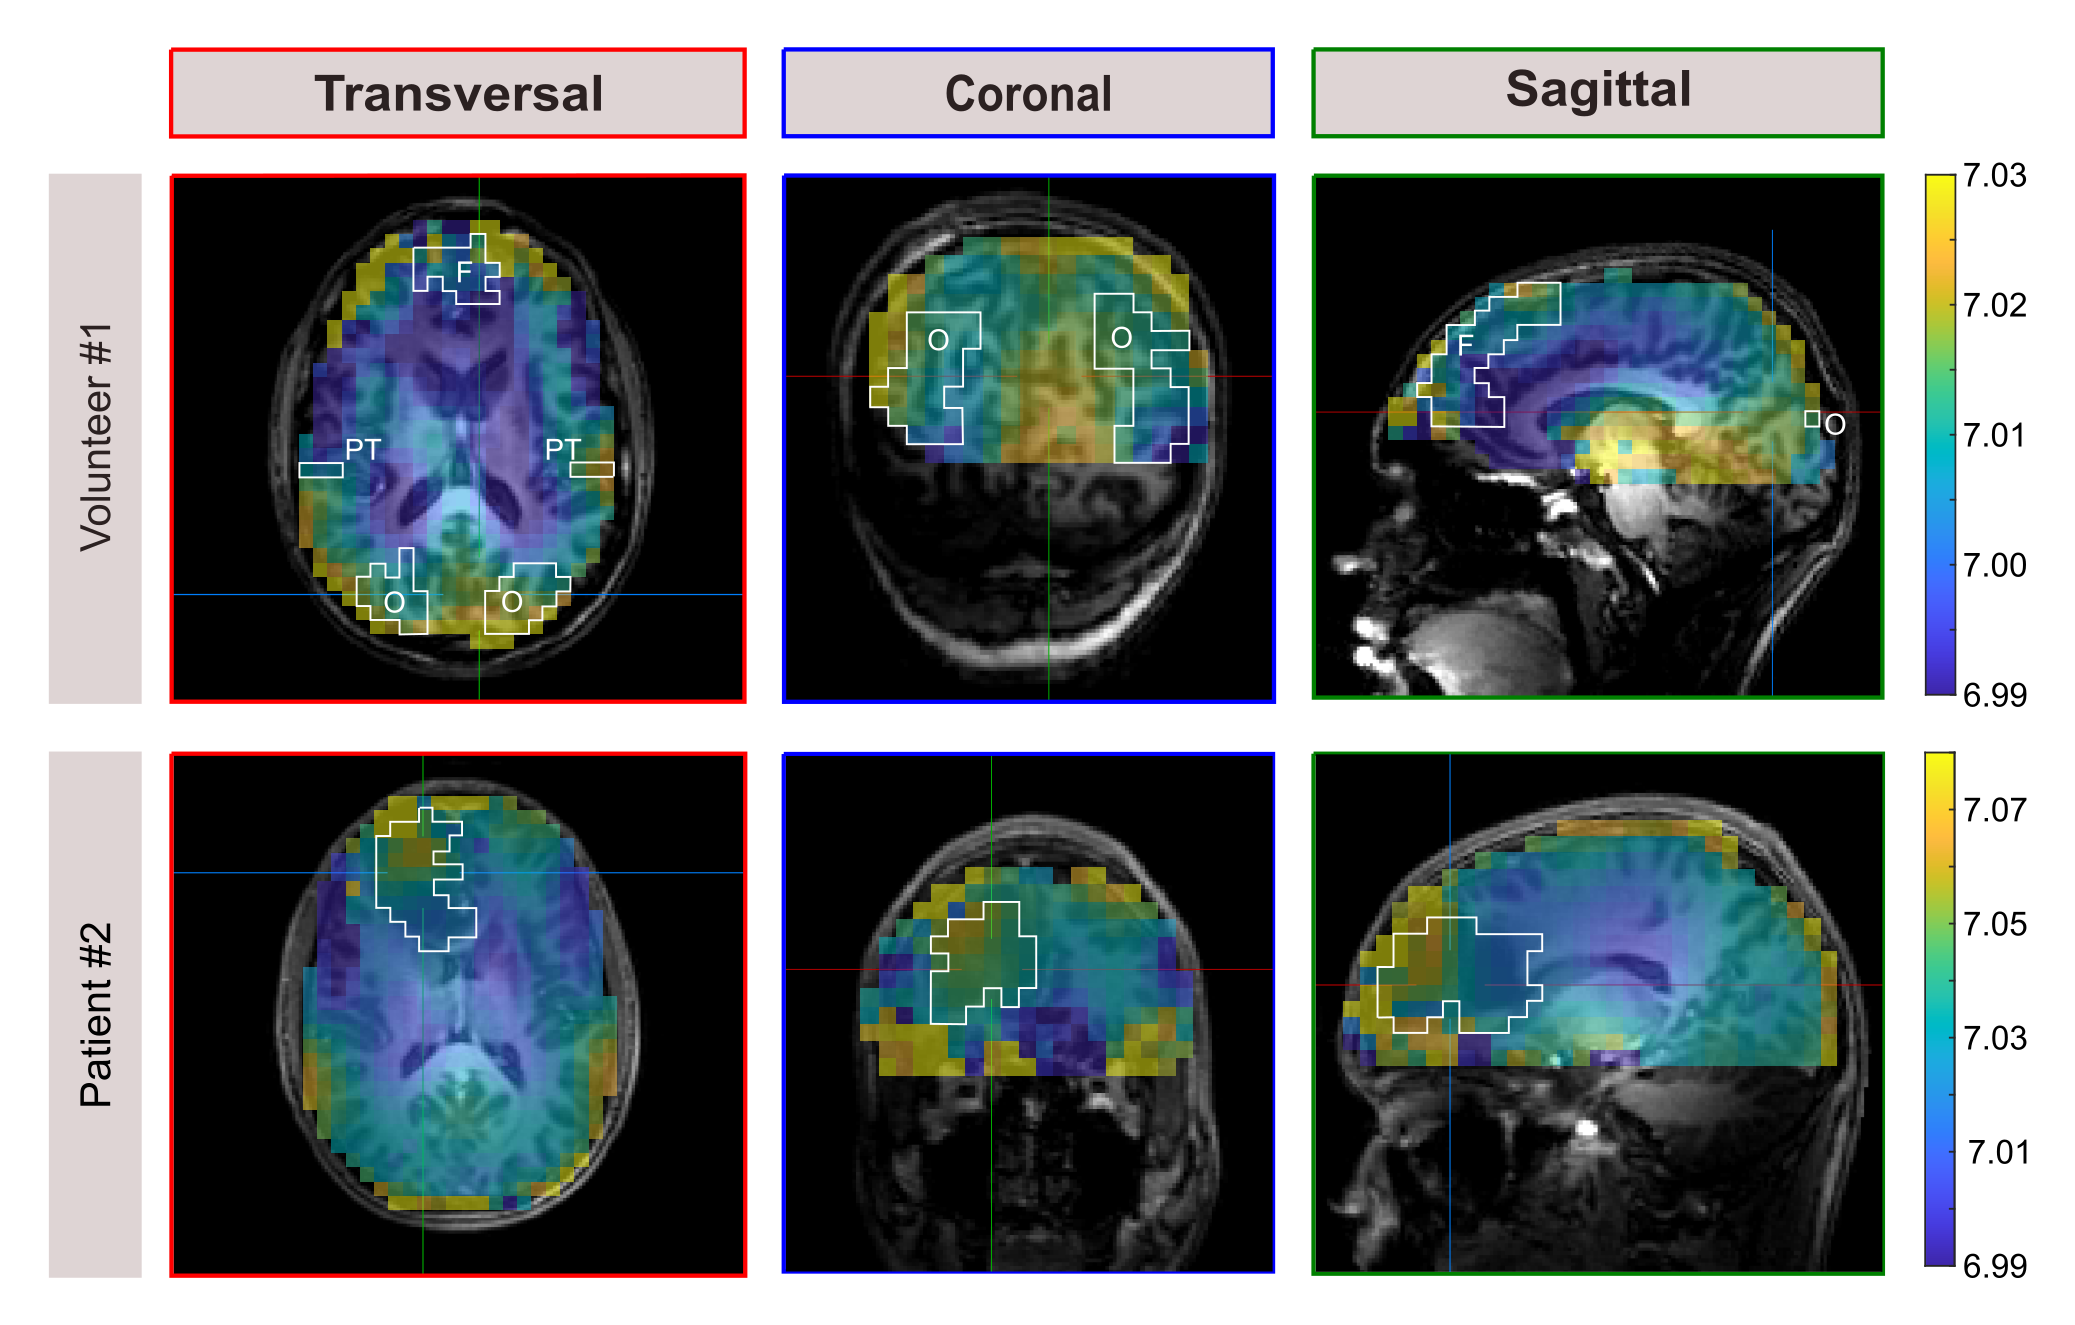
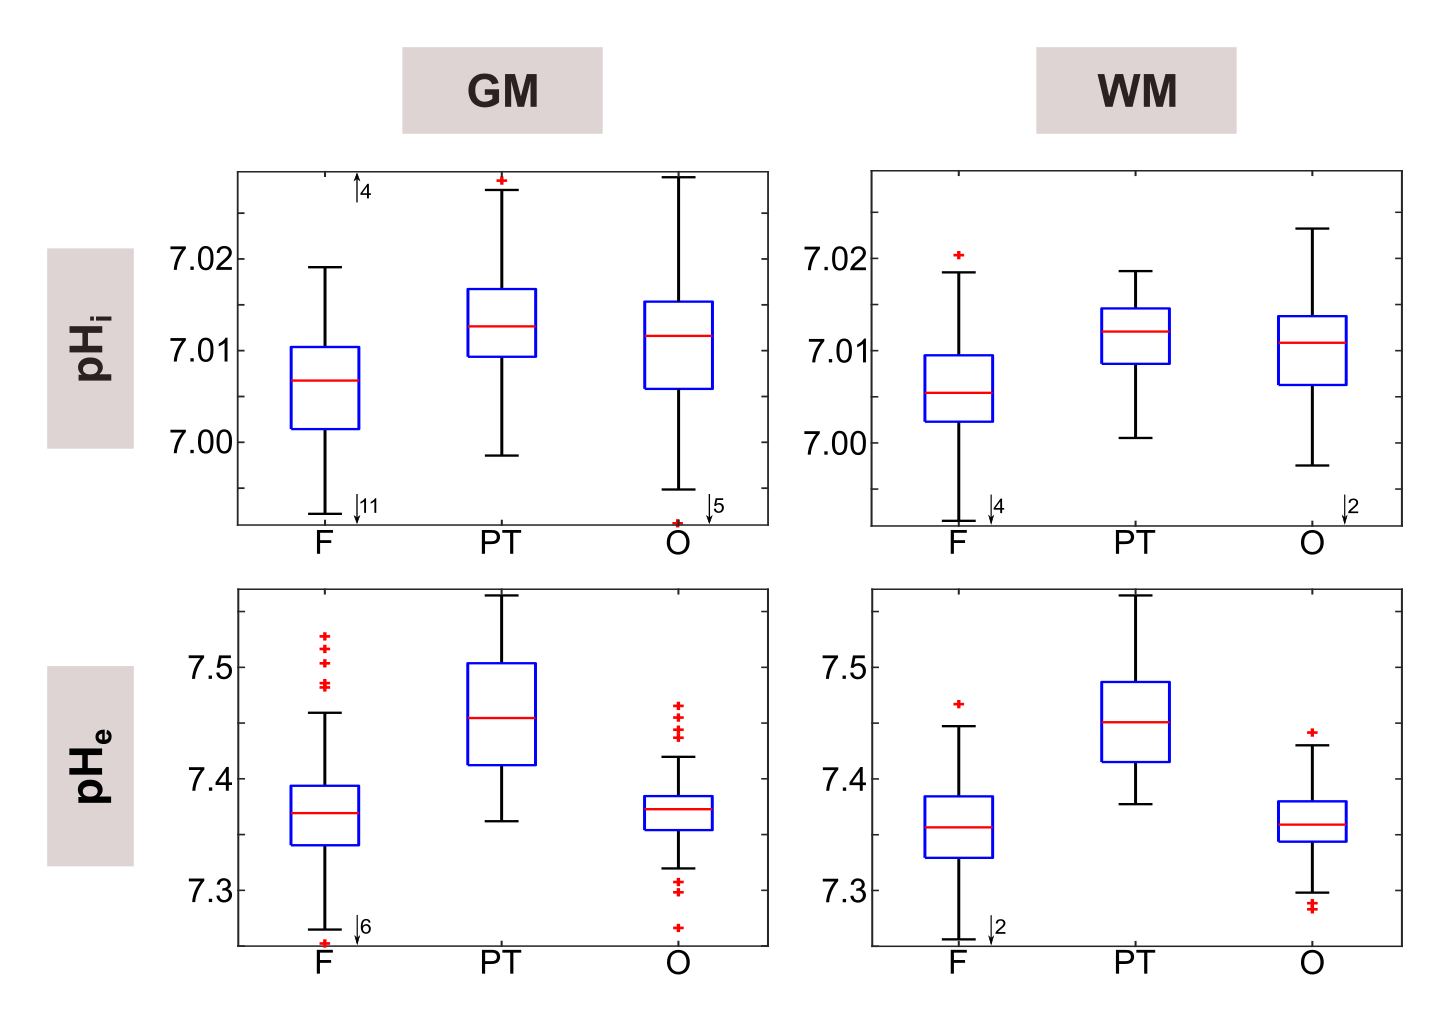
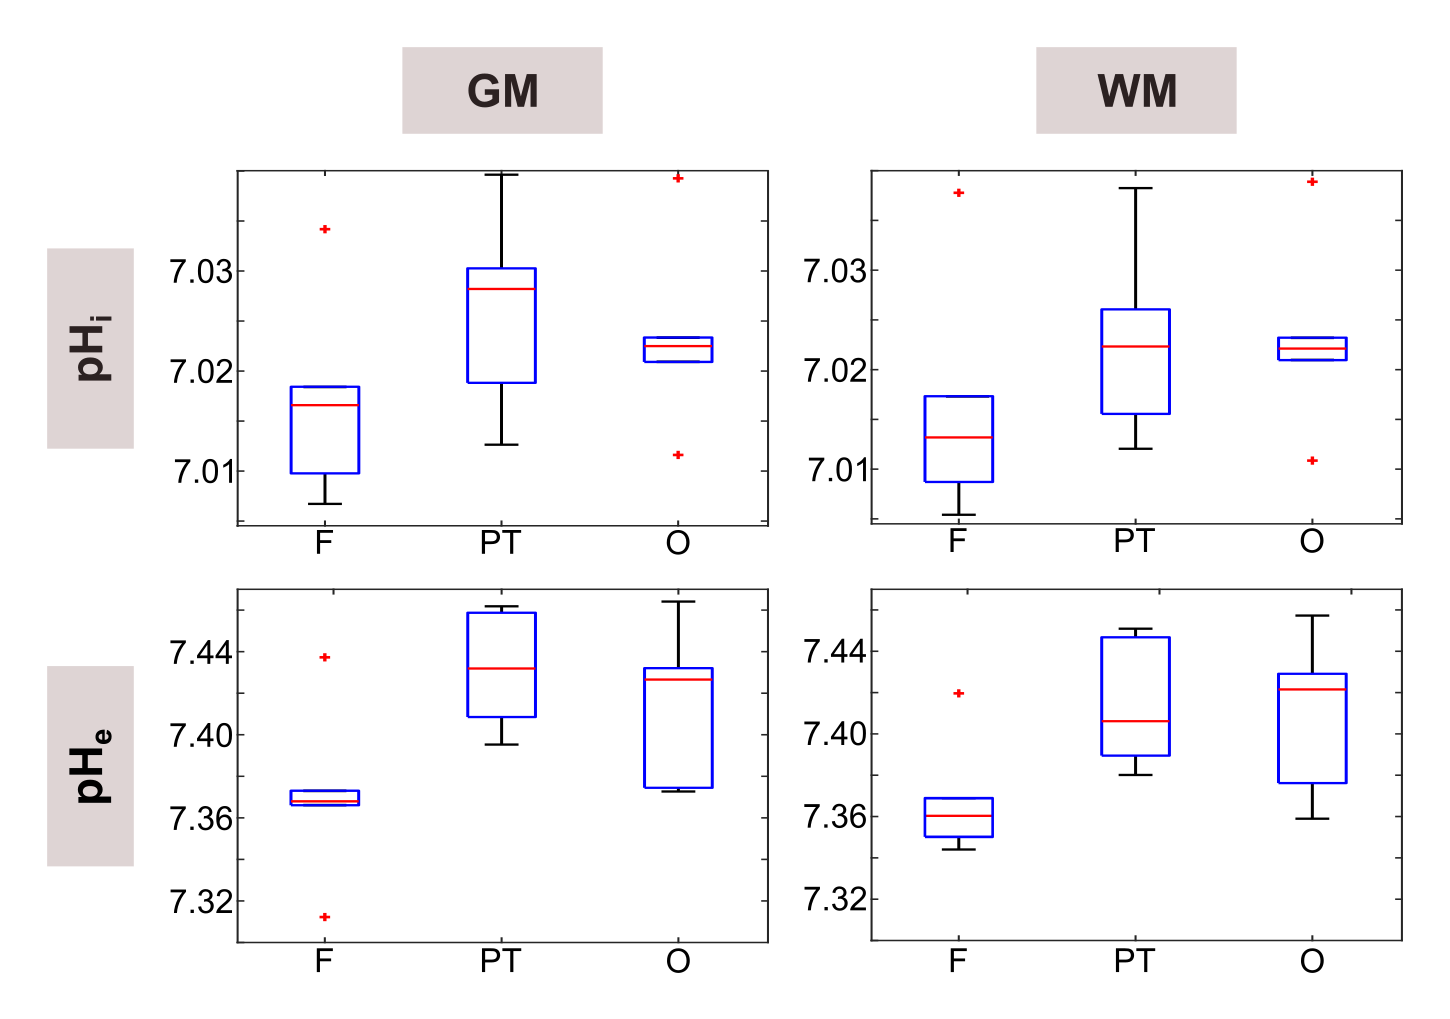
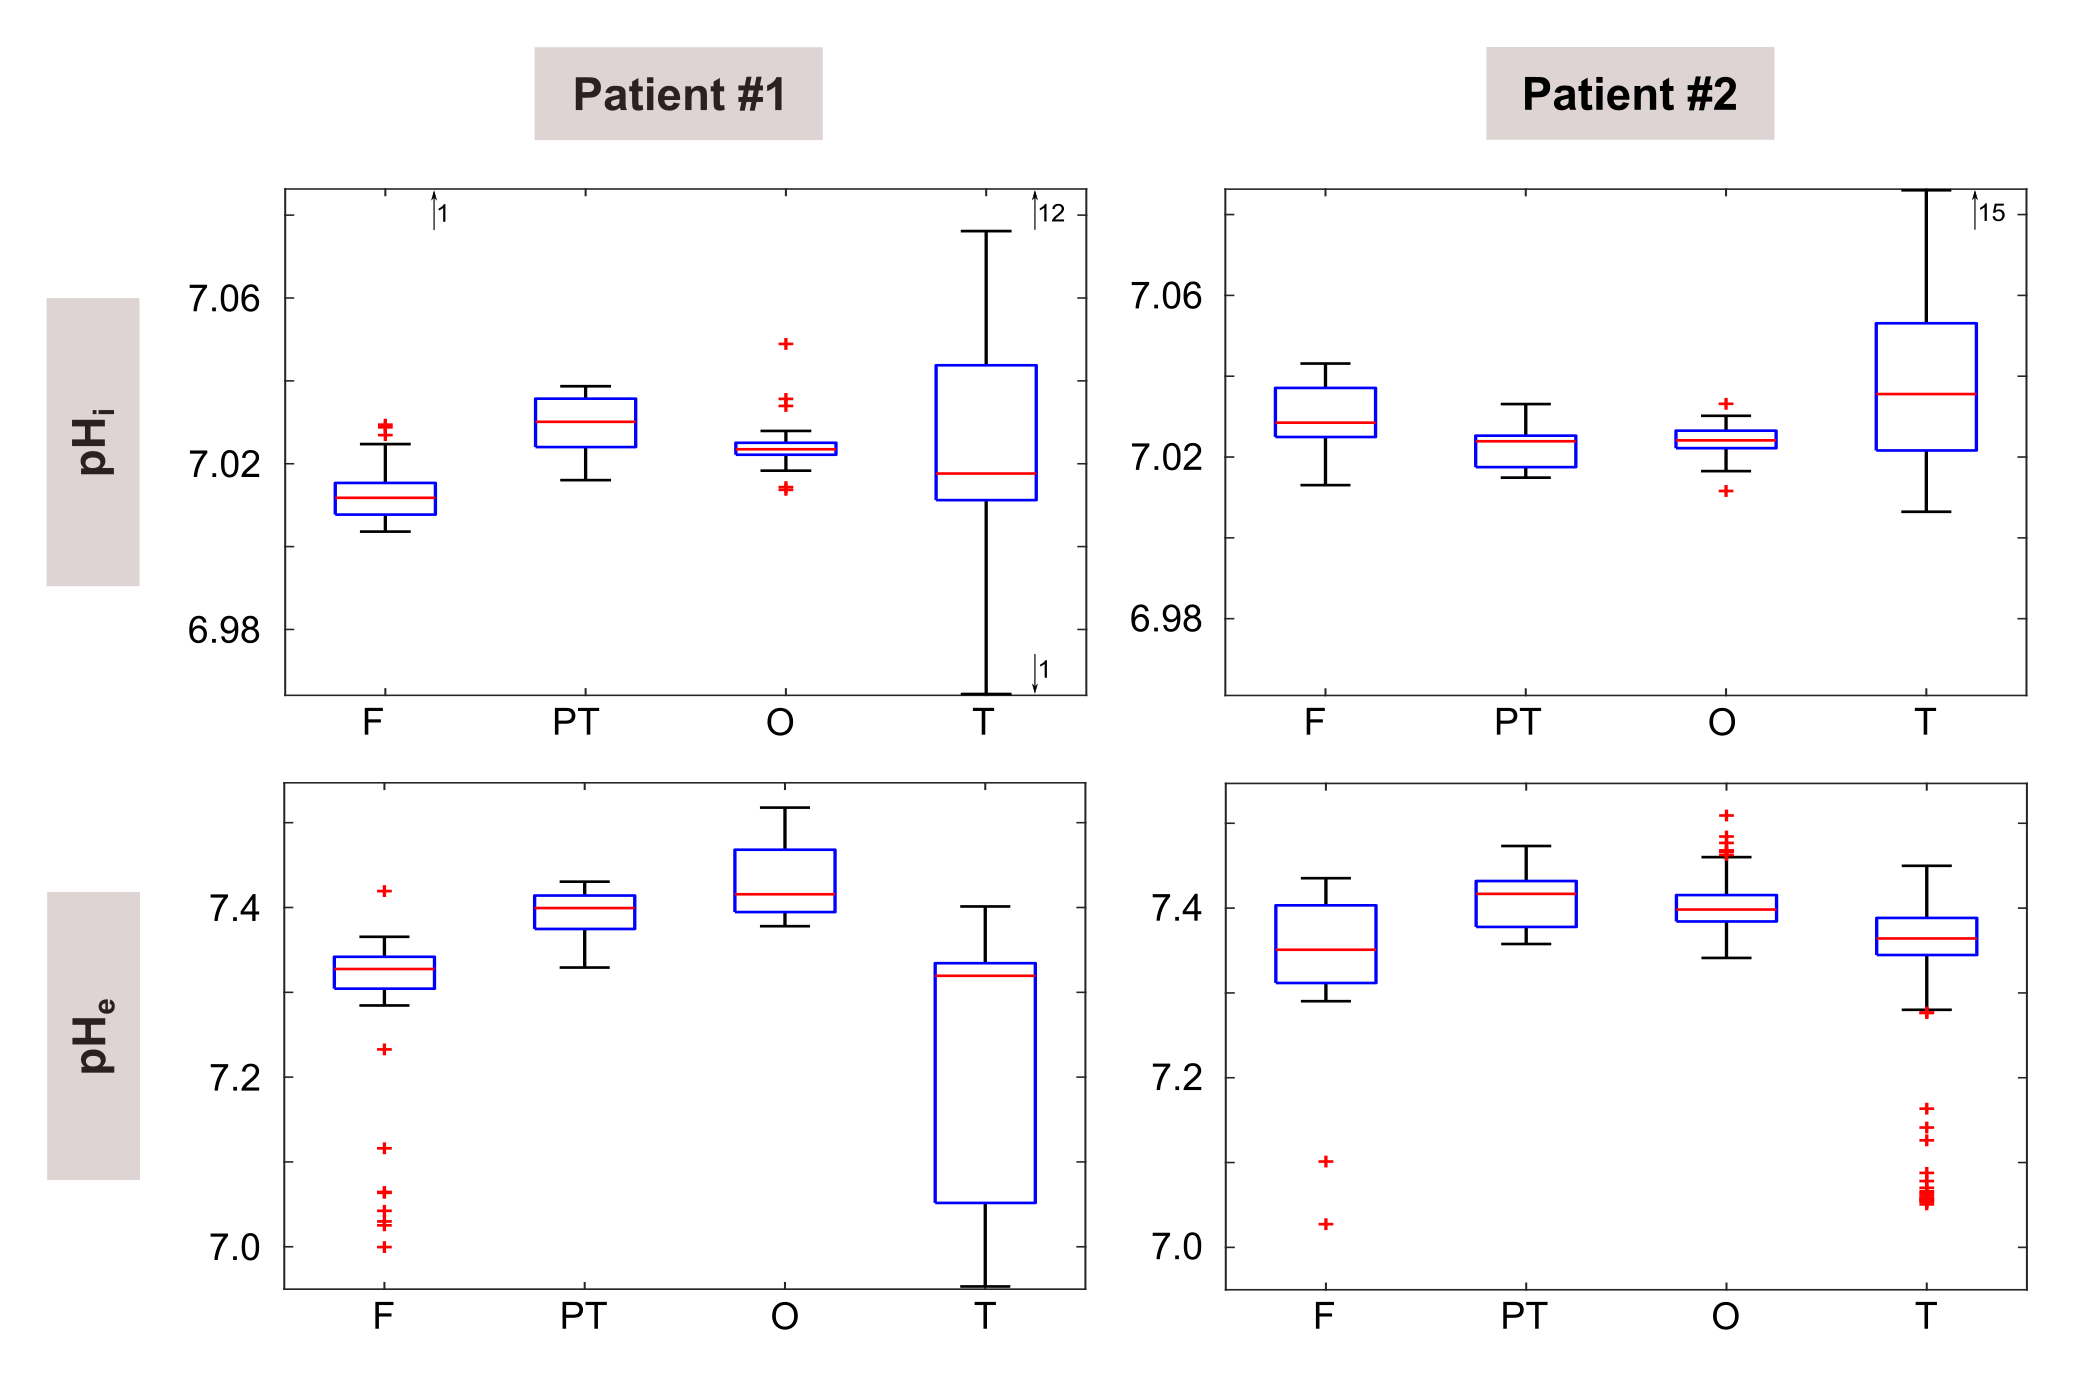
Figure 1 illustrates a representative set of 31P spectra localized in the three defined brain regions of one volunteer (#1). Subtle regional differences in the chemical shifts of Pi and ePi are observed, which are visible in all subjects. The corresponding intracellular pH maps (Figure 2) reveal regional differences in healthy brain tissues accordingly, which appear to relate to GM and WM differences. Note that in the shown patient (#2, Figure 2 bottom row) pHi is increased only in some voxels of the tumor region, compared to the contralateral healthy tissue. The distribution of pH values obtained in individual brain regions, like in the representative ROI analysis of volunteer #1 (Figure 3), indicates differences with a trend towards lower median pH values in the frontal lobe compared to the parieto-temporal and occipital lobe. These observations substantiate further across the group of volunteers (Figure 4). Figure 5 illustrates the ROI analysis for the regional pH differences of both patients, where the observations from the healthy subjects are resembled well. Note that in patient #1, the tumor volume is spatially well separated from the contralateral healthy ROIs, while the frontal ROI in patient #2 is in direct vicinity to the tumor, thus suffering from voxel bleed. In the tumor ROI, pH values show in some voxels pronounced differences compared to healthy tissue (cf. Figure 2), as indicated by the large value range. The median pH values across the whole tumor ROI appear to follow the median pH in the analyzed brain location.Discussion
The group analysis indicates a certain robustness in detecting regional pH differences across the human brain of different subjects using 31P MRSI. pH differences between GM and WM were already reported earlier7 , and were also visible in our pH maps (Figure 2). Note that in the ROI analyses GM-WM differences are absent in all regions (Figure 3&4), because corresponding GM and WM voxels are too close to each other. In this study, a regional pH difference was found across the human brain (Figure 3-5). However, partial volume effects are questioning its origin. The potential voxel bleed from nearby muscle tissue to the parieto-temporal and occipital ROIs might explain the difference in pH values compared to the frontal ROI. A varying fraction of GM and WM content in the analyzed regions was not found across the subjects (data not shown), thus seems not to explain the regional differences. However, larger cohort sizes are required to poof the observations. Nonetheless, our findings highlight the importance of (I) achieving highest possible spatial resolution and (II) consistent placing of healthy control tissue ROIs, in clinical cases where ROI-averaged pH differences are small (Figure 2&5).Conclusion
The presented data indicates that pH maps of the human brain with comparable regional variation in different subjects can be obtained via 31P MRSI at 7T. A trend towards lower pH values was identified in the frontal region compared to other brain regions. This regional variation should be taken into account in clinical cases, where only small pH changes compared to healthy tissues are expected and partial volume effects might dominate.Acknowledgements
No acknowledgement found.References
[1] Korzowski, A, Weinfurtner, N, Mueller, S, et al. Volumetric mapping of intra- and extracellular pH in the human brain using 31P MRSI at 7T. Magn Reson Med. 2020; 84: 1707– 1723. https://doi.org/10.1002/mrm.28255
[2] Korzowski
A, Weckesser N, Franke VL, Breitling J, Goerke S, Schlemmer HP, Ladd ME,
Bachert P, Paech D. Mapping an Extended Metabolic Profile of Gliomas Using
High-Resolution 31P MRSI at 7T. Front Neurol. 2021 Dec 23;12:735071.
doi:10.3389/fneur.2021.735071
[3] Vanhamme
L, van den Boogaart A, Van Huffel S. Improved method for accurate and efficient
quantification of MRS data with use of prior knowledge. J Magn Reson. 1997
Nov;129(1):35-43. doi: 10.1006/jmre.1997.1244
[4] de Graaf RA.
In Vivo NMR Spectroscopy: Principles and Techniques: 2nd Edition.; 2007. doi:
10.1002/9780470512968.
[5] Ashburner
J, Friston KJ. Unified segmentation. Neuroimage. 2005 Jul 1;26(3):839-51. doi:
10.1016/j.neuroimage.2005.02.018
[6] Rolls
ET, Huang CC, Lin CP, Feng J, Joliot M. Automated anatomical labelling atlas 3.
Neuroimage. 2020 Feb 1;206:116189. doi: 10.1016/j.neuroimage.2019.116189
[7] Ruhm
L, Dorst J, Avdievitch N, Wright AM, Henning A. 3D 31 P MRSI of the human brain
at 9.4 Tesla: Optimization and quantitative analysis of metabolic images. Magn
Reson Med. 2021 Nov;86(5):2368-2383. doi: 10.1002/mrm.28891
Figures