4729
Comparison of short and long TR Gradient Recalled Echo (GRE) measures for total sodium concentration mapping in the calf
1Sir Peter Mansfield Imaging Centre, University of Nottingham, Nottingham, United Kingdom
Synopsis
Keywords: Non-Proton, Non-Proton, sodium MRI, T1 mapping, muscle, tissue sodium concentration
Sodium (23Na) MRI measures of tissue are SNR limited. Here, we compare a 3D gradient recalled echo (GRE) 23Na scans with a short TR and fully recovered TR for estimation of tissue sodium concentration (TSC) in the calf. We validate measures by collecting 23Na T1 measures of the calf and reference bottles. A short TR scan is shown to provide increased image SNR, resulting in higher measures of TSC, along with improved depiction of the skin. Using the short TR GRE scan, older subjects and haemodialysis patients are shown to have higher calf TSC than younger subjects.Introduction
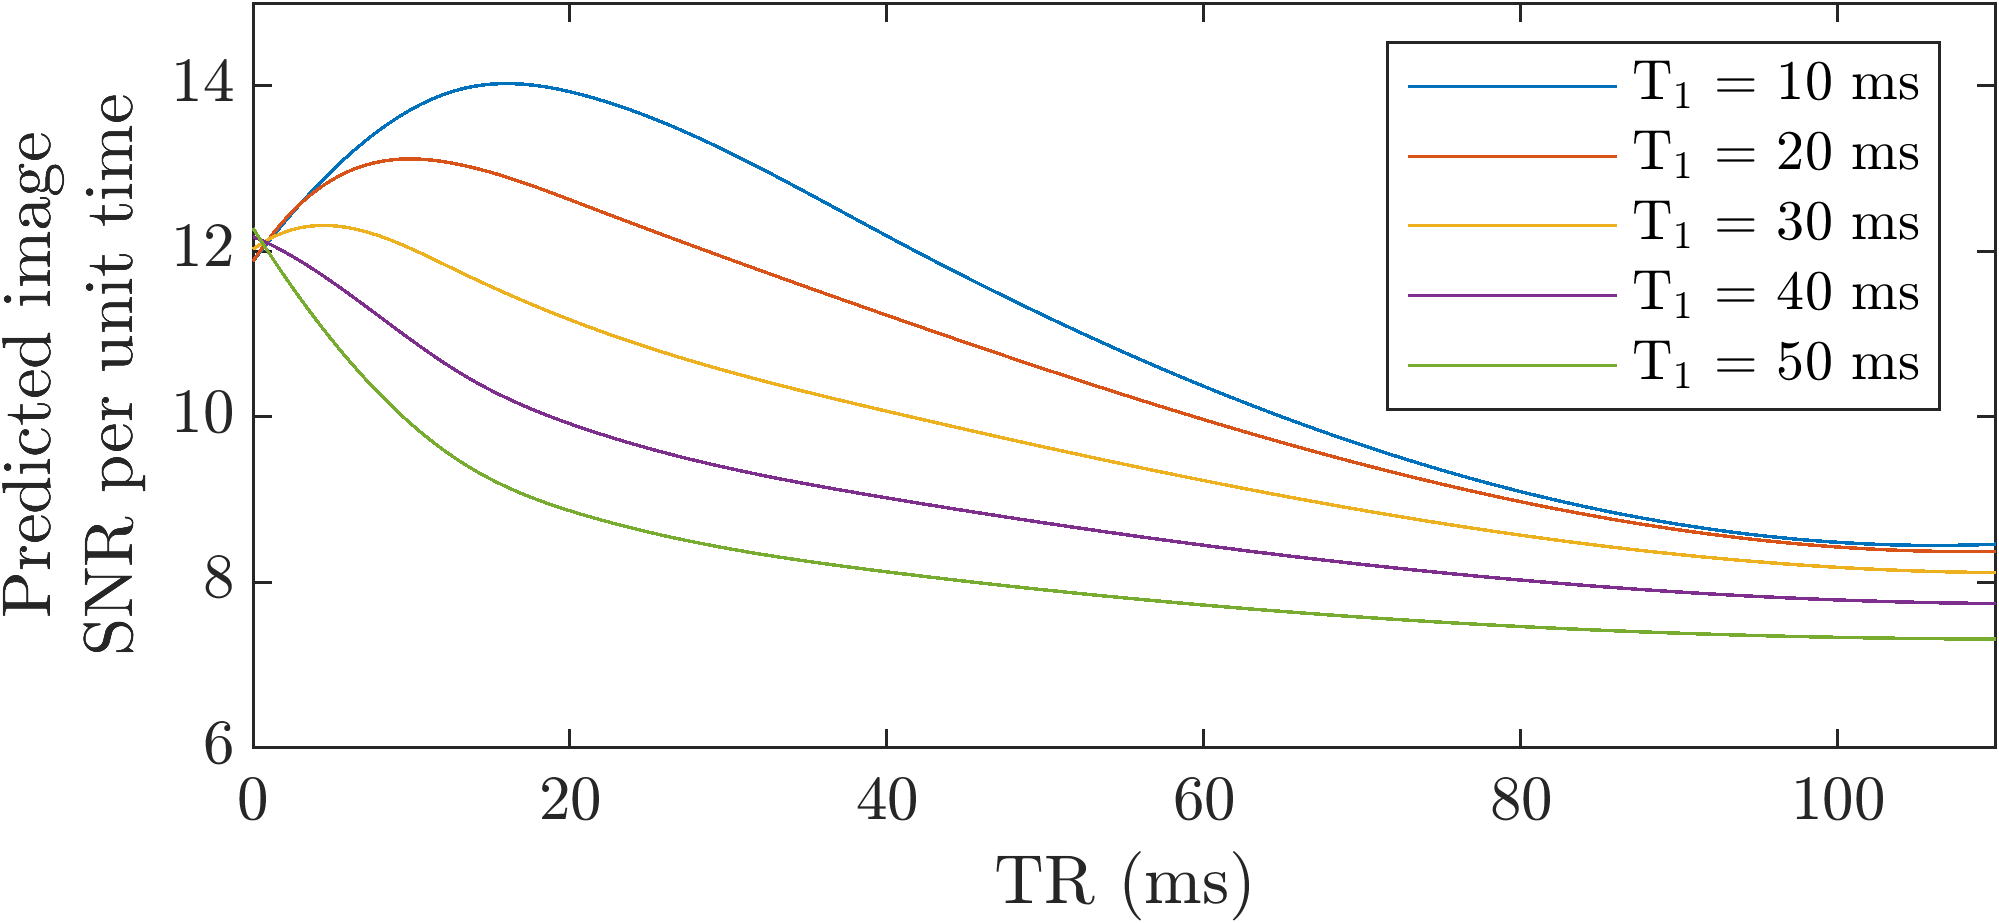
Spatial quantification of tissue sodium concentration (TSC) using 23Na MRI of the calf muscle has been shown to be of importance for clinical use in Diabetes Mellitus1,2, hypertension3,4, and in kidney disease patients5-7. However, 23Na imaging of tissue is challenging due to the low SNR arising from low 23Na abundance and the need for a short echo time (TE). Gradient Recalled Echo (GRE) 23Na images are often collected with a fully relaxed repetition time (TR) (~100ms) for quantification of TSC3,4,5. However, the short 23Na T1 relaxation time can facilitate a short TR and fast averaging to potentially compensate for the low intrinsic SNR of 23Na imaging8.The signal (S) of a GRE sequence, is primarily dependent on repetition time (TR), flip angle (α) and echo time (TE):
$$S\propto \frac{\sin\alpha\cdot \left( 1-e^{-{T\!R}/{T_{1}}}\right) }{1-\cos\alpha\cdot e^{-{T\!R}/{T_{1}}}}\cdot e^{-{T\!E}/{T{_{2}}^{\star}}}$$
where T1 the longitudinal relaxation time and T2* the transverse relaxation time. For a given TR and T1, the maximum signal is obtained at the Ernst angle. By collecting data at a shorter TR, the available time can be used to collect a greater number of signal averages (NSA), as simulated in Figure 1. In practice, several limitations imposed by the scanner and RF coil hardware dictate the possible values that sequence parameters can take, such as the maximum average RF power and B1 delivered by the RF coil, and maximum flip angle. Here, we compare a 3D GRE sequence with long TR to a spoiled steady state short TR sequence of the same total scan duration to map TSC. We validate the short TR method for quantification of TSC by measuring the 23Na T1 relaxation time of tissue and the reference bottles.
Methods
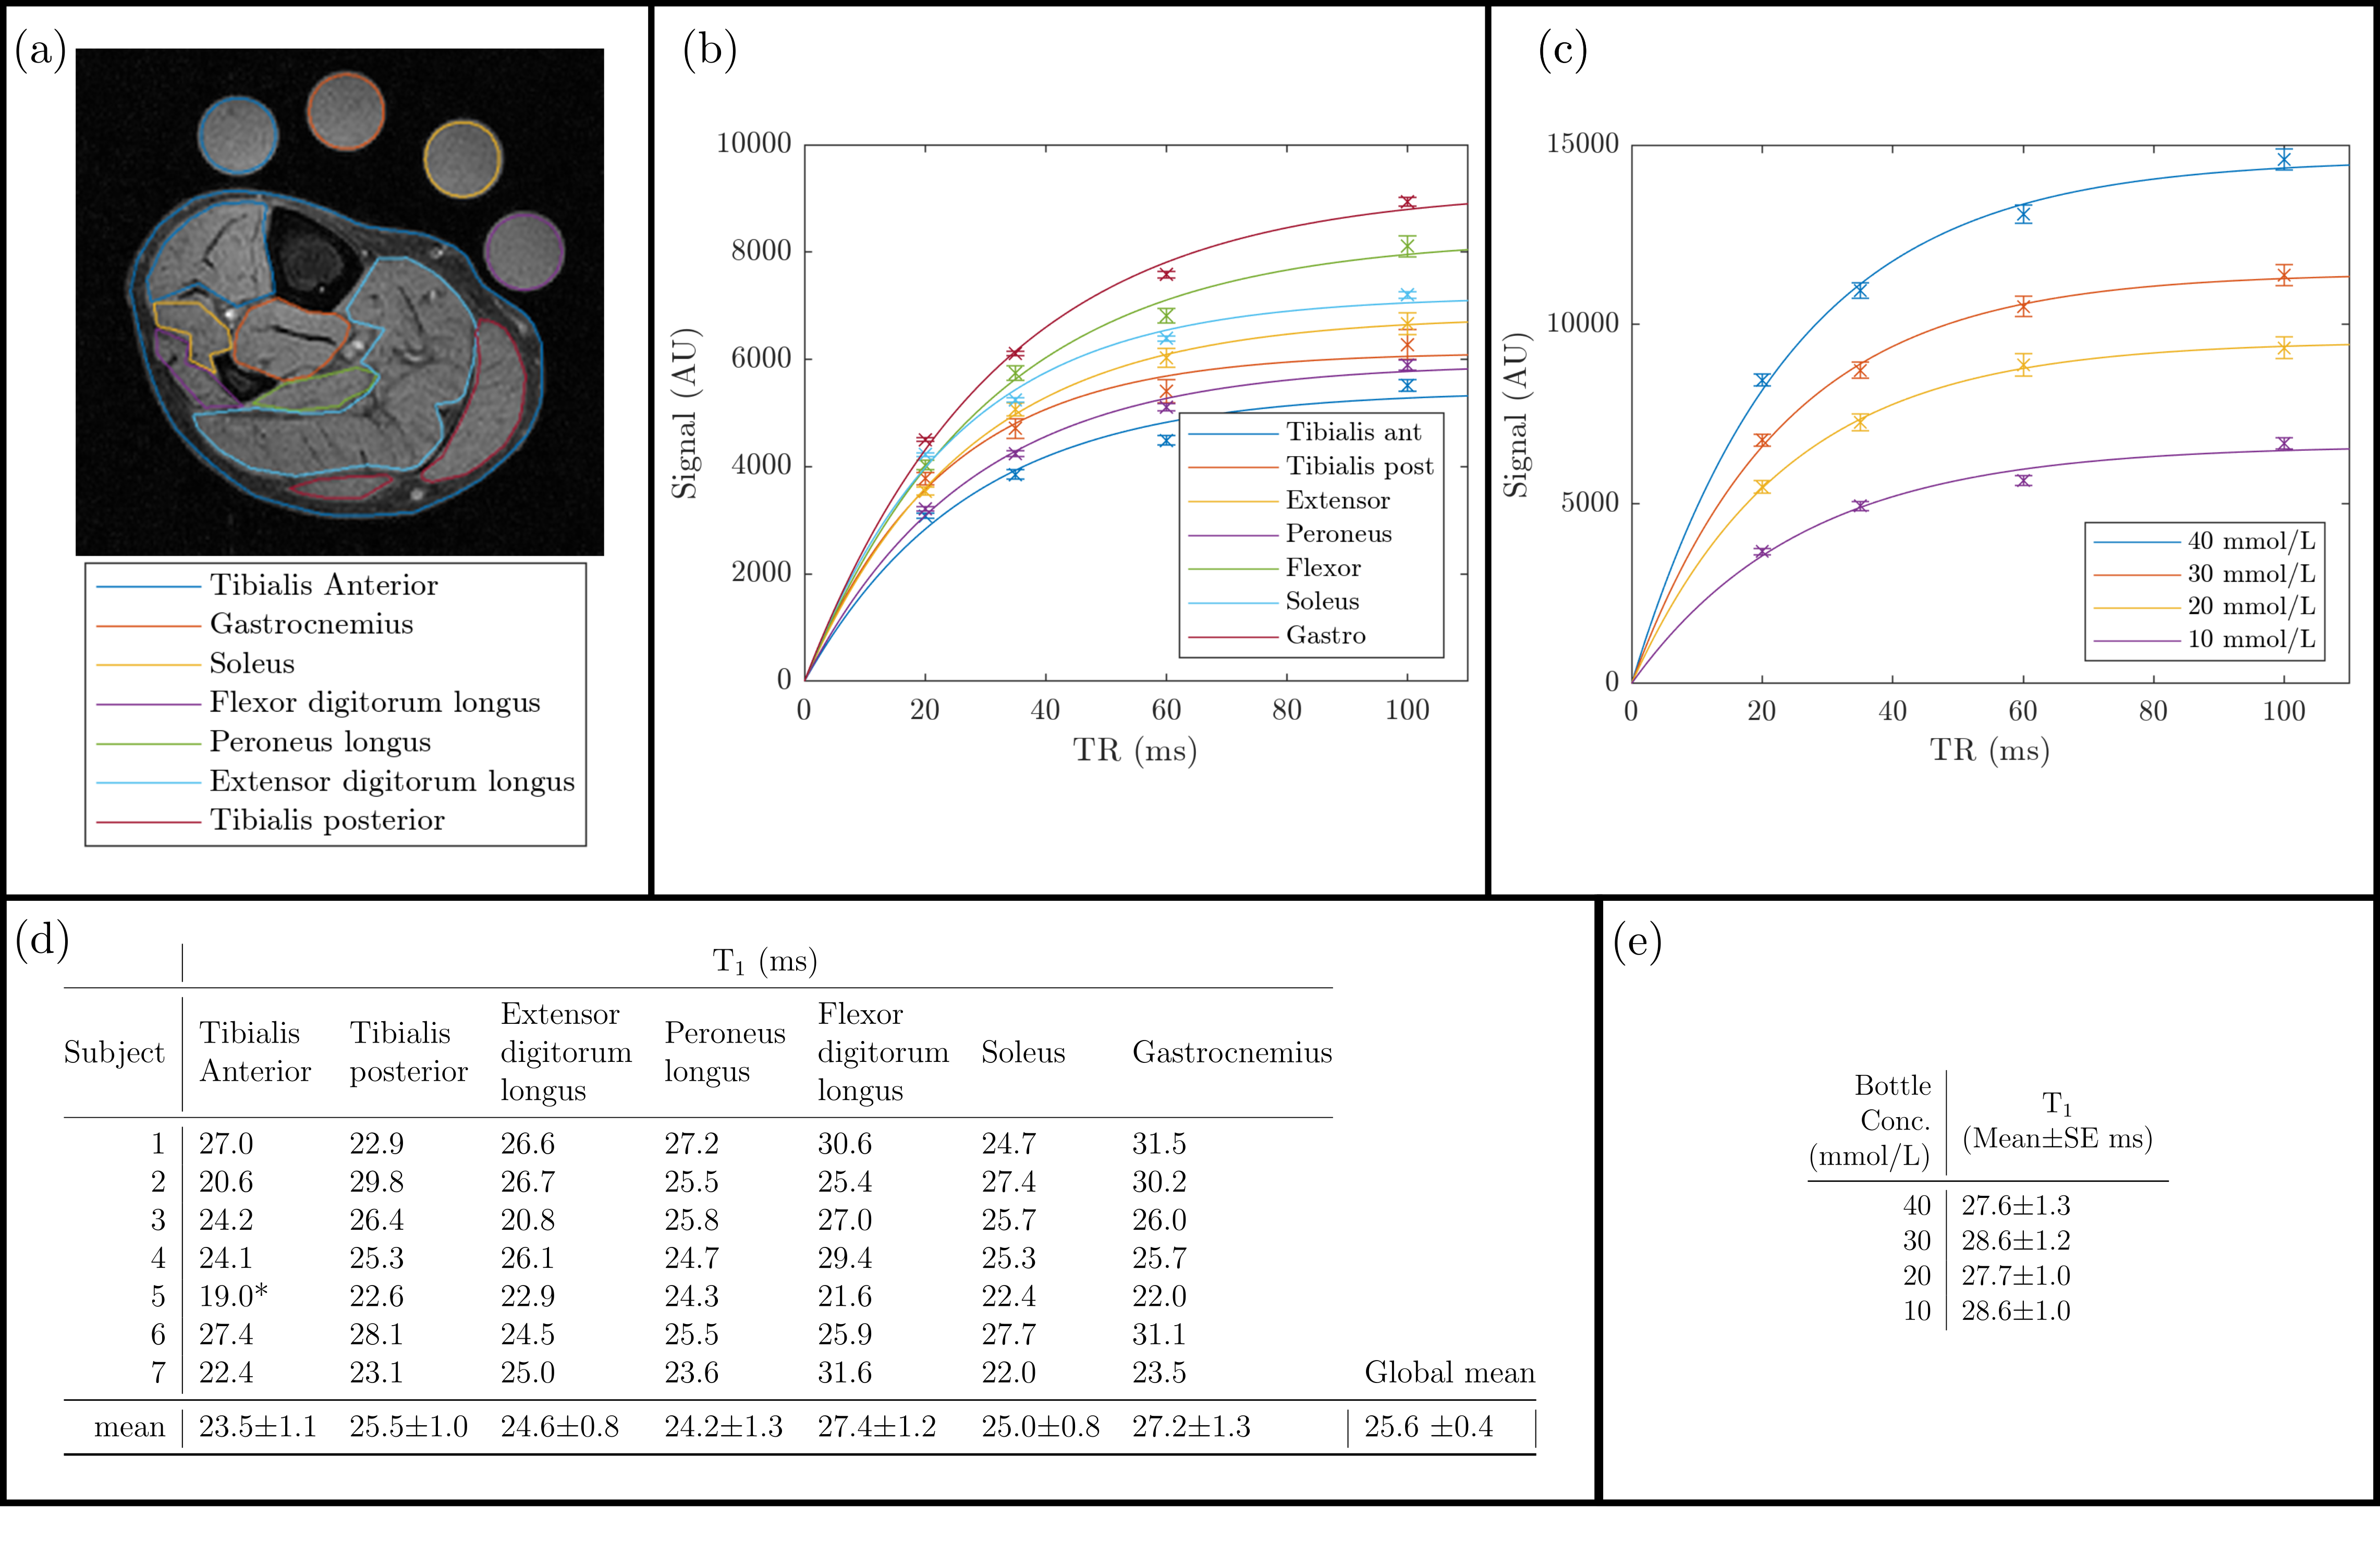
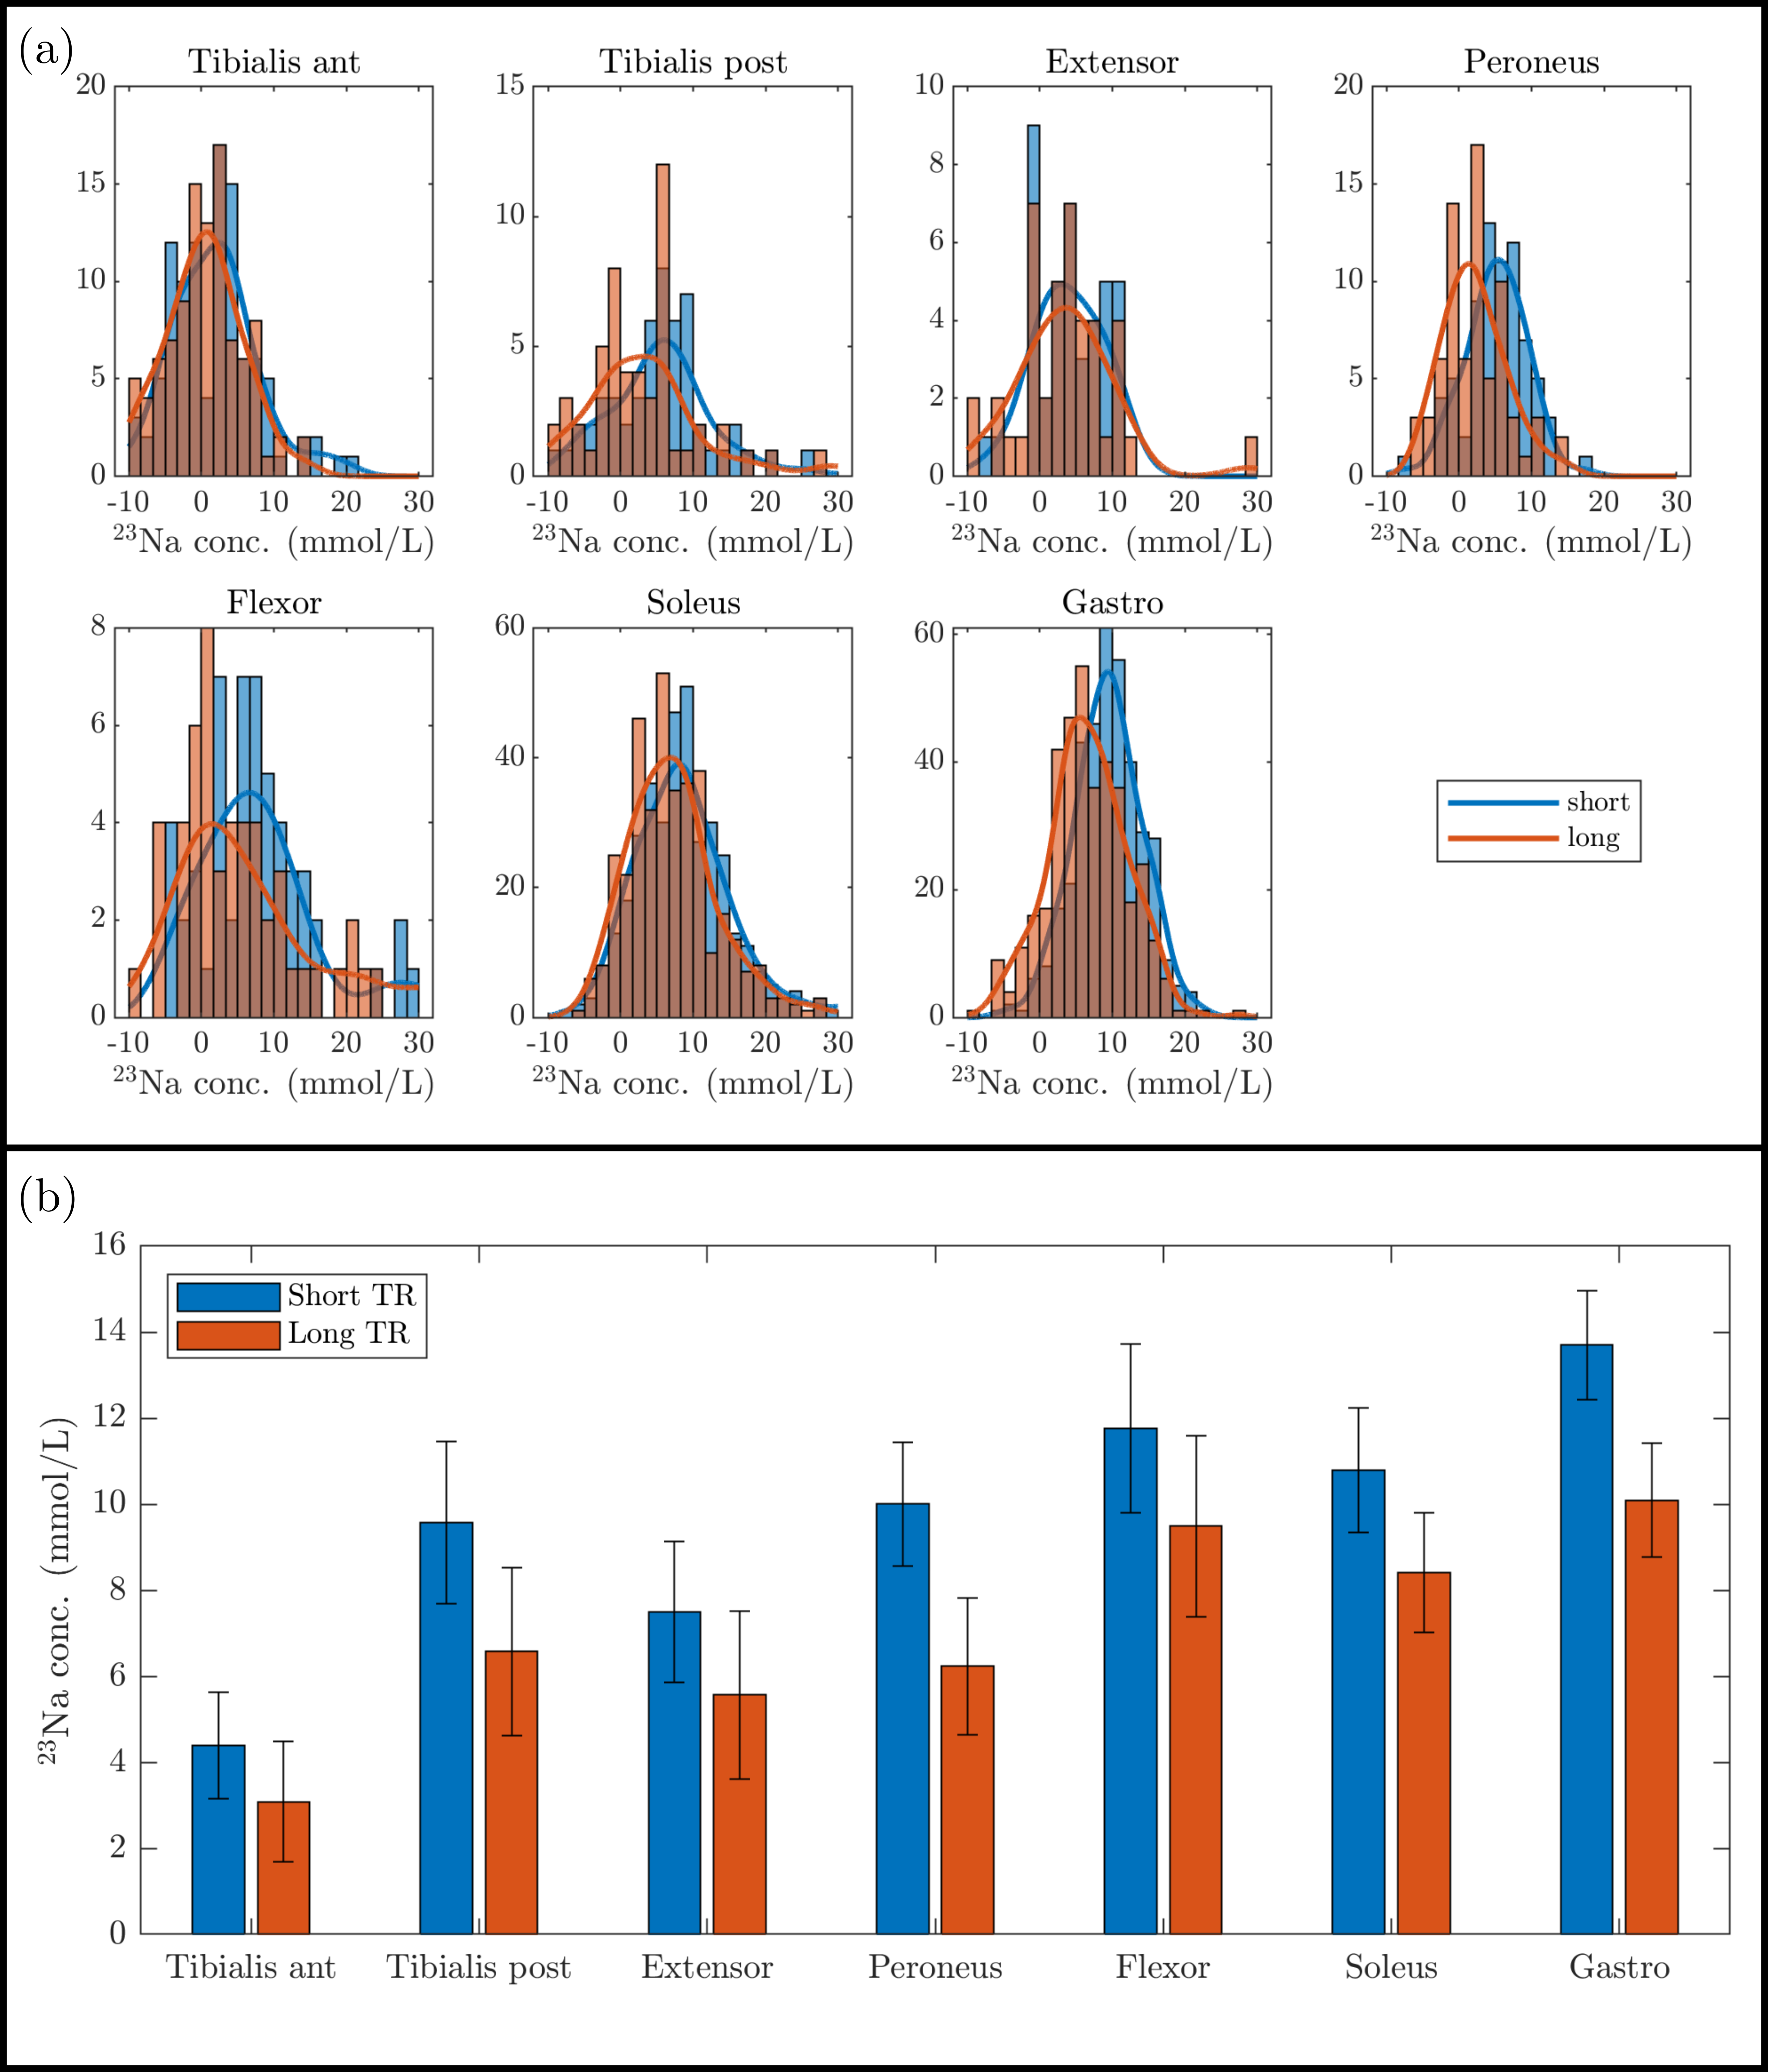
Acquisition: Scanning was performed on a 3T Philips Ingenia scanner using a 23Na birdcage leg coil (PulseTeq Ltd.) and the Q-body coil to collect 1H measures. The protocol comprised a 1H mDixon (0.4x0.4x8mm3, TE/TR=20/500ms, FA=90o, 15 slices, TA:4mins) for localisation and tissue segmentation. 3D GRE 23Na scans (3x3x30mm3, 10 slices) were acquired for TSC quantification using both a long TR and short TR acquisition, each of 15-minute scan duration. The long TR was collected with TE/TR=1.54/100ms, FA=90o and NSA 20, the short TR with TE/TR=1.26/13ms, FA=46o and NSA 155. A further series of scans were collected to estimate 23Na T1 using a saturation recovery scheme (TR =20,40,60,80,100ms, FA=90o, NSA 15 per TR, scan duration 11-minutes). Reference bottles of known 23Na concentration (10, 20, 30 and 40mmol/L NaCl) designed to have a T1 matched to that of calf tissue were positioned within the leg coil. The TR comparison protocol was collected on seven healthy subjects (3M:4F, 24-49yrs). In addition, a larger group of younger, older, and haemodialysis patients were also scanned.Analysis: The reference bottles were used to generate a linear regression, this this was applied to the calf signal to generate a TSC map. Image SNR (iSNR) was computed for the short and long TR images from an ROI in the calf divided by the standard deviation of an ROI in the background noise. Muscle groups and skin ROIs were drawn on the 1H mDixon images and applied to the TSC maps to determine 23Na T1 values in each muscle group. Histogram analysis was performed to compare TSC measures between the short and long TR scans across muscle groups and skin.
Results
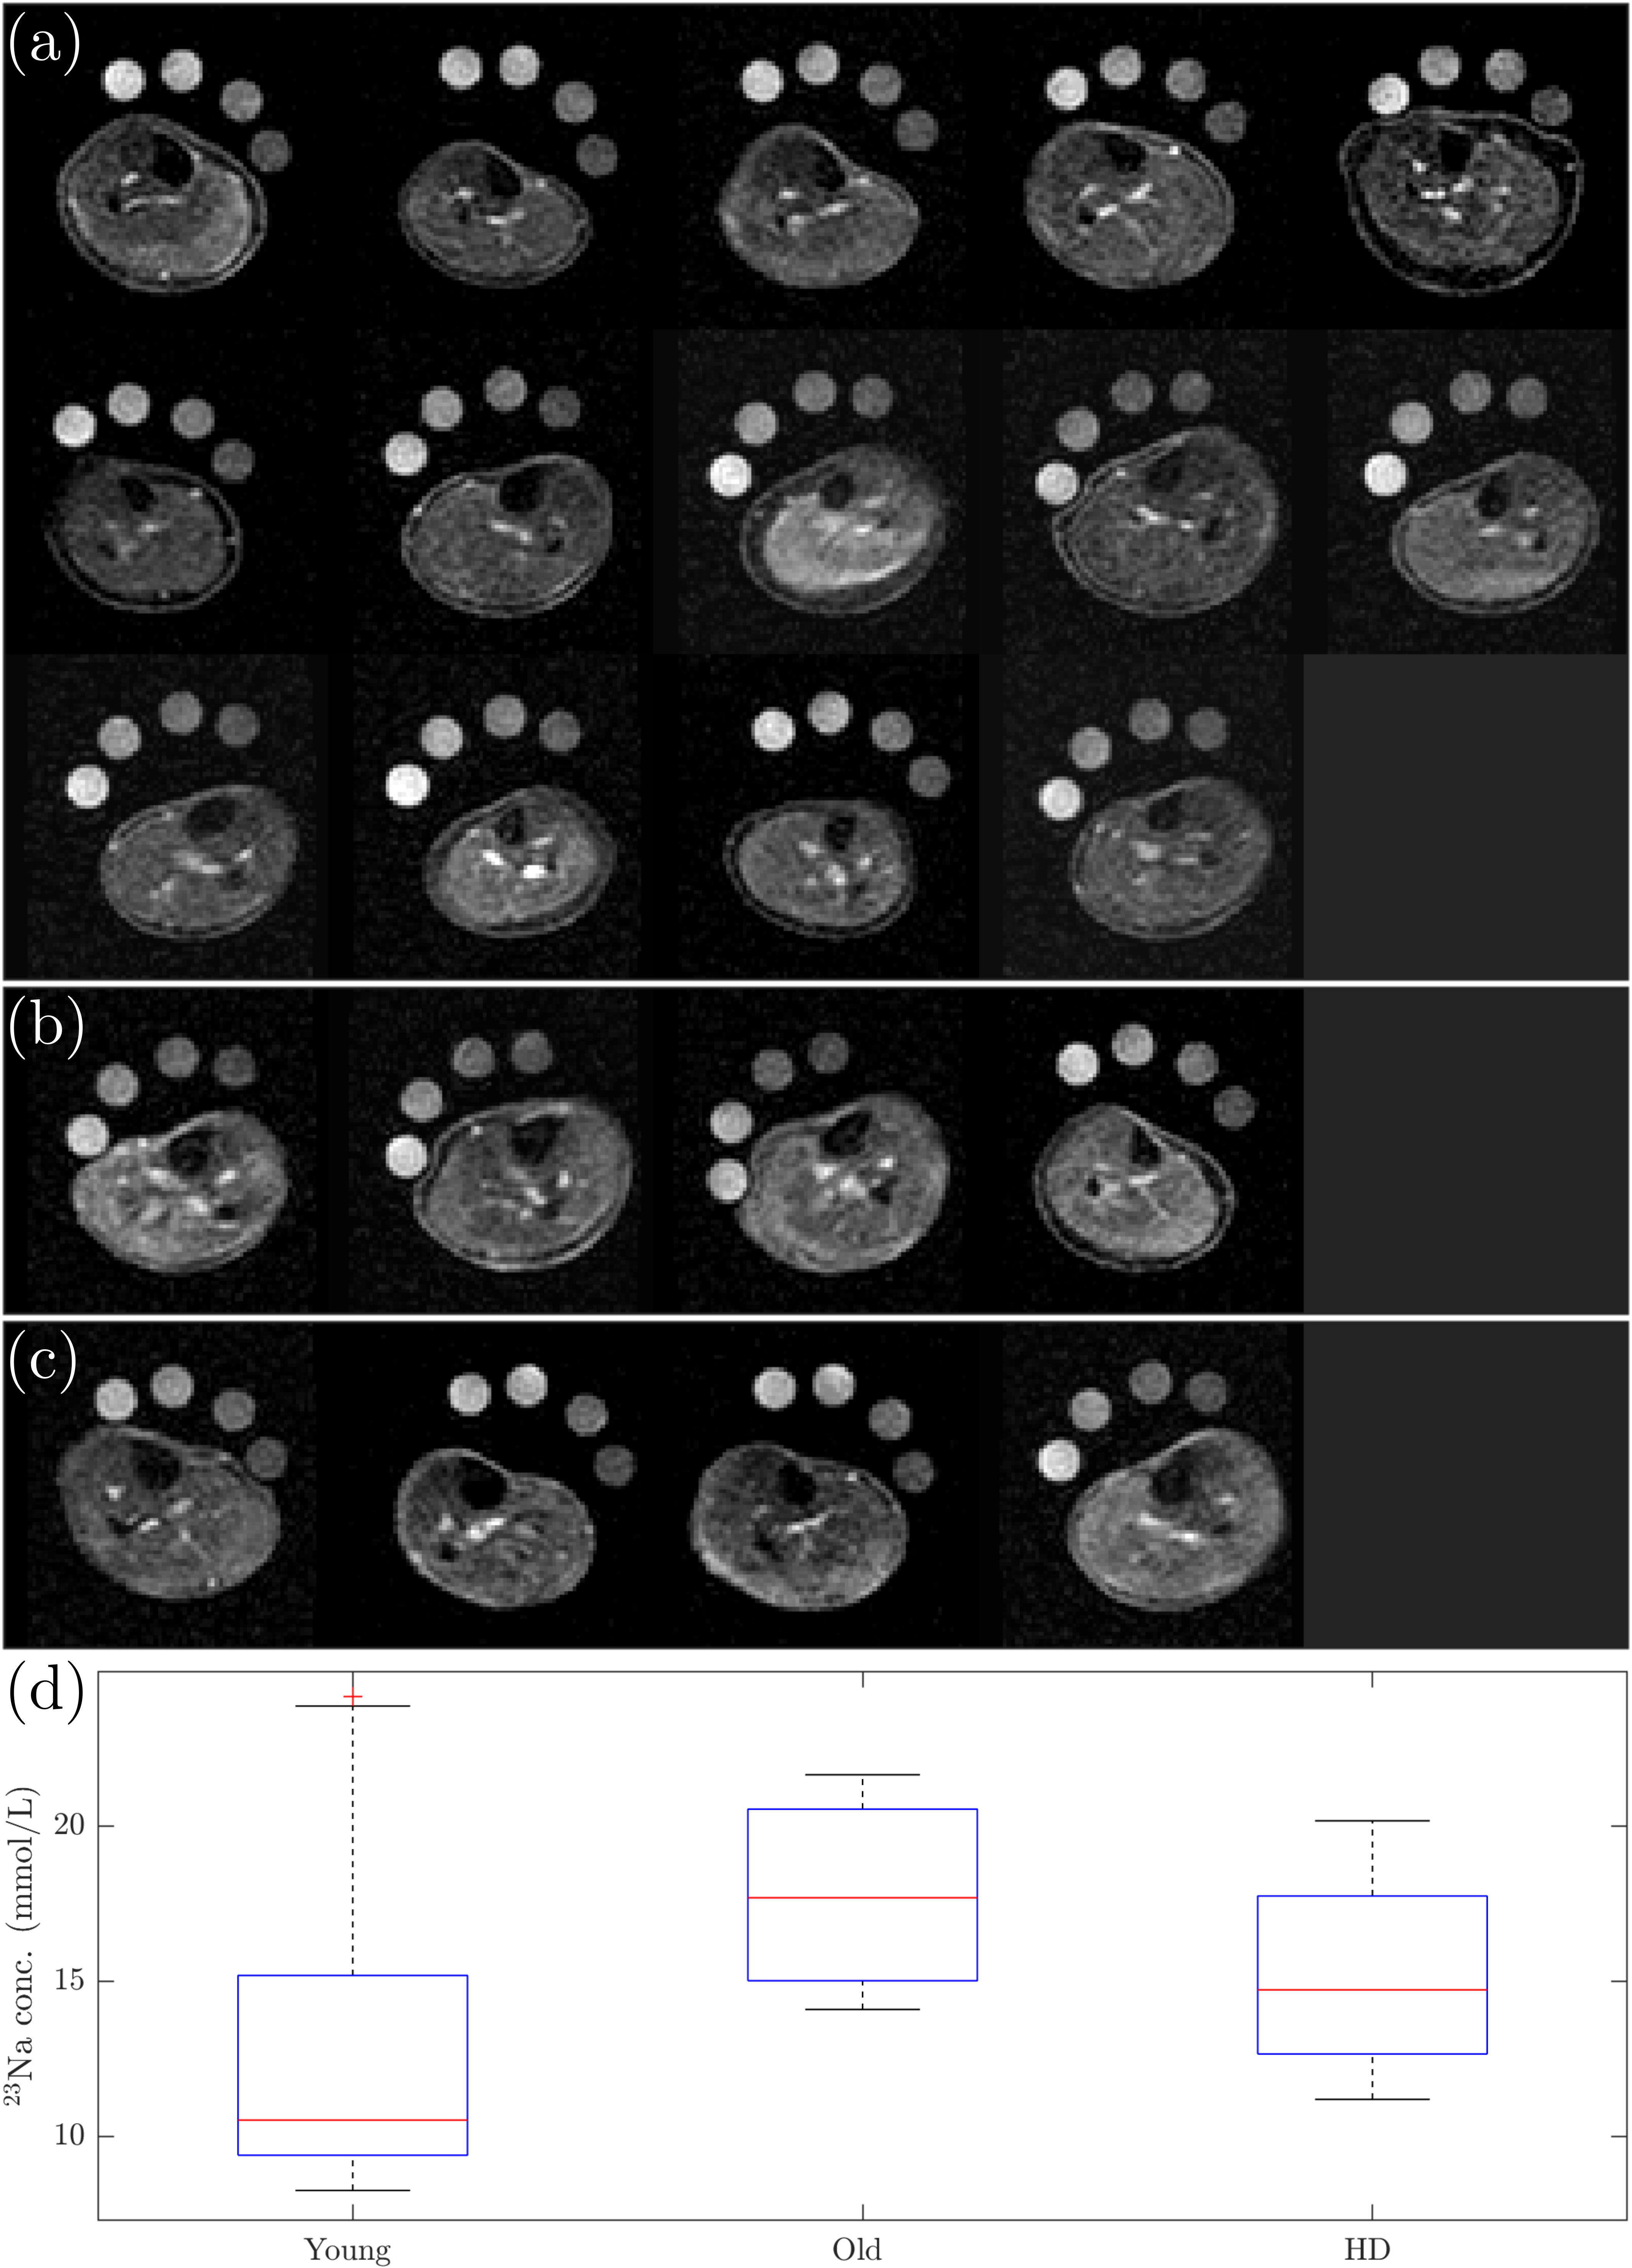
Figure 1 shows the TSC maps for the short and long TR acquisitions for all participants, a qualitative improvement in image quality is evident for the short TR, as quantified by the significant 62±6% increase in iSNR (p<0.001), and the skin can be much more clearly depicted. Figure 2 shows example T1 relaxation curves across calf muscle groups and measures for all subjects, the global tissue T1 value across subjects and muscles was 25.3±0.5ms. The mean T1 in the reference bottles was comparable at 28.1±0.6ms. Figure 4 shows example TSC histograms for short and long TR, note the lower peak for the long TR as a result of the lower SNR, particularly evident for the skin ROI. The mean TSC for short and long TR is shown for muscle groups in Fig. 4b. Figure 5 shows results of the short TR scan showing the lower TSC in younger subjects as compared to older subjects and haemodialysis patients.Discussion
A short TR GRE provides improved SNR for mapping TSC in the calf muscle and skin. The reference bottles are validated to have a similar T1 to the tissue, thus limiting errors in absolute TSC estimation (any T1 differences between reference bottles and muscle could account cause at most for only a 7% error in calculated TSC). In future, the transverse relaxation time will be computed in muscle and the reference bottles to allow the 23Na signal to be corrected for T2* decay, and we will explore partial volume correction of the skin.Conclusion
A short TR GRE provides improved image SNR for TSC measures, and has been validated by measuring the T1 of the reference bottles. In future, the transverse relaxation time will be computed in muscle and the reference bottles to allow the 23Na signal to be corrected for T2* decay, and we will explore partial volume correction of the skin.Acknowledgements
This work was made possible by the support of Philips Clinical scienceReferences
1. G. Chang, L. Wang, M. E. Schweitzer, and R. R. Regatte, “3D 23Na MRI of human skeletal muscle at 7 tesla: Initial experience,” Eur. Radiol., vol. 20, no. 8, pp. 2039–2046, Aug. 2010.
2. D. Kannenkeril et al., “Tissue sodium content in patients with type 2 diabetes mellitus,” J. Diabetes Complications, vol. 33, no. 7, pp. 485–489, Jul. 2019.
3. C. Kopp et al., “23Na magnetic resonance imaging of tissue sodium,” Hypertension, vol. 59, no. 1, pp. 167–172, 2012.
4. C. Ott et al., “Impact of renal denervation on tissue Na+ content in treatment-resistant hypertension,” Clin. Res. Cardiol., vol. 107, no. 1, pp. 42–48, Jan. 2018.
5. B. Canaud et al., “Sodium and water handling during hemodialysis: new pathophysiologic insights and management approaches for improving outcomes in end-stage kidney disease,” Kidney Int., vol. 95, no. 2, pp. 296–309, Feb. 2019.M. P. Schneider et al., “Skin sodium concentration correlates with left ventricular hypertrophy in CKD,” J. Am. Soc. Nephrol., vol. 28, no. 6, pp. 1867–1876, Feb. 2017.
6. A. Dahlmann et al., “Magnetic resonance-determined sodium removal from tissue stores in hemodialysis patients.,” Kidney Int., vol. 87, no. 2, pp. 434–41, 2015.
7. G. Madelin, “Sodium Magnetic Resonance Imaging: Biomedical Applications,” 2012.
8. J James, et al. “In vivo sodium MR imaging of the abdomen at 3T. Abdominal
Imaging, vol 40, no.7, pp. 2272-2280, Oct. 2015.
9. D. A. Gerlach et al., “Atrophy of calf muscles by unloading results in an increase of tissue sodium concentration and fat fraction decrease: a 23Na MRI physiology study,” Eur. J. Appl. Physiol., vol. 117, no. 8, pp. 1585–1595, Aug. 2017.
Figures